Patron: Her Majesty The Queen Rothamsted Research Harpenden, Herts, AL5 2JQ
Telephone: +44 (0)1582 763133 Web: http://www.rothamsted.ac.uk/
Rothamsted Research is a Company Limited by Guarantee Registered Office: as above. Registered in England No. 2393175. Registered Charity No. 802038. VAT No. 197 4201 51. Founded in 1843 by John Bennet Lawes.
Rothamsted Repository Download
A - Papers appearing in refereed journals
Ewert, E., Rodriguez, D., Jamieson, P., Semenov, M. A., Mitchell, R. A.
C., Goudriaan, J., Porter, J. R., Kimball, B. A., Pinter, P. J. Jr,
Manderscheid, R., Weigel, H-J., Fangmeier, A., Fereres, E. and
Villalobos, F. 2002. Effects of elevated CO2 and drought on wheat:
testing crop simulation models for different experimental and climatic
conditions. Agriculture, Ecosystems & Environment. 93 (1-3), pp.
249-266.
The publisher's version can be accessed at:
•
https://dx.doi.org/10.1016/S0167-8809(01)00352-8
The output can be accessed at:
https://repository.rothamsted.ac.uk/item/88y06/effects-
of-elevated-co2-and-drought-on-wheat-testing-crop-simulation-models-for-different-experimental-and-climatic-conditions
.
© 28 December 2001, Elsevier Science Bv.
Agriculture, Ecosystems and Environment 93 (2002) 249–266
Effects of elevated CO
2
and drought on wheat:
testing crop simulation models for different
experimental and climatic conditions
F. Ewert
a,∗, D. Rodriguez
b,c, P. Jamieson
d, M.A. Semenov
e, R.A.C. Mitchell
f,
J. Goudriaan
b, J.R. Porter
a, B.A. Kimball
g, P.J. Pinter Jr.
g, R. Manderscheid
h,
H.J. Weigel
h, A. Fangmeier
i, E. Fereres
j, F. Villalobos
jaDepartment of Agricultural Sciences, Royal Veterinary and Agricultural University, Agrovej 10, DK 2630 Taastrup, Denmark bPlant Production Systems, Wageningen University and Research Center, Haarweg 333, P.O. Box 430,
6700 Ak Wageningen, The Netherlands
cVictorian Institute for Dryland Agriculture, Natimuk Rd, Private Bag 260, Horshan, Victoria 3401, Australia dN.Z. Institute for Crop & Food Research Ltd., Private Bag 4704, Christchurch, New Zealand
eDepartment of Agricultural Sciences, IACR Long Ashton Research Station, University of Bristol, Bristol, BS41 9AF, UK fBiochemistry & Physiology Department, IACR-Rothamsted, Harpenden, Herts. AL5 2JQ, UK
gUS Water Conservation Laboratory, USDA–ARS, 4331 E. Broadway Road, Phoenix, AZ 85040, USA hInstitute of Agroecology, Bundesforschungsanstalt für Landwirtschft, Bundesallee 50, Braunschweig 38116, Germany
iSchloss Mittelbau (West), Institut für Landschafts- und Pflanzenökologie, Universität Hohenheim,
D-70599 Stuttgart-Hohenheim, Germany
jDepartmento de Agronomia (IAS–CSIC), University of Cordoba, Avda. Menendez Pidal s/n, E-14004 Cordoba, Spain
Received 26 April 2001; received in revised form 30 October 2001; accepted 7 November 2001
Abstract
Effects of increasing carbon dioxide concentration [CO2] on wheat vary depending on water supply and climatic conditions,
which are difficult to estimate. Crop simulation models are often used to predict the impact of global atmospheric changes on food production. However, models have rarely been tested for effects on crops of [CO2] and drought for different climatic
conditions due to limited data available from field experiments.
Simulations of the effects of elevated [CO2] and drought on spring wheat (Triticum aestivum L.) from three crop
simula-tion models (LINTULCC2, AFRCWHEAT2, Sirius), which differ in structure and mechanistic detail, were compared with observations. These were from 2 years of free-air carbon dioxide enrichment (FACE) experiments in Maricopa, Arizona and 2 years of standardised (in crop management and soil conditions) open-top chamber (OTC) experiments in Braunschweig and Giessen, Germany. In a simulation exercise, models were used to assess the possible impact of increased [CO2] on wheat
yields measured between 1987 and 1999 at one farm site in the drought prone region of Andalucia, south Spain.
The models simulated well final biomass (BM), grain yield (GY), cumulative evapotranspiration (ET) and water use efficiency (WUE) of wheat grown in the FACE experiments but simulations were unsatisfactory for OTC experiments. Radiation use efficiency (RUE) and yield responses to [CO2] and drought were on average higher in OTC than in FACE
experiments. However, there was large variation among OTC experiments. Plant growth in OTCs was probably modified by
∗Corresponding author. Tel.:+45-35-28-33-77; fax:+45-35-28-21-75. E-mail address: [email protected] (F. Ewert).
several factors related to plot size, the use (or not use) of border plants, airflow pattern, modification of radiation balance and/or restriction of rooting volume that were not included in the models. Variation in farm yields in south Spain was partly explained by the models, but sources of unexplained yield variation could not be identified and were most likely related to effects of pests and diseases that were not included in the models. Simulated GY in south Spain increased in the range between 30 and 65% due to doubling [CO2]. The simulated increase was larger when a [CO2]×drought interaction was assumed
(LINTULCC2, AFRCWHEAT2) than when it was not (Sirius).
It was concluded that crop simulation models are able to reproduce wheat growth and yield for different [CO2] and drought
treatments in a field environment. However, there is still uncertainty about the combined effects of [CO2] and drought including
the timing of drought stress and about relationships that determine yield variation at farm and larger scales that require further investigation including model testing.
© 2002 Elsevier Science B.V. All rights reserved.
Keywords: Wheat; Crop simulation models; CO2; Drought; Climatic conditions
1. Introduction
Limitation of water supply reduces wheat produc-tivity in many parts of the world. Increased atmo-spheric CO2concentration, [CO2], (IPCC, 2001) tends to increase wheat growth and yield (Kimball, 1983; Cure and Acock, 1986; Idso and Idso, 1994) more un-der drought conditions as compared with conditions with unlimited water supply (Kimball et al., 1995). This has been explained by the reduction in stomatal conductance and water use induced by [CO2] eleva-tion (Morison, 1985). Effects of [CO2] on wheat also depend on weather conditions, e.g. temperature (Long, 1991; Morison and Lawlor, 1999). However, the over-all understanding of the interactive effects of drought and [CO2] on wheat in relation to climatic conditions is limited.
Crop simulation models are useful tools to account for the complexity of plant and crop responses to vari-ation in water supply, [CO2] and weather and are in-creasingly used to assess the possible impact on food production of future global change (e.g. Wolf, 1993; Rosenzweig and Parry, 1994; Downing et al., 2000). However, available models differ in structure and de-tail and use different approaches to simulate the effects of [CO2], drought and weather on wheat. Experimen-tal data to test these models for combined changes in water supply and [CO2] in field environments are limited. Few data are available for wheat and refer to 2 years of free-air carbon dioxide enrichment (FACE) experiments performed in Maricopa, AZ (Kimball et al., 1995, 1999; Hunsaker et al., 1996; Pinter et al., 2000). Different models were tested with observa-tions from these experiments (Kartschall et al., 1995;
Grant et al., 1999; Tubiello et al., 1999). However, simulations from different models of the responses of wheat to [CO2] and drought have rarely been tested and compared for a wider range of conditions.
F. Ewert et al. / Agriculture, Ecosystems and Environment 93 (2002) 249–266 251
Confidence in model predictions of the effects of global change on crops is based on their ability to re-produce plant responses obtained from experimental observations. In the absence of such data, understand-ing of differences in models behaviour for a wider range of conditions becomes particularly important. The present study aims (i) to test different crop models to simulate the effects on wheat of [CO2] and drought for experiments in a field environment, (ii) to evalu-ate simulations for OTC experiments and (iii) to ap-ply the different models in a simulation exercise to assess the potential effects of elevated [CO2] on farm yields for a region where yield variation is mostly due to water availability. Three models, Sirius (Jamieson et al., 1998b) and modified versions of LINTULCC2 (Rodriguez and Goudriaan, 2000; Rodriguez et al., 2001) and AFRCWHEAT2 (Weir et al., 1984; Porter, 1993) were considered in this analysis. The models differ in structure and in detail and were chosen be-cause (i) they represent different modelling approaches of CO2 assimilation and (ii) they have simulated ef-fects of [CO2] (e.g. Jamieson et al., 2000; Wolf and Kempenaar, 1998) and water supply (e.g. Jamieson et al., 1998a) satisfactorily on field grown wheat in earlier studies. Data for model testing were taken from 2 years of FACE experiments performed at Maricopa, Arizona, with spring wheat Triticum aestivum L. cul-tivar Yecora Rojo and from 2 years of OTC experi-ments at two locations in Germany with spring wheat cultivar Minaret. In the OTC experiments, soil con-ditions and crop management were standardised and water supply was controlled. Effects of doubling CO2 on farm yields were simulated for spring wheat cul-tivar Cartaya grown between 1987 and 1999 at one location in the region of Andalucia, south Spain.
2. Materials and methods
2.1. Model descriptions
The three models (LINTULCC2, AFRCWHEAT2 and Sirius) used in this analysis have routines to sim-ulate phenological and canopy development, CO2 as-similation and partitioning and soil water balance. The models have been described in detail several times (see the following sections). Thus, model description is restricted to the processes and relationships, which
account for the effects of [CO2] and drought on wheat growth and yield. Particular emphasise is on the dif-ferences among models to simulate CO2assimilation and on the parts of the models, which have been mod-ified for this purpose.
LINTULCC2 (Rodriguez and Goudriaan, 2000; Rodriguez et al., 2001) simulates crop assimilation using detailed calculations of leaf energy balances and couples photosynthesis to stomatal conductance and root water uptake. LILTULCC2 uses a biochem-ical model of leaf photosynthesis (Farquhar et al., 1980) which is coupled with an equation for stomatal conductance (Leuning, 1995). Stomatal conductance is also reduced due to drought (Leuning et al., 1998). Canopy development is calculated as a function of air temperature and sink and source interactions (Rodriguez and Goudriaan, 2000; Rodriguez et al., 2001). Radiation is separated into direct, diffuse and near infrared radiation and intercepted by canopy lay-ers (Goudriaan, 1990). Assimilation is simulated for sunlit and shaded leaves of each layer and integrated over the canopy (Rodriguez and Goudriaan, 2000; Rodriguez et al., 2001). In LINTULCC2, increase in [CO2] will positively affect leaf photosynthesis and canopy size but will reduce stomatal conductance and transpiration (Rodriguez et al., 2001). Drought effects are accounted for by factors, which reduce leaf ex-pansion and longevity, stomatal conductance and the light-saturated rate of photosynthesis. Drought fac-tors are calculated from plant available water, which is calculated for a layered soil profile using relation-ships that describe downward root front velocity and the distribution of root length density (Monteith et al., 1989). Water uptake is the minimum of water avail-ability calculated from a maximum uptake rate per unit root length (supply) and evaporative demand. The latter is calculated using the combination equation of Penman–Monteith (Monteith, 1981).
function of cumulative GAI from the top of the canopy (Charles-Edwards, 1978). Leaf assimilation is calculated using a non-rectangular hyperbolic func-tion to simulate leaf photosynthesis in response to light with a relationship to account for variation in temperature (Weir et al., 1984). The maximum pho-tosynthetic rate is determined by atmospheric CO2 concentration and the combined physical resistances to [CO2] uptake, including boundary, stomatal and mesophyll resistance (Weir et al., 1984). Atmospheric [CO2] affects quantum efficiency, i.e. the initial slope of the photosynthesis–light response curve (Porter, 1993). A modification has been introduced to re-duce crop transpiration linearly with [CO2] elevation assuming a reduction in crop transpiration by 10% when [CO2] is double current values (Goudriaan and Unsworth, 1990). Two factors are calculated from the ratio of water available for extraction and the demand for crop transpiration to account for the drought ef-fects on tillering, leaf extension and senescence and photosynthesis (Porter, 1993). Soil water uptake is simulated as the lesser of evaporative demand and soil water supply, which is calculated from a layered soil profile using calculations of root front velocity and a root restriction factor based on root length density (Jamieson and Ewert, 1999). Potential evaporation was calculated using the Penman–Monteith equation (Monteith, 1965). Originally, AFRCWHEAT2 under-estimated evapotranspiration (ET) in the well-watered (WW), ambient [CO2] treatments in the FACE ex-periments, so the root restriction factor was mod-ified to be less severe (Ritchie and Otter, 1985). However, it is as likely that the underestimation of ET was due to an underestimation of potential ET at the Maricopa FACE site (Tubiello et al., 1999; Section 2.3).
The simplest approach to simulate the effects of [CO2] and drought on wheat growth and yield is taken by Sirius. Biomass (BM) production is calculated as the product of intercepted photosynthetically active radiation (IPAR) and radiation use efficiency (RUE), which is constant unless reduced under extreme water stress (Jamieson et al., 1998b). This approach was modified assuming that RUE increases linearly due to [CO2] elevation so that doubling the ambient CO2 concentration increases RUE by 30% (Jamieson et al., 2000). Radiation interceptance is related to GAI via Beer’s law, and GAI is calculated as a function of
thermal time (Jamieson et al., 1998b). GAI can be reduced due to drought, which is represented by one factor calculated from the accumulated difference between actual ET and precipitation plus soil water stored in the rooted soil volume (Jamieson et al., 1998b). In Sirius, elevated [CO2] may increase GAI and enhance canopy senescence but does not reduce transpiration as it is considered in LINTULCC2 and AFRCWHEAT2. Thus, Sirius simulates [CO2] effect on growth independent of water supply, which is different to the other two models (see the earlier sections). Potential evaporation is calculated using the Penman equation as formulated by French and Legg (1979) (Jamieson et al., 1998b). Unmodified, Sirius underestimated potential ET in the FACE ex-periments. Again, this is probably due to the arid and rather dry climate of the location (Tubiello et al., 1999) with substantial advective enhancement of ET in an irrigated field within a desert environment. Thus, simulations of potential ET in Sirius were cor-rected by a factor of 1.7 to account for this effect (Section 2.3).
The major time step of the three models is 1 day, ex-cept for the assimilation calculations in LINTULCC2 and AFRCWHEAT2, which are simulated hourly and integrated over a day. All simulations were performed using information about soil characteristics, water and nitrogen supply and data for temperature, radiation, rainfall/irrigation and CO2concentration measured in the FACE experiments, within the OTCs and at the field site in south Spain (Section 2.2) as input data. There were no limitation from nutrients or additional stresses due to pests and weeds in all simulations, which was consistent with experimental performance (Section 2.2).
2.2. Experimental
F
.
Ewert
et
al.
/Agricultur
e,
Ecosystems
and
En
vir
onment
93
(2002)
249–266
Kimball et al. (1995, 1999), Hunsaker et al. (1996), and Pinter et al. (2000). CO2 blowers caused some increase in air and canopy temperatures in the high [CO2] treatments of the FACE experiments (Pinter et al., 2000) and this effect was not accounted for in the models. Detailed information about the perfor-mance of the OTC experiments can be obtained from Manderscheid et al. (2001). All OTC experiments were performed following a standard protocol includ-ing crop management and the use of a standard soil in all experiments (Cambisol, loamy sand with drained upper and lower limits of 0.20 and 0.04 m3m−3, re-spectively), (Manderscheid et al., 2001). However, there were differences among OTC experiments with respect to the size of the plots/subplots and whether or not border plants were grown in order to avoid penetration of horizontal light from the site into the plots (Table 1). Also, chambers absorbed between 20 and 45% of the incoming radiation depending on the experiment (Table 1). The FACE and OTC ex-periments were irrigated. Irrigation was reduced for plants in the drought treatments either via reduced amounts of irrigated water at each day of irrigation or via a reduced number of irrigation days, depending on the experiment (Hunsaker et al., 1996; Manderscheid et al., 2001). Nutrients were supplied to avoid addi-tional stresses and pests and weeds were controlled as required in all FACE and OTC experiments. Informa-tion about measurements of final above ground BM, GY and cumulative ET considered in this analysis is given by Tubiello et al. (1999) for FACE and by Man-derscheid et al. (2001) for OTC experiments. Water use efficiency (WUE) (g mm−1) was calculated as the ratio of total above ground BM to cumulative ET.
Effects of doubling CO2on farm yields were sim-ulated for spring wheat cultivar Cartaya grown be-tween 1987 and 1999 at Montefrio (4◦125W and 37◦1845N), Granada, Spain. Information about sea-sonal rainfall, mean seasea-sonal temperature and solar radiation for this site is given in Table 2. There was no additional irrigation of plants to minimise effects of drought due to low rainfall. In all years crop manage-ment was to avoid additional stresses due to limitation of nutrient supply, pests and weeds. The soil at this site had drained upper limits and drained lower limits of 0.36 and 0.20 m3m−3, respectively within the top 0.30 m soil profile and 0.72 and 0.39 m3m−3between 0.30 and 1.20 m.
Table 2
Seasonal averages of temperature and solar radiation and seasonal rainfall measured at Cordoba and Montefrio, Andalucia, Spaina
Year T (◦C) Rainfall (mm)
Solar radiation (MJ m−2per day)
Cordoba
1997/1998 15.2 293 16.7
Montefrio
1987/1988 12.2 289 18.5
1988/1989 13.5 269 18.3
1989/1990 15.6 237 22.0
1990/1991 13.0 313 19.5
1991/1992 13.6 299 19.7
1992/1993 13.9 186 20.4
1993/1994 14.3 252 19.6
1995/1996 13.4 576 18.7
1996/1997 13.2 415 17.7
1997/1998 15.4 215 21.3
1998/1999 15.0 134 20.2
aData were not available for Montefrio, 1994/1995.
2.3. Model calibration
F. Ewert et al. / Agriculture, Ecosystems and Environment 93 (2002) 249–266 255
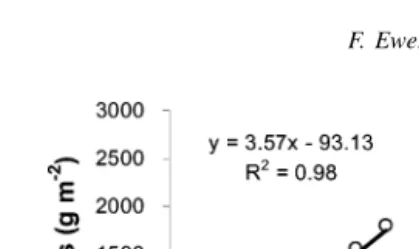
Fig. 1. Relationships between above ground BM and accumulated IPAR for the WW, low [CO2] treatments from FACE (1992/1993) and OTC (Braunschweig in 1998) experiments.
wheat growth in the OTCs, which was due to the high RUE observed in all OTCs (Fig. 1). Thus, sim-ulations of RUE were adjusted using the data from the WW, ambient CO2 treatment in Braunschweig 1998.
Model calibration for spring wheat cultivar Cartaya grown in south Spain was performed using measure-ments of leaf emergence, GAI and final above ground
Fig. 2. Calibration results of LINTULCC2, AFRCWHEAT2 and Sirius for above ground BM and GY of spring wheat varieties observed in WW, ambient [CO2] treatments at (a) Maricopa 1992/1993 (cultivar Yecora Rojo), (b) Braunschweig 1998 (cultivar Minaret) and (c) Cordoba (cultivar Cartaya), 1998. DAE, days after emeregence.
BM and GY obtained from an independent field ex-periment at Cordoba, Andalucia, in 1997/1998 (see Table 2 for climatic conditions) without limitations of water and nutrient supply (Gomez et al., 1999). Calibration results for FACE and OTC experiments and for the cultivar grown in Spain are presented in Fig. 2.
2.4. Criteria for model comparison
Simulation results of development stages were evaluated using mean deviation (MD) and root mean square differences (RMSD) between simulated and observed data. A more advanced approach was taken to compare simulations of wheat growth and yield with observation. This approach is based on the mean square deviation (MSD) and its components: squared bias (SB), squared difference between standard devi-ations (SDSD) and lack of correlation weighted by the standard deviations (LCS) (Kobayashi and Salam, 2000). It was shown (Kobayashi and Salam, 2000) that
where SB=(x¯− ¯y)2, SDSD=(SDs−SDm)2, and LCS=2SDsSDm(1−r), where
r=
(1/n)(xi − ¯x)(yi − ¯y) SDsSDm
The terms SDs and SDm represent the standard deviations of xi and yi (i = 1, . . . , N), simulated and measured values, respectively. Advantages of this approach in comparison to the correlation–regression approach with the multiple criteria: correlation coef-ficient, the slope and the y-intercept of the regression line, which are often given in combination with RMSD and MD were demonstrated by Kobayashi and Salam (2000). The MSD approach indicates the overall de-viation of model simulations. The MSD components, which are simply additive, represent different aspects of the overall deviation; MSD is equal to RMSD2, SB
Table 3
Dates of anthesis (An) and maturity (Ma), and final above ground BM, GY, ET and WUE for BM measured in ambient (L) and elevated [CO2] (H) treatments under WW and WS conditions of experiments considered in the present analysis
Experiment Treatment An (DOY)a Ma (DOY)a BM (g m−2) GY (g m−2) ET (mm) WUE (g mm−1)
Water CO2
Maricopa 1992/1993 WW L 85 133 1960 825 625 3.1
WW H 83 126 2156 900 598 3.6
WS L 84 126 1528 648 457 3.3
WS H 81 124 1721 759 479 3.6
Maricopa 1993/1994 WW L 96 141 1893 804 659 2.9
WW H 92 137 2022 862 623 3.2
WS L 93 133 1348 605 435 3.1
WS H 91 130 1583 724 439 3.6
Braunschweig 1998 WW L 151 216 1801 836 402 4.5
WW H 151 216 1991 875 344 5.8
WS L 151 208 1201 512 224 5.4
WS H 151 208 1763 755 224 7.9
Braunschweig 1999 WW L 158 195 1842 901 452 4.1
WW H 158 195 2068 1014 449 4.6
WS L 155 205 960 434 234 4.1
WS H 155 205 1392 654 239 5.8
Giessen 1998 WW L 173 214 1525 790 553 2.8
WW H 173 214 2103 1107 548 3.8
WS L 173 209 845 401 321 2.6
WS H 173 209 1337 657 318 4.2
Giessen 1999 WW L 185 235 1407 566 440 3.2
WW H 185 235 1850 832 435 4.3
WS L 183 224 1249 529 127 9.8
WS H 183 224 1373 647 124 11.1
aDay of the year.
represents the bias of the simulations and is equal to MD2, SDSD indicates the difference in the variation of simulated and measured data and LCS gives infor-mation of how the pattern of variation in the measure-ments was simulated (Kobayashi and Salam, 2000).
3. Results and discussion
3.1. Observations from FACE and OTC experiments
F. Ewert et al. / Agriculture, Ecosystems and Environment 93 (2002) 249–266 257
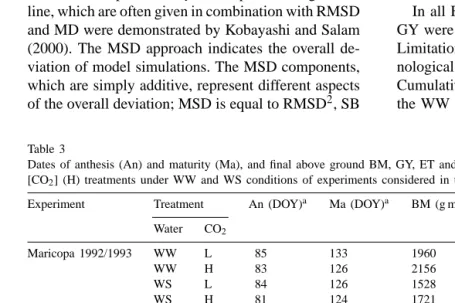
Fig. 3. Observed increase in BM (% of ambient [CO2] treatments) per 100mol mol−1 increase in [CO
2] of spring wheat in WS vs. WW treatments from FACE (closed symbols) and OTC (open symbols) experiments.
ET under elevated [CO2] in the WW treatments in all experiments.
However, there were some differences in wheat growth and development between both types of ex-periments. Phenological development was enhanced by few days due to [CO2] elevation in the FACE ex-periments (Table 3). However, this was primarily due to an artefact of the CO2 blowers that caused about 1◦C elevation of night-time air and canopy tempera-tures (Pinter et al., 2000). There were no differences in the air-flow pattern between CO2treatments in the OTC experiments and no effect of elevated [CO2] on phenological development was observed.
Effects of [CO2] on BM and GY were more pronounced in the OTC as compared to FACE ex-periments (Tables 3 and 5). This was only partly explained by the differences in the gas concentra-tions in the high [CO2] treatments between OTCs
Table 4
Mean differences (MD, days) and RMSD (days) between simulated and observed dates of anthesis and maturity for FACE and OTC experiments considered in this study using three simulation models, LINTULCC2, AFRCWHEAT2 and Siriusa
Type of experiment Parameter Anthesis Maturity
LINTUL AFRC Sirius LINTUL AFRC Sirius
FACE MD 1.9 5.9 3.9 0 7.25 2
RMSD 5.5 7.2 5.1 4.6 8.2 4.6
OTC MD −2.6 −1.1 −1.9 3.06 −1.8 −6.9
RMSD 4.9 3.1 5.3 7.3 7.8 9.8
aValues represent averages of all [CO
2] and water treatments.
(about 680mol mol−1 CO2) and FACE (about 550mol mol−1 CO2), (Table 1). Further analysis indicated that the relative increase in final BM and GY (not shown) per 100mol mol−1 increase in [CO2] was about 4.7 and 8.3% for the WW and water-stressed (WS) treatments, respectively in the FACE experiments (Fig. 3). This was only half the relative increase observed in the OTCs (about 8.0 and 13.9% for WW and WS conditions, respectively, Fig. 3). Also, there was a substantial scatter in the responses of wheat to [CO2] and drought in OTC experiments (Fig. 3).
ET was higher in the FACE compared to the OTC experiments, which was probably due to the arid and dry climate of the FACE location (Tubiello et al., 1999) and the longer growing season of cultivar Yecora Rojo compared to cultivar Minaret grown in the FACE and OTC experiments, respectively. Since there was lit-tle difference in final BM between the two types of experiments, calculated WUEs were higher for OTC compared to the FACE experiments.
3.2. Simulations for FACE experiments
3.2.1. Phenology
Fig. 4. Comparison of simulated (LINTULCC2, AFRCWHEAT2 and Sirius) with measured (a) final above ground BM, (b) GY, (c) cumulative ET and (d) WUE for BM of spring wheat cultivar Yecora Rojo subjected to four treatments (ambient and elevated [CO2], WW and WS) in two FACE experiments at Maricopa in 1992/1993 and 1993/1994. Data from the WW, ambient [CO2] treatment in 1992/1993 were used for model calibration (Fig. 2) and are not included.
compared to the ambient plots (Table 3). However, as indicated earlier this was primarily due to an artefact of the CO2 blowers (Pinter et al., 2000). There was little evidence that [CO2] effects on stomatal conduc-tance and leaf temperature affected phenological de-velopment of wheat grown in the FACE experiments (Pinter et al., 2000). Since no adjustments were made in the models to account for the blower effect, differ-ences between [CO2] treatments were not simulated, which explains some of the differences between ob-served and simulated dates of anthesis and maturity in the FACE experiments (Table 4).
3.2.2. Final biomass and grain yield
Final BM and GY were simulated close to ob-served values by all three models (Fig. 4), although agreement between simulated and observed data was better for final BM than for GY (Fig. 4). Differences among models were only small. MSD between simu-lated and observed BM and GY were slightly higher for LINTULCC2 as compared to AFRCWHEAT2 and Sirius (Fig. 5). This was mainly due to high SDSD values for LINTULCC2 (Fig. 5). The model
simulated more variation in final BM and particularly in GY among years and treatments than was observed (Figs. 4 and 5).
3.2.3. Evapotranspiration and water use efficiency All three models simulated cumulative ET and WUE satisfactorily for the FACE experiments (Fig. 4). MSD values for ET and WUE were similar for all models (Fig. 5). However, some differences among models became evident from the analysis of MSD components. Again, LINTULCC2 simulated more variation in ET and WUE among years and treatments than was observed, as indicated by higher SDSD values compared to the other two models (Fig. 5). In contrast, MSD values for AFRCWHEAT2 and Sirius were primarily determined by SB values (Fig. 5). Both models slightly overestimated average observed ET, which also explains that observed WUE was slightly underestimated by the two models (Figs. 4 and 5).
3.2.4. Interaction between [CO2] and drought
F. Ewert et al. / Agriculture, Ecosystems and Environment 93 (2002) 249–266 259
Fig. 5. MSD and its components: SB, SDSD and LCS calculated from the simulations of (a) final above ground BM, (b) GY, (c) cumulative ET and (d) WUE with LINTULCC2, AFRCWHEAT2 and Sirius presented in Fig. 4.
(Table 5). Additional effect of [CO2] blowers on canopy development, which partly offset the [CO2] effect in the FACE experiments (Pinter et al., 2000) and which were not considered in the models, might provide some explanation for this overestimation. Experimental data suggest that the stimulatory effects of elevated [CO2] were more pronounced under drought than under WW conditions (Table 5). LIN-TULCC2 and AFRCWHEAT2 explicitly contain interaction between [CO2] and water supply and, therefore, reproduced the observed interaction be-tween [CO2]×drought (Table 5). No such interaction
Table 5
Observed and simulated [CO2] effects (elevated/ambient) on final above ground BM and GY for WW and WS treatments of wheat grown in FACE an OTC experiments
Type of experiment variable Observed LINTULCC2 AFRCWHEAT2 Sirius
WW WS WW WS WW WS WW WS
FACE
BM 1.08 1.15 1.19 1.29 1.25 1.30 1.16 1.16
GY 1.08 1.18 1.18 1.34 1.20 1.31 1.16 1.16
OTC
BM 1.23 1.40 1.25 1.33 1.18 1.25 1.25 1.25
GY 1.26 1.46 1.26 1.47 1.17 1.24 1.25 1.25
an effect not accounted for in the models. On the other hand, this effect was again offset by reductions in cumulative ET associated with the reduced growth duration. So the significance of [CO2] effects on tran-spiration in the field remains unclear, but is likely to be small.
3.3. Simulations for open-top chamber experiments
Phenological development of wheat grown in OTC experiments was simulated reasonably well with all three models (Table 4). However, there was a large scatter between simulations and observations for final BM, GY, cumulative ET and WUE for AFR-CWHEAT2 (Fig. 6), LINTULCC2 and Sirius (not shown). Effects of [CO2] on wheat BM and GY were higher in the OTC as compared to the FACE experi-ments and were underestimated by the models, par-ticularly with AFRCWHEAT2 and Sirius (Table 5). Since simulations were generally unsatisfactory (Fig. 6) one model (AFRCWHEAT2) was used to identify possible sources for unexplained variability in wheat growth and yield from OTC experiments.
Fig. 6. Comparison of simulated (AFRCWHEAT2) and measured (a) final above ground BM, (b) GY, (c) cumulative ET and (d) WUE of spring wheat cultivar Minaret subjected to four treatments (ambient and elevated [CO2], WW and WS) in OTC experiments at Braunschweig and Giessen in 1998 and 1999. Data from the WW, ambient [CO2] treatment in Braunschweig 1998 were used for model calibration (Fig. 2) and are not included. Closed symbols represent the experiment in Braunschweig 1999, with plants grown in large plots and surrounded by border plants (see text and Table 1 for explanation).
3.4. Variability of OTC experiments
Although models were adjusted to account for high RUE observed in the OTCs (Fig. 1) there was a vari-ation in RUE among experiments, which was nega-tively related to the plot size (Fig. 7a). However, it should be noted that RUE was calculated from mea-sured LAI and radiation above the canopy assuming a constant light extinction coefficient. Thus, effects of lateral light were not accounted for. It is likely that lat-eral light increased with decreasing plot size and that more light was intercepted in smaller plots. However, such relationships were not considered in the models and simulations were particularly unsatisfactory when plants were grown in small pots (Fig. 7b).
F. Ewert et al. / Agriculture, Ecosystems and Environment 93 (2002) 249–266 261
Fig. 7. Relationships between (a) observed RUE and plot area and (b) differences between simulated and observed final BM and plot area for WW, low [CO2] treatments of OTC experiments in Braunschweig and Giessen in 1998 and 1999.
the deviation of model simulations from observed data (Fig. 8b).
Cumulative ET was underestimated by Sirius and by the original, unmodified version of AFRCWHEAT2 (not shown). In the models, potential ET (PET) is calculated using well-validated Penman (Sirius) or Penman–Monteith (AFRCWHEAT2) equations (e.g. Jamieson et al., 1998a; Jamieson and Ewert, 1999). However, these equations were developed for field conditions and might not represent the microclimatic conditions within OTCs. For instance, OTC plots were relatively small and there was constant mixture and movement of air through the canopy. Thus, crop boundary resistance was always small, which is dif-ferent to field crops. It is also known that long-wave radiation is increased in OTCs compared to out-side conditions (see Kimball et al., 1997) and is not
Fig. 8. Relationships between (a) observed [CO2] effects on final BM and plot area, and (b) differences between simulated and observed [CO2] effects on final BM and plot area for WW treatments of OTC experiments in Braunschweig and Giessen in 1998 and 1999. Closed and open symbols refer to experiments with or without border plants, respectively.
detected by radiometers. On the other hand, the root-ing volume was restricted in most experiments, which might have decreased root resistance and increased water uptake and transpiration. Simulations with the modified version of AFRCWHEAT2 (i.e. reduced root restriction, see Section 2.3) closely simulated observed average ET (not shown) but variation in ET was reproduced satisfactory only for some experi-ments (Fig. 6c). This indicates that modification of soil water balance due to OTCs can differ depending on the performance of the individual experiment.
Fig. 9. Observed farm yields of spring wheat cultivar Cartaya at Montefrio, Andalucia, Spain, between 1987 and 1999 and simulated (LINTULCC2, AFRCWHEAT2, Sirius) GYs for (a) ambient [CO2] and (b) 2×ambient [CO2]. Data for the 1994/1995 season were not available.
(2001) demonstrating that crop models can repro-duced canopy assimilation well for plants grown in OTC experiments performed under these conditions.
3.5. Simulations of [CO2] effects on farm yields
3.5.1. Simulations for ambient conditions
Spring wheat cultivar Cartaya was simulated be-tween 1978 and 1999 at Montefrio (Granada), south Spain, for ambient conditions (350mol mol−1CO2) and simulations were compared with observed farm yields (Fig. 9a). Predicted yields agreed well with observations in only some years. In most years, yields were either overestimated or underestimated. Overes-timation of yields by all three models might provide indication for some additional management effects re-lated to the control of pests and diseases, etc.—factors not considered in the models. However, there were also differences among models. LINTULCC2 predicted some much higher yields than observed (Fig. 9a) and SB was highest for this model (Fig. 10). Some of these overestimations were associated with unsatisfactory predictions of anthesis date, which marks a period of great sensitivity to drought in wheat (Fischer, 1985). Sirius simulated less variation in GY among years than observed (Fig. 9a) which is also indicated by the high SDSD value for this model (Fig. 10). However, the overall MSD was lowest for Sirius. All models had problems reproducing the observed pattern in the vari-ation of GY among years (see LCS values, Fig. 10). Other studies have also reported problems in reproduc-ing observed variation in farm (Mitchell et al., 2001a)
and regional yields (Landau et al., 1998; Mitchell et al., 2001a) with mechanistic crop models. However, it has been argued whether observed yield variations can be attributed only to known physiological effects that are included in the models (Jamieson et al., 1999). Other factors related to pests, diseases, etc. that models do not account for might play a more important role in determining such yield variations (Jamieson et al., 1999; Landau et al., 2000). Such factors may also have affected wheat growth and yield in the present study. This might also explain the observed weak relation-ship between GY and seasonal rainfall (R2 = 0.21, Fig. 11a), although rainfall was low in several years (Table 2). On the other hand wheat varieties grown in this region show some adaptation to the dry growing conditions often experienced in late spring through to summer, e.g. spring wheat cultivar Cartaya grown in Cordoba between 1997 and 1999 reached anthesis
F. Ewert et al. / Agriculture, Ecosystems and Environment 93 (2002) 249–266 263
Fig. 11. (a) Observed and (b) simulated relationships between GY and seasonal rainfall of spring wheat cultivar Cartaya at Montefrio, Andalucia, Spain, between 1987 and 1999. The fitted regressions are of the form y=a+bx. The values for a and b are for observed, 0.647, 351.9 (R2=0.21,P =0.15); LINTULCC2, 1.142, 363.3 (R2=0.41,P =0.033); AFRCWHEAT2, 0.861, 311.7 (R2=0.53,
P=0.011) and Sirius, 0.472, 374.5 (R2=0.30,P=0.08).
about 2–3 weeks earlier than spring wheat cultivar Minaret and drought effects on yield were less for cul-tivar Cartaya than for culcul-tivar Minaret (Fereres et al., 2001). All three models were calibrated to account for the early development of cultivar Cartaya (Section 2.3). However, relationships between GY and rain-fall were more significant from models simulations compared to observations with only small differences among models (Fig. 11b) suggesting that other factors not included in the models might have affected wheat growth and yield observed at this location.
3.5.2. Simulations for elevated [CO2]
The simulations were repeated assuming a doubling of the atmospheric CO2 concentration (700mol mol−1 CO2), (Fig. 9b). Simulated GY in-creased due to doubling [CO2] between 30 and 65% depending on year and model (not shown). Simula-tions with LINTULCC2 and AFRCWHEAT2 sug-gested that GY would increase on average over all years by about 50%, due to doubling [CO2] (Fig. 12), which however, would vary depending on the year (Figs. 9b and 12). No interaction between [CO2] and drought was assumed in Sirius and a smaller increase in GY (30%) due to high [CO2] was simulated by the model with no variation among years (Fig. 12). In LINTULCC2 and AFRCWHEAT2 transpiration is reduced by increased [CO2]. However, simulated vari-ation in wheat responses to doubling [CO2] from both models was not related to seasonal rainfall (Fig. 13) suggesting that the [CO2]×drought interaction on wheat yield may depend on other factors such as the timing of drought stress. Investigations in OTC and
Fig. 12. Average simulated [CO2] effects on GY and corresponding coefficient of variation (CV) for spring wheat cultivar Cartaya between 1987 and 1999 at Montefrio, Andalucia, Spain.
controlled environment experiments have shown that canopy photosynthesis of wheat was stimulated by elevated [CO2] more under pre-anthesis drought con-ditions compared to WW controls, but the stimulation
was the same for late-drought conditions and WW controls (Manderscheid et al., 2001; Mitchell et al., 2001b), which was also evident from simulations (not shown).
Importantly, differences in simulated yield in-creases due to doubling [CO2] among models were small in comparison to the differences between simu-lated and between simusimu-lated and observed yields for ambient conditions. In some years, the differences be-tween observed and simulated yields were even larger than simulated yield increase due to doubling [CO2] (Fig. 9).
4. Conclusions
Simulations from different crop models of wheat responses to [CO2] and drought were in good agree-ment with observations from field experiagree-ments. This confirms results from other simulation studies for the same experiments (Kartschall et al., 1995; Grant et al., 1999; Tubiello et al., 1999) and other experi-ments at the same site where N was the limiting factor (Jamieson et al., 2000), demonstrating that crop mod-els can mimic wheat responses to [CO2] in a field environment.
However, models differed about whether or not an effect of [CO2] on water use was assumed. This had consequences on simulated effects of doubling [CO2] on farm yields at a site with low seasonal rainfall. Ef-fects of [CO2] on yield were higher when a [CO2]× drought interaction was assumed (LINTULCC2, AFR-CWHEAT2) than when it was not (Sirius). However, the significance of an interaction between [CO2] and drought including the timing of stress due to drought remains unclear and experimental data are required to test these effects for a field environment.
Model testing against data from OTC experiments performed at two locations in 2 years provided little additional information about the validity of the differ-ent modelling approaches. Although simulations were performed using climate data measured within OTCs to account for the chamber-induced modification of air temperature and radiation (Kimball et al., 1997; van Oijen et al., 1999) a substantial proportion of ob-served variation in wheat growth and yield remained unexplained. Standardisation in soil conditions and controlled water supply did not necessarily improve
simulations of wheat grown in OTCs as suggested by Ewert et al. (1999) and van Oijen and Ewert (1999). Plant growth in OTCs was modified by several other factors related to plot size, the use (or not use) of bor-der plants, airflow pattern, modification of radiation balance and/or restriction of rooting volume, in ways that are not well understood. However, quantitative understanding of such effects is required to conclude from the observations from experiments conducted in OTCs for field conditions.
Mechanistic simulation of observed yield variation at farm and larger scales remains difficult. Relation-ships that determine these variations are not well un-derstood and are often dominated by factors such as pests and diseases that are not included in crop models. Results from the present study suggest that yield re-sponses to [CO2] and drought at higher levels of spatial scale are less understood than physiological relation-ships that determine wheat responses to [CO2] and drought.
Acknowledgements
This work was funded by the European Com-mission under the IMPETUS project (Contract no.: ENV4-CT97-0496). IACR receives grant-aided sup-port from the Biotechnology and Biological Sciences Research Council in the United Kingdom.
References
Bender, J., Hertstein, U., Black, C., 1999. Growth and yield responses of spring wheat to increasing carbon dioxide, ozone and physiological stresses: a statistical analysis of ESPACE-wheat results, ozone and physiological stresses: a statistical analysis of ESPACE-wheat results. Eur. J. Agron. 10, 185–195.
Charles-Edwards, D.A., 1978. An analysis of the photosynthesis and productivity of vegetable crops in the UK. Ann. Bot. 42, 717–731.
Cure, J.D., Acock, B., 1986. Crop responses to carbon dioxide doubling: a literature survey. Agric. For. Meteorol. 38, 127–145. Downing, T.E., Harrison, P.A., Butterfield, R.E., Lonsdale, K.G. (Eds.), 2000. Climate Change, Climatic Variability and Agriculture in Europe: An Integrated Assessment. Research report no. 21, Environmental Change Institute, University of Oxford, UK, p. 445.
F. Ewert et al. / Agriculture, Ecosystems and Environment 93 (2002) 249–266 265
photosynthesis and leaf duration. Global Change Biol. 6, 735– 750.
Ewert, F., van Oijen, M., Porter, J.R., 1999. Simulation of growth and development processes of spring wheat in response to CO2 and ozone for different sites and years in Europe using mechanistic crop simulation models. Eur. J. Agron. 10, 231– 247.
Farquhar, G.D., von Caemmerer, S., Berry, J.A., 1980. A biochemical model of photosynthetic CO2assimilation in leaves of C3 species. Planta 149, 78–90.
Fereres, E., Ruz, C., Gómez H., Testi, L., Villalobos F.J., 2001. Field experiments. In: Mitchell, R.A.C. (Ed.), Improving Wheat Model Accuracy and Suitability for Regional Impact Assessment (IMPETUS). Final research report, CEC project no. ENV4-CT97-0496, Cordoba, Spain, pp. 42–66.
Fischer, R.A., 1985. Number of kernels in wheat crops and the influence of solar radiation and temperature. J. Agric. Sci. Camb. 105, 445–461.
French, B.K., Legg, B.J., 1979. Rothamsted irrigation, 1964/1976. J. Agric. Sci. Camb. 92, 15–37.
Gomez, H., Ruz, C., Luque, L., Testi, F., Villalobos, F., Fereres, E., 1999. Progress report. In: Mitchell, R.A.C. (Ed.), Improving Wheat Model Accuracy and Suitability for Regional Impact Assessment (IMPETUS). CEC project no. ENV4-CT97-0496, Cordoba, Spain, pp. 53–67.
Goudriaan, J., 1990. A simple and fast numerical method for the computation of daily totals of crop photosynthesis. Agric. For. Meteorol. 38, 249–254.
Goudriaan, J., Unsworth, M.H., 1990. Implications of increasing carbon dioxide and climate change for agricultural productivity and water resources. In: Kimball, B.A., Rosenberg, N.J., Allen Jr., L.H. (Eds.), Impact of Carbon Dioxide, Trace Gases, and Climate Change on Global Agriculture. American Society of Agronomy Special Publication 53, Madison, WI, pp. 111–130. Grant, R.F., Wall, G.W., Kimball, B.A., Frumau, K.F.A., Pinter Jr., P.J., Hunsaker, D.J., LaMorte, R.L., 1999. Crop water relations under different CO2 and irrigation: testing of ecosys with the free-air carbon dioxide enrichment (FACE) experiment. Agric. For. Meteorol. 95, 27–51.
Heck, W.W., Taylor, O.C., Tingey, D.T., (Eds.), 1988. Assessment of Crop Loss from Air Pollutants. Elsevier, London. Hunsaker, D.J., Kimball, B.A., Pinter Jr., P.J., LaMorte, R.L.,
Wall, G.W., 1996. Carbon dioxide enrichment and irrigation effects on wheat evapotranspiration and water use efficiency. Trans. ASAE 39, 1345–1355.
Idso, K.E., Idso, S.B., 1994. Plant responses to atmospheric carbon dioxide enrichment in the face of environmental constraints—a review of the past 10 years research. Agric. For. Meteorol. 69, 153–203.
IPCC, 2001. Climate Change 2001. The Scientific Basis-Contribution of Working Group I to the IPCC Third Assessment Report. Cambridge University Press, Cambridge, UK. Jamieson, P.D., Porter, J.R., Goudriaan, J., Ritchie, J.T.,
van Keulen, H., Stol, W., 1998a. A comparison of the models AFRCWHEAT2, CERES-Wheat, Sirius, SUCROS2 and SWHEAT with measurements from wheat grown under drought. Field Crops Res. 55, 23–44.
Jamieson, P.D., Semenov, M.A., Brooking, I.R., Francis, G.S., 1998b. Sirius: a mechanistic model of wheat response to environmental variation. Eur. J. Agron. 8, 161–179.
Jamieson, P.D., Ewert, F., 1999. The role of roots in controlling soil water extraction during drought: an analysis by simulation. Field Crops Res. 60, 267–280.
Jamieson, P.D., Porter, J.R., Semenov, M.A., Brooks, R.J., Ewert, F., Ritchie, J.T., 1999. Comments on Testing UK wheat simulation models predictions against observed UK grain yields by Landau et al. (1998). Agric. For. Meteorol. 96, 157–161. Jamieson, P.D., Bernsten, J., Ewert, F., Kimball, B.A., Olesen, J.E.,
Pinter Jr., P.J., Porter, J.R., Semenov, M.A., 2000. Modelling CO2 effects on wheat with varying nitrogen supplies. Agric. Ecosyst. Environ. 82, 27–37.
Kartschall, T., Grossman, S., Pinter Jr., P.J., Garcia, R.L., Kimball, B.A., Wall, G.W., Hunsaker, D., LaMorte, R.L., 1995. A simulation of phenology, growth, carbon dioxide exchanges and yields under ambient atmosphere and free-air carbon dioxide enrichment (FACE) Maricopa, Arizona, for wheat. J. Biogeogr. 22, 2467–2477.
Kimball, B.A., 1983. Carbon dioxide and agricultural yield: an assemblage and analysis of 430 prior observations. Agron. J. 75, 779–788.
Kimball, B.A., Pinter Jr., P.J., Garcia, R.L., LaMorte, R.L., Wall, G.W., Hunsaker, D.J., Wechsung, G., Wechsung, F., Kartschall, Th., 1995. Productivity and water use of wheat under free-air carbon dioxide enrichment. Global Change Biol. 1, 429–442. Kimball, B.A., Pinter, Jr., P.J., Wall, G.W., Garcia, R.L., LaMorte,
R.L., Jak, P., Fruman, K.F.A., Vugts, H.F., 1997. Comparisons of responses of vegetation to elevated CO2 in free-air and open-top chamber facilities. In: Allen, Jr., L.H., Kirkham, M,B., Olszyk, D.M., Whitman, C.E. (Eds.), Advances in Carbon Dioxide Effects Research. American Society of Agronomy Special Publication 61, ASA, CSSA, SSSA, Madison, WI, pp. 113–130.
Kimball, B.A., LaMorte, R.L., Pinter Jr., P.J., Wall, G.W., Hunsaker, D.J., Adamsen, F.J., Leavitt, S.W., Thompson, T.L., Matthias, A.D., Brooks, T.J., 1999. Free-air carbon dioxide enrichment (FACE) and soil nitrogen effects on energy balance and evapotranspiration of wheat. Water Resources Res. 35, 1179–1190.
Kobayashi, K., Salam, M.U., 2000. Comparing simulated and measured values using mean squared deviation and its components. Agron. J. 92, 345–352.
Landau, S., Mitchell, R.A.C., Barnett, V., Colls, J.J., Craigon, J., Moore, K.L., Payne, R.W., 1998. Testing winter wheat simulation models’ predictions against observed UK grain yields. Agric. For. Meteorol. 89, 85–99.
Landau, S., Mitchell, R.A.C., Barnett, V., Colls, J.J., Craigon, J., Payne, R.W., 2000. A parsimonious, multiple-regression model of wheat yield response to environment. Agric. For. Meteorol. 96, 163–164.
Leuning, R., 1995. A critical appraisal of a combined stomata–photosynthesis model for C3 plants. Plant Cell Environ. 18, 339–355.
available energy. II. Comparison with measurements. Agric. For. Meteorol. 91, 113–125.
Long, S.P., 1991. Modification of the response of photosynthesis productivity to rising temperature by atmospheric CO2 concentration: has its importance been underestimated? Plant Cell Environ. 14, 729–739.
Manderscheid, R., Burkart, S., Mitchell, R.A.C., Schütz, M., 2001. Experiments in controlled environments and in open-top chambers. In: Mitchell, R.A.C. (Ed.), Improving Wheat Model Accuracy and Suitability for Regional Impact Assessment (IMPETUS). Final research report, CEC project no. ENV4-CT97-0496, Braunschweig, Germany, pp. 6–41. Mitchell, R.A.C., Richter, G., Ewert, F., Rodriguez, D., Semenov,
M., 2001a. Performance of models with multiple-site and regional observed wheat yield data. In: Mitchell, R.A.C. (Ed.), Improving Wheat Model Accuracy and Suitability for Regional Impact Assessment (IMPETUS). Final research report, CEC project no. ENV4-CT97-0496, Rothamsted, UK, pp. 137–149.
Mitchell, R.A.C., Mitchell, V.J., Lawlor, D.W., 2001b. Response of wheat canopy CO2 and water gas-exchange to soil water content under ambient and elevated CO2. Global Change Biol. 7, 599–611.
Monteith, J.L., 1965. Evaporation and environment. Symp. Soc. Exp. Bot. 19, 205–234.
Monteith, J.L., 1981. Evaporation and surface temperature. Quart. J. Roy. Meteorol. Soc. 107, 1–27.
Monteith, J.L., Huda, A.K.S., Midya, D., 1989. RESCAP: a resource capture model for sorghum and pearl millet. In: Modelling the Growth and Development of Sorghum and Pearl Millet. Research bulletin no. 12, ICRISAT, Patancheru, Andhra Pradesh, India, 43 p.
Morison, J.I.L., 1985. Sensitivity of stomata and water use efficiency to high CO2. Plant Cell Environ. 8, 467–474. Morison, J.I.L., Lawlor, D.W., 1999. Interactions between
increasing CO2concentration and temperature on plant growth. Plant Cell Environ. 22, 659–682.
Pinter Jr., P.J., Kimball, B.A., Wall, G.W., LaMorte, R.L., Hunsaker, D.J., Adamsen, F.J., Frumau, K.F.A., Vugts, H.F., Hendrey, G.R., Lewin, K.F., Nagy, J., Johnson, H.B., Wechsung, F., Leavitt, S.W., Thompson, T.L., Matthias, A.D., Brooks, T.J., 2000. Free-air carbon dioxide enrichment (FACE): blower effects on wheat canopy microclimate and plant development. Agric. For. Meteorol. 103, 319–333.
Porter, J.R., 1984. A model of canopy development in winter wheat. J. Agric. Sci. Camb. 103, 383–392.
Porter, J.R., 1993. AFRCWHEAT2: a model of the growth and development of wheat incorporating responses to water and nitrogen. Eur. J. Agron. 2, 69–82.
Ritchie, J.T., Otter, S., 1985. Description and Performance of CERES-Wheat: A User Oriented Wheat Yield Model, Vol. 38. United States Department of Agriculture, ARS, pp. 159– 175.
Rodriguez, D., Goudriaan, J., 2000. The effects of CO2 and water availability on water use efficiency, growth and yield of spring wheat. In: Mitchell, R.A.C. (Ed.), Improving Wheat Model Accuracy and Suitability for Regional Impact Assessment (IMPETUS). Final research report, CEC project no. ENV4-CT97-0496, Wageningen, The Netherlands, pp. 41– 71.
Rodriguez, D., Ewert, F., Goudriaan, J., Manderscheid, R., Burkart, S., Mitchell, R.A.C., Weigel, H.J., 2001. Modelling the response of wheat canopy assimilation to CO2using models of different level of empiricism. New Phytol. 150, 337–346.
Rosenzweig, C., Parry, M.L., 1994. Potential impact of climate change on world food supply. Nature 367, 133–138. Skärby, L., Selldén, G., Mortensen, L., Bender, J., Jones, M.,
De Temmerman, L., Wenzel, A., Fuhrer, J., 1993. Responses of cereals exposed to air pollutants in open-top chambers. In: Jäger, H.J., Unsworth, M., De Temmerman, L., Mathy, P. (Eds.), Effects of Air Pollutants on Agricultural Crops in Europe: Results of the European Open-Top Chambers Project. Air pollution research report 46, Commission of the European Communities, Brussels, pp. 241–259.
Tubiello, F.N., Rosenzweig, C., Kimball, B.A., Pinter Jr., P.J., Wall, G.W., Hunsaker, D., LaMorte, R.L., Garcia, R.L., 1999. Testing CERES-wheat with free-air carbon dioxide enrichment (FACE) experiment data: CO2 and water interactions. Agron. J. 91, 247–255.
van Oijen, M., Ewert, F., 1999. The effects of climatic variation in Europe on the yield response of spring wheat cultivar Minaret to elevated CO2 and O3: an analysis of open-top chamber experiments by means of two crop growth simulation models. Eur. J. Agron. 10, 249–264.
van Oijen, M., Schapendonk, A.H.C.M., Jansen, M.J.H., Pot, C.S., Maciorowski, R., 1999. Do open-top chambers overestimate the effects of rising CO2 on plants? An analysis using spring wheat. Global Change Biol. 5, 411–422.
Weir, A.H., Bragg, P.L., Porter, J.R., Raynor, J.H., 1984. A winter wheat crop simulation model without water or nutrient limitations. J. Agric. Sci. Camb. 102, 371–382.

![Fig. 3). Also, there was a substantial scatter in theresponses of wheat to [CO2] and drought in OTCexperiments (Fig](https://thumb-us.123doks.com/thumbv2/123dok_us/8929134.1846154/10.842.60.239.89.231/fig-substantial-scatter-theresponses-wheat-drought-otcexperiments-fig.webp)
![Fig. 4. Comparison of simulated (LINTULCC2, AFRCWHEAT2 and Sirius) with measured (a) final above ground BM, (b) GY, (c)cumulative ET and (d) WUE for BM of spring wheat cultivar Yecora Rojo subjected to four treatments (ambient and elevated [CO2], WWand WS)](https://thumb-us.123doks.com/thumbv2/123dok_us/8929134.1846154/11.842.98.445.92.324/comparison-simulated-lintulcc-afrcwheat-cumulative-cultivar-subjected-treatments.webp)
![Fig. 6. Comparison of simulated (AFRCWHEAT2) and measured (a) final above ground BM, (b) GY, (c) cumulative ET and (d) WUE ofspring wheat cultivar Minaret subjected to four treatments (ambient and elevated [CO2], WW and WS) in OTC experiments at Braunschwei](https://thumb-us.123doks.com/thumbv2/123dok_us/8929134.1846154/13.842.129.416.380.606/comparison-simulated-afrcwheat-cumulative-subjected-treatments-experiments-braunschwei.webp)
![Fig. 7. Relationships between (a) observed RUE and plot area and (b) differences between simulated and observed final BM and plot areafor WW, low [CO2] treatments of OTC experiments in Braunschweig and Giessen in 1998 and 1999.](https://thumb-us.123doks.com/thumbv2/123dok_us/8929134.1846154/14.842.68.474.506.626/relationships-observed-differences-simulated-treatments-experiments-braunschweig-giessen.webp)
![Fig. 9. Observed farm yields of spring wheat cultivar Cartaya at Montefrio, Andalucia, Spain, between 1987 and 1999 and simulated(LINTULCC2, AFRCWHEAT2, Sirius) GYs for (a) ambient [CO2] and (b) 2 × ambient [CO2]](https://thumb-us.123doks.com/thumbv2/123dok_us/8929134.1846154/15.842.44.498.83.231/observed-cultivar-cartaya-montefrio-andalucia-simulated-lintulcc-afrcwheat.webp)
![Fig. 13. Simulated [CO2spring wheat cultivar Cartaya between 1987 and 1999 at Montefrio,] effects on GY vs](https://thumb-us.123doks.com/thumbv2/123dok_us/8929134.1846154/16.842.77.463.91.198/fig-simulated-spring-wheat-cultivar-cartaya-montefrio-effects.webp)
