DEMOGRAPHIC RESEARCH
VOLUME 34, ARTICLE 35, PAGES 995
−
1036
PUBLISHED 7 JUNE 2016
http://www.demographic-research.org/Volumes/Vol34/35/ DOI: 10.4054/DemRes.2016.34.35
Research Article
Social network indices in the
Generations and Gender Survey: An appraisal
Pearl A. Dykstra
Christoph Bühler
Tineke Fokkema
Gregor Petrič
Rok Platinovšek
Tina Kogovšek
Valentina Hlebec
This publication is part of the Special Collection on “Data Quality Issues in the First Wave of the Generations and Gender Survey,” organized by Guest Editors Aart C. Liefbroer and Joop Hox.
© 2016 Pearl A. Dykstra et al.
This open-access work is published under the terms of the Creative Commons Attribution NonCommercial License 2.0 Germany, which permits use, reproduction & distribution in any medium for non-commercial purposes, provided the original author(s) and source are given credit.
1 Relevance of social networks to the substantive focus of the GGP 996 1.1 Antecedents of demographic behaviour 997 1.2 Consequences of demographic behaviour 998 1.3 Reliance on public care services 998
1.4 Well-being 999
2 Delineation of social networks 1000 2.1 Five methods of network delineation 1000 2.2 Network delineation in existing surveys 1002
3 Social network indices in the GGS 1003
3.1 Role-relation network 1005
3.2 Exchange network 1007
3.3 Normative expectations 1009
3.4 Size and composition 1010
3.5 Effects of imposed restrictions on network size 1014
4 Overview of research using social network indices from the GGS 1017 4.1 Network influences on demographic behavior 1018
4.2 Care 1019
4.3 Network influences on well-being 1020 4.4 Implications of demographic changes for social networks 1021
5 Evaluation of social network indices in the GGS 1023 5.1 Uniqueness of the GGS social network indices 1023 5.2 Limitations of the GGS social network indices 1025 5.3 Blank spots in the usage of social network indices 1026
6 Acknowledgments 1027
Social network indices in the
Generations and Gender Survey: An appraisal
Pearl A. Dykstra1Christoph Bühler2 Tineke Fokkema134
Gregor Petrič5 Rok Platinovšek6
Tina Kogovšek5 Valentina Hlebec5
Abstract
BACKGROUND
In this contribution we critically appraise the social network indices in the Generations and Gender Survey (GGS).
OBJECTIVE
After discussing the rationale for including social network indices in the GGS, we provide descriptive information on social network characteristics and an overview of substantive questions that have been addressed using GGS social network data: antecedents and consequences of demographic behaviour, care, and differences in well-being. We identify topics that have received relatively little attention in GGS research so far, despite the availability of novel and appropriate social network data. We end with a discussion of what is unique about the social network indices in the GGS. METHODS
The descriptive information on social network characteristics is based on empirical analyses of GGS data, and an experimental pilot study. The overview of GGS research using social network indices is based on a library search. The identification of what is
1 Erasmus University Rotterdam, the Netherlands. E-Mail: [email protected]. 2 Leibniz University Hanover, Germany.
3 Netherlands Interdisciplinary Demographic Institute, The Hague, the Netherlands. 4 University of Groningen, the Netherlands.
unique about the social network indices in the GGS is based on a comparison with the European Quality of Life Survey (EQLS), the Survey of Health, Ageing and Retirement (SHARE), and the International Social Survey Program (ISSP).
RESULTS
Results show a high representation of family members in the social networks, and confirm the adequacy of using a cap of five names for network-generating questions. GGS research using the social network indices has largely focused on determinants of fertility behaviour, intergenerational linkages in families, and downward care transfers. CONCLUSIONS
Topics that have received relatively little attention are demographic behaviours other than those related to parenthood, upward transfers of practical support, ties with siblings, and stepfamily ties. Social network indices in the GGS show a high degree of overlap with those in other international surveys. The unique features are the inventory of family ties ever born and still living, and the assessment of network members’ normative expectations. The GGS holds a wealth of social network data that warrants a myriad of future investigations.
1. Relevance of social networks to the substantive focus of the GGP
A person’s social network is the group of individuals with whom that person has a direct relationship (Broese van Groenou and Van Tilburg 1996). Over the past decades, demographers have become more interested in investigating the role of social networks for a variety of topics, including reproductive behaviour (e.g., Watkins 1987), health and longevity (e.g., Seeman and Crimmins 2001), and migration (e.g., Massey 1990). Not surprisingly, social networks figure prominently in a number of substantive issues in the Generations and Gender Programme (GGP): the antecedents and consequences of demographic behaviour, reliance on public care services, and well-being. Depending on the research question, social networks serve as the independent variable (social networks predict or explain the outcome), or as the dependent variable (explaining differences in characteristics of social networks). An example of the latter is when demographic trends serve to explain differences in network size and composition.
that have been addressed using GGS social network data. We also identify topics that have received relatively little attention in GGS research so far, despite the availability of novel and appropriate social network data. We start with a consideration of why social network indices are relevant to substantive issues of the GGP.
1.1 Antecedents of demographic behaviour
Predicting and explaining demographic behaviour is a key issue in the GGP. From this perspective, social networks matter firstly because they help to define demographic goals or alternative aims in other spheres of living (Bongaarts and Watkins 1996; Bühler and Fratczak 2007). They influence the value and therefore the degree of desirability or non-desirability of particular goals and activities. This influence may depend on very different aspects, such as interpersonal communication, provision of information, socialisation, internalisation of values, role models, or normative sanctions, which can be summarised under two general mechanisms: social learning and social influence (Kohler, Behrman, and Watkins 2001; Montgomery and Casterline 1996). Social learning rests on information, evaluations, and experiences provided by interpersonal communication and role models observed in the social environment. Social influence is based on the formulation and maintenance of normative expectations by the social environment, implying that individuals feel the need to follow distinct goals by particular means.
demographic behaviour. They may also favour goals in other life domains (e.g., giving high priority to an occupational career), define particular demographic events as socially unacceptable (e.g., having a very large family), or may not be able to provide the support needed to reach a desired demographic goal (e.g., having a second child or living alone after a divorce).
1.2 Consequences of demographic behaviour
Changes in mortality, nuptiality, and fertility patterns are reflected in living arrangements (households) and family structures (generational constellations). Several questions have yet to be answered. How many generations surround individuals in different phases of life? How complex are today’s families? How many have two generations with women only? Who is family-deprived, lacking intra- and intergenerational family ties, living alone? How common are only children? How do patterns differ across contexts? Knowledge about family constellations is important for forecasting and the creation of social policies and programmes (Dykstra 2010).
When the implications of demographic developments for family change are considered, negative messages prevail. The following arguments tend to be put forward. Persistent low fertility means fewer children and siblings to call on for help. The concentration of demands for help in the oldest-old category means that children and siblings are too old to provide help by the time it is needed. The extension of life expectancy means that for several decades of adulthood, individuals have family generations above and below them with competing needs. The rise in divorce means that fewer adults have partners to provide assistance, whereas more adults have histories of disruption. Though these arguments are intuitively appealing they are misleading and inaccurate, and lack a sound empirical basis (Dykstra and Komter 2006; Harper 2005; Rosenthal 2000; Soldo 1996; Uhlenberg 1993). The GGS aims to improve the empirical evidence regarding the consequences of demographic change for social networks.
1.3 Reliance on public care services
differential opportunities and constraints for men and women and across generations in families.
Family members provide the majority of the care that children (Gauthier, Smeeding, and Furstenberg 2004) and frail older adults (Lyon and Glucksmann 2008) receive. Nevertheless, a long-standing debate is whether public services erode the provision of informal support (Attias-Donfut and Wolff 2000). To understand to what degree country-specific institutional frameworks support the desire to be responsible towards one’s children and frail old parents and/or support individual autonomy, thereby partially lightening intergenerational dependencies and the gender division of labour, three patterns in legal and policy frameworks have recently been distinguished (Saraceno 2010): familialism by default (there are no publicly provided alternatives to family care and financial support), supported familialism (policies, usually through financial transfers, support families in keeping up their financial and caring responsibilities), and defamilialisation (primary needs are partly answered through public provisions such as services or a basic income). This categorisation goes beyond the public/private responsibilities dichotomy, showing that public support may both be an incentive for and lighten private, family responsibilities.
1.4 Well-being
A third key issue in the GGP concerns differences in well-being. People who are embedded in social networks generally enjoy better mental and physical health. Large, well-controlled prospective studies show that personal relationships have an impact on physical and mental health independently of potentially confounded factors such as socioeconomic status, health-risk behaviours, use of health services, and personality (Berkman et al. 2000; Uchino 2004).
provide access to resources that transcend an individual’s means. To have relationships is to have access to other people’s connections, information, money, and time. The different functions of relationships (companionship, social support, social control, and access to resources) are related to each other, and are not easily separated in everyday life.
It is important to note that not all interactions with others are pleasant and enjoyable, or, as Portes (1998: 18) states, “Sociability cuts both ways”. He provides examples of negative consequences of social networks: exclusion of outsiders, excess claims on group members, restrictions on individual freedoms, and downward levelling norms that operate to keep members of a downtrodden group in place.
2. Delineation of social networks
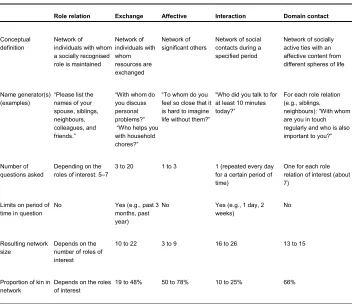
2.1 Five methods of network delineationSeveral methods have been developed to delineate social networks (Marsden 1990; Van der Poel 1993a). Some focus on the content of relationships, others on their affective nature, and yet others start from roles. All these methods rest on the principle of “name generators” (Marsden 2005). Individuals are asked to name all or some of their network partners who are important to them for a particular reason addressed in the name-generating question. Table 1 (adapted from Broese van Groenou and Van Tilburg 1996) provides an overview.
The role-relation method (e.g., Laumann 1973) delineates individuals who belong to specific relationship categories, such as spouse, child, parent, neighbour, colleague, and so forth. The social network, accordingly, is composed of individuals with whom the focal person maintains a socially recognised role (Litwak and Szelenyi 1969; Wellman and Wortley 1990).
The exchange method (e.g., McCallister and Fischer 1978) delineates individuals involved in the provision and receipt of goods, services, and time. Accordingly, the social network consists of people with whom resources are exchanged.
Table 1: Overview of network delineation methods
Role relation Exchange Affective Interaction Domain contact
Conceptual
definition Network of individuals with whom
a socially recognised role is maintained
Network of individuals with whom resources are exchanged Network of
significant others Network of social contacts during a specified period
Network of socially active ties with an affective content from different spheres of life
Name generator(s)
(examples) “Please list the names of your spouse, siblings, neighbours, colleagues, and friends.”
“With whom do you discuss personal problems?” “Who helps you with household chores?”
“To whom do you feel so close that it is hard to imagine life without them?”
“Who did you talk to for at least 10 minutes today?”
For each role relation (e.g., siblings, neighbours): “With whom are you in touch regularly and who is also important to you?”
Number of questions asked
Depending on the roles of interest: 5–7
3 to 20 1 to 3 1 (repeated every day
for a certain period of time)
One for each role relation of interest (about 7)
Limits on period of time in question
No Yes (e.g., past 3
months, past year)
No Yes (e.g., 1 day, 2
weeks)
No
Resulting network
size Depends on the number of roles of
interest
10 to 22 3 to 9 16 to 26 13 to 15
Proportion of kin in
network Depends on the roles of interest 19 to 48% 50 to 78% 10 to 25% 66%
Note: Table adapted from Broese van Groenou and Van Tilburg (1996).
The interaction method (e.g., Bernard, Killworth, and Sailer 1982) delineates individuals with whom the focal person interacts face-to-face, on the telephone, and so forth during a given length of time (e.g., day, week, fortnight). The social network, accordingly, consists of a person’s social contacts in varying contexts (home, work, church, neighbourhood, transportation, public services, and so forth) during a specified period.
network accordingly consists of active ties from different spheres of life with an affective content.
Each of these methods has its merits. Substantive questions of interest need to guide the decision as to which method to use (Marsden 1990; Van der Poel 1993b). For example, for a researcher interested in access to resources, the role-relation approach is probably the most appropriate, whereas for a researcher interested in psychological well-being, the affective approach is probably the best choice. Another important consideration is the time and money available for network delineation in the proposed survey (Kogovšek and Hlebec 2008). Collecting time-consuming social network data is especially undesirable in general purpose surveys, where social networks are only part of a larger data collection effort.
2.2 Network delineation in existing surveys
Comparability with existing surveys is yet another consideration in deciding upon the network delineation method. An overview of network measures in a number of often-used general purpose surveys is given first, followed by an overview of network measures in surveys focusing more strongly on families and households. Note that the measures pertain to networks where the focal person has a direct relationship with the network members but no information is available on relationships between network members, thus precluding analyses of network structure (see e.g., Snijders 2001 for analyses of structural network effects).
The International Social Survey Program(ISSP), which is the largest programme of cross-national research in the social sciences, collected network data in 1986 and in 2001. The ISSP has opted for a role-relation approach. Respondents are asked to provide the number of brothers and sisters, adult sons and daughters, children aged 18 or younger, father, mother, close friends at work, in the neighbourhood and elsewhere. Additionally, respondents are asked about the frequency of contact, e.g., “How often do you visit or see your closest friends?” using the following answer categories: “S/he lives in the same household” (1), “Daily” (2), to “Never” (8). Respondents are also asked to identify the role relation regarding several support types (help in household, in the case of flu, borrowing a small sum of money, help in the case of problems with spouse/partner, help in the case of being depressed, advice regarding a big life change). The first two providers may be chosen from an extensive list of largely informal but also formal sources, such as kin, friends, medical doctors, priests, banks, etc.
the house when ill, advice about a serious personal or family matter, talk when feeling a little depressed, and help when needing a large sum of money in an emergency.
The United States General Social Survey (GSS) introduced a single exchange network item in 1985: “With whom do you talk about personal matters?” The resulting network is generally described as the “core discussion network” (Burt 1984; Marsden 1987; McPherson, Smith-Lovin, and Brashears 2006), indicating the key actors in a personal social network.
The Survey of Health and Retirement in Europe (SHARE), which is harmonised with the United States Health and Retirement Survey (HRS) and the English Longitudinal Study of Ageing (ELSA), included network measures in several waves, opting for a set of exchange network items. Respondents are asked to list those who in the last twelve months (or since the last interview) have provided “personal care, e.g. dressing, bathing or showering, eating, getting in or out of bed, using the toilet”, “practical household help, e.g. with home repairs, gardening, transportation, shopping, household chores”, and “help with paperwork, such as filling out forms, settling financial or legal matters”. Respondents are also asked to list the individuals to whom they have given such help. In addition, questions are asked on the exchange of financial support: “In the last twelve months [the time since the last interview], not counting any shared housing or shared food, have you received any financial or material gift or support from any person inside or outside this household amounting to 250 euros or more?” Again, respondents are also asked to list the individuals whom they have financially supported.
Surveys on family and household support conducted since the 1990s in Europe have invariably used the exchange method. Bonvalet and Ogg (2007) provide an overview of measures in nine surveys: Close friends and relatives (France, 1990), The three-generations study (France, 1992), The family and community life of older people (England, 1995), The panel study on Belgian households (1992−2004), Intergenerational relations: Socio-economic panel (Luxembourg, 2000−2002), Social stratification, cohesion and conflict in contemporary families (Switzerland, 1998), Families in contemporary Portugal (1999), The Norwegian life course, ageing and generation study (2002−2007), and Analysis of family networks in Andalusia (Spain, 2005). Though differing in details, the surveys all enquire into the exchange of childcare, practical help, financial help, emotional support, and personal care.
3. Social network indices in the GGS
the survey collects a broad variety of information on individual behaviours, personal and environmental characteristics, socioeconomic structures, and interpersonal relationships in order to describe and to explain these developments. According to the delineation of social networks, the general character of the GGS implies that the survey does not follow an approach of covering respondents’ overall social networks, but of addressing particular aspects of personal relationships whenever they are relevant for one or more specific demographic topics. As already argued in the introduction, the core themes of the GGS are demographic behaviours, solidarity between family generations, and personal well-being. Hence, questions on social networks concentrate on the following aspects: core family and partnership, presence and quality of intergenerational relations, emotional support, financial transfers and care, and normative expectations.
Knowledge on the character and structure of the core family is central to the understanding of the key issues of the GGS. Presence and number of biological, adopted, or foster children have a significant impact on demographic events such as marriage, divorce, or childbirth, on exchange of care and support, and on personal well-being. The same arguments hold for the presence and quality of a partnership. Within these contexts, information is needed on partners’ living arrangements (for example, common household or living apart together) and the presence of partners’ children.
In order to adequately cover the presence and character of intergenerational relations, detailed information on respondents’ embeddedness in multigenerational family relationships is collected. Children as well as parents are important sources of care and support, but they may also need substantial assistance from the respondent. As a consequence the presence of older or younger generations may enable, support, hinder, or block an individual’s particular demographic behaviours. General characteristics of multigenerational family relationships, like spatial distance or meeting frequency, provide insight into relationship qualities and the potential availability of particular kinds of care and support. Assistance by family members is, moreover, a central determinant of personal well-being, but intergenerational relationships are also important sources of pleasure, companionship, social engagement, health, and longevity.
Finally, demographic behaviours are not exclusively influenced by personal relationships via the transfer of resources. Normative expectations, implicitly or explicitly addressed by the social environment, are significant as well. Moreover, compliance or defiance of normative expectations may improve or deteriorate personal well-being due to conflicts or agreements with family members and peers and positive or negative sanctions by the social environment.
As the GGS addresses all these different aspects of personal networks within the context of particular demographic issues, questions on personal relationships are spread throughout the questionnaire and network-related information is collected by different methods. Most questions, however, are based on the perspectives of role relationships or exchange relationships. This mixture ensures a theoretically and methodologically adequate collection of network information. It provides synergies with other topics addressed by the survey. For example, the collection of detailed information on household composition is a standard method in demographic research to gain insight into living arrangements between partners, the economic situation of a household, or the presence of children and parents living in the household. At the same time, however, it provides detailed information on respondents’ close kin and the composition of the core family.
3.1 Role-relation network
Questions on role relations are spread throughout the questionnaire and concentrate both on household and family members as well as on close kin. Role relations to household members are addressed both by a name-generating question about the individuals living in a respondent’s household and by a subsequent question on the kind of relationship between the respondent and each household member (question 101). The questions also consider household members who belong to the household but who are temporarily absent.7
Data on household composition are used as a starting point to complete information on respondents’ core family. If an interviewee has not named a partner living in the household, a question is asked about whether he or she has anycouple or intimaterelationship. The question explicitly considers same-sex-partnerships as well as arrangements of living apart together (LAT) (question 306). Information on the
7 In order to identify all household members, interviewers pursue the following definition: “A household
presence of parents is collected in a similar way. If a mother and/or father are not named as a household member, the question is asked whether one’s mother and father are still alive (questions 505 and 519). Additional questions about travelling distance and meeting frequency address basic characteristics of the relationships. As a standard in demographic surveys, the GGS also covers respondents’ reproductive histories as well as information on all adopted, foster, and stepchildren living inside and outside the household (section 2). This set of questions provides a complete overview of a respondent’s and his or her partner’s children. In the case of children not living in the household, travelling distance and meeting frequency are asked.
Less detailed information is collected on respondents’ siblings. These are addressed as a group. The respondent is requested to name the number of brothers and the number of sisters he or she has ever had and the number of brothers and sisters who are alive (question 566). The same holds for grandparents, grandchildren, and great-grandchildren. The respondents are asked how many of their grandparents are alive (question 567), and how many grandchildren (question 238) and great-grandchildren (question 242) they have.
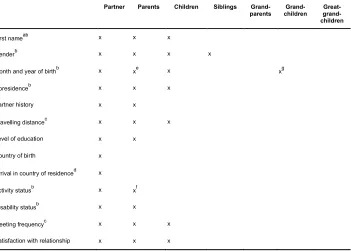
In general, the questions on role relationships address all members of a respondent’s household as well as all members of the core family. Thus, they cover up to three generations (if great-grandchildren are present, up to four generations). Given the broad age range of respondents in the GGS, these role relationships can be analysed from different generation-specific perspectives: those of children, parents, or grandparents.
Table 2: Information available in the GGS on members of the role-relation network
Partner Parents Children Siblings
Grand-parents children Grand- grand- Great-children
First nameab x x x
Genderb x x x x
Month and year of birthb x xe x xg
Coresidenceb x x x
Partner history x x
Travelling distancec x x x
Level of education x x
Country of birth x
Arrival in country of residenced x
Activity statusb x xf
Disability statusb x x
Meeting frequencyc x x x
Satisfaction with relationship x x x
Note: Information is available on the number of living brothers, sisters, grandparents, grandchildren, and great-grandchildren.
aOr other unique identifier (such as “mother”).
b
Also known for all other role relations insofar as they are household members.
c
If not coresident.
dIf not born in the country of residence.
eYear of birth only.
fOccupation at age 15.
g
For oldest and youngest or for only grandchild.
3.2 Exchange network
The GGS considers this aspect by addressing respondents’ relationships in terms of the exchange of support.
The majority of the questions on network-based care and support are from an exchange perspective. Respondents are not only asked to list network members from whom they have received help, but also those whom they have helped. The rationale underlying these questions is that the provision and receipt of help is not necessarily characterised by balanced short-term reciprocity. The closer a relationship, the more likely it is characterised by unbalanced long-term reciprocity. This holds especially for intergenerational relationships between parents and children.
Exchanges of support only improve well-being or enable the achievement of desired goals if the provided resources fit the individuals’ needs. By implication, surveys ideally need to include a large variety of potentially supportive resources to obtain a reliable depiction. Such an elaborate delineation of support networks goes beyond the scope of the GGS. The survey, therefore, addresses resources that are assumed to be essential for demographic behaviours, intergenerational relations, and well-being: the general resources of emotional and monetary support, and the more specific resources of childcare, personal care, and household assistance.
Emotional support is measured by two questions asking respondents to name all network members with whom they have talked about personal experiences and feelings (question 713) and who have talked with them about their personal experiences and feelings (question 716).8 Questions on monetary support deal both with the respondent
and his/her partner, as the household is perceived by the GGS as the basic economic unit. Therefore, two questions ask for the network members outside the household from whom the respondent and/or his/her partner has/have received “money, assets, or goods of substantive value” (question 1010), and all those outside the household to whom the respondent and/or his/her partner has provided “money, assets, or goods of substantive value” (question 1015). The term “substantive value” is not defined by a particular amount of money but is subjectively interpreted by the respondent. Given the large heterogeneity of wealth and spending capacity among European societies and between social strata, goods and assets of very different value can be experienced and evaluated as helpful and supportive.
Questions on the exchange of childcare address, on the one hand, all network members who provided “regular help” with childcare to the respondent (question 204) and, on the other hand, all network members who received “regular help” with childcare by the respondent over the last 12 months (question 208). Although occasional childcare is of importance for many parents, the term “regular help” is used in order to identify steady structures of support in a respondent’s personal network.
8 All name-generating questions on emotional and monetary support address the period of the last 12 months
Moreover, in order to avoid a mixture of professional and private childcare in the answers on received childcare, respondents are asked only to consider people “for whom caring for children is not a job”. The question about received personal care is formulated in a similar way. Here, the respondent is requested to list all network members who provided personal care to the respondent during the last 12 months and “for whom providing such care is not a job” (question 706). Of course, this question is only put to respondents who need regular help with personal care.
Within its section on household organisation, the GGS questionnaire also addresses network members from whom a respondent receives regular help with household tasks. This question is asked within the context of a respondent’s workload at home and the division of labour among the household members. The name-generating question, therefore, does not address an explicit time frame of 12 months, but asks for “regular help” in general. Moreover, an exchange perspective is not adopted; i.e., no information is collected on the provision of help with household tasks by the respondent to network members.
Limited information is available on the characteristics of the various members of the exchange network. For each network member the role relation to the respondent and whether he or she lives in the respondent’s household is known. However, as unique identifying information (i.e., a name) is not collected, the exchange network and the role-relation network can only partly be matched. This is possible if a network member is a partner, an only daughter or son, an only grandchild, mother or father, grandmother or grandfather, mother-in-law or father-in-law, or an only brother or sister. Matching is also possible if a respondent has one daughter and one son.
3.3 Normative expectations
member can be identified. In the case of parents and children, however, these groups can to some extent be characterised by the information provided by the questions on role relationships.
3.4 Size and composition
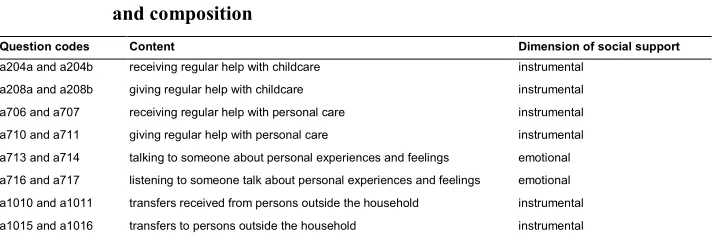
In this section we present results on the size and composition of social networks in 14 GGS countries. The data are from Wave 1 and pertain to the questionnaire items on exchanges of support (see Table 3 for an overview of these items).9
Table 3: GGS questionnaire items used in the construction of network size and composition
Question codes Content Dimension of social support
a204a and a204b receiving regular help with childcare instrumental
a208a and a208b giving regular help with childcare instrumental
a706 and a707 receiving regular help with personal care instrumental
a710 and a711 giving regular help with personal care instrumental
a713 and a714 talking to someone about personal experiences and feelings emotional
a716 and a717 listening to someone talk about personal experiences and feelings emotional
a1010 and a1011 transfers received from persons outside the household instrumental
a1015 and a1016 transfers to persons outside the household instrumental
The size of the social network is the number of persons named by the respondents in response to the questions on supportive exchanges. If the respondent answered “no” to the filter question (e.g., the respondent does not receive regular help with childcare), the number of network members was set to zero. If the filter question had a missing value, the respondent was excluded from the analysis. The composition of the network is measured as the proportion of family members in the network. Family members are defined as persons who belong to the kinship group − defined as ties based on blood
9 The questionnaire always proceeds in the same manner: first a filter question is posed, e.g., “Do you (also)
and marriage and also on ‘new’ family forms, such as consensual unions and registered partnerships (both opposite-sex and same-sex) (Dykstra 2009; Zaviršek 2009)).
It is important to note that the implementation of the network modules varied somewhat across countries. First, a number of countries adapted the original list of 19 relationship types.10 These changes probably have few implications for the findings,
given that they pertain to types that are not nominated frequently, such as ex-partners. Second, the data for Italy are not fully comparable. In this country, exchanges with network members pertained to the last four weeks, whereas this timespan was 12 months for all other countries. Third, a number of countries did not implement all exchange items. Fourth, the wording of the exchange items was not identical across countries.
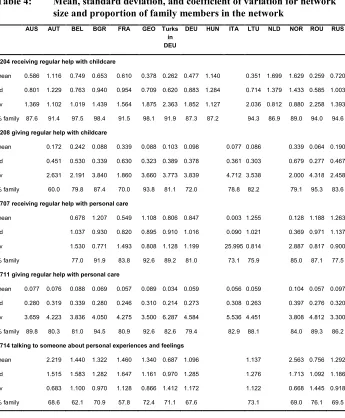
Table 4 shows, for each country, the mean size of a particular network, the standard deviation, and the coefficient of variation (computed as a ratio of the standard deviation and the mean). The table also shows the proportion of family members in the network. In Austria, for example, the average size of the receiving-regular-help-with-childcare network is 1.116. The variability of the size of this Austrian network is relatively small; the coefficient of variation is lower than for most other countries. On average, 91.4% of the receiving-regular-help-with-childcare networks in Austria consist of family members.
Across GGS countries the networks of childcare receipt and provision are similar in size. Romania and the Turkish sample in Germany are exceptions, with relatively small-size childcare networks. Norway and the Netherlands, on the other hand, stand out as having relatively large childcare networks. The relatively large childcare networks in the Netherlands might be a methodological artefact, given the way in which the items were phrased. Contrary to the GGS standard questionnaire which enquires into “help with childcare”, the Dutch questionnaire specifies “help with babysitting, care, bringing and fetching”. Moreover, the GGS standard questionnaire excludes the option of nominating persons “for whom caring for children is not a job”, whereas the Dutch version does not have this specification. The proportion of family members in the childcare networks shows little variation across countries. Austria, with its relatively low proportion of family members giving regular help in childcare networks, forms an exception.
10 Russia for example introduced the category “ex-partner” while Georgia added “confessor” and “partner or
Table 4: Mean, standard deviation, and coefficient of variation for network size and proportion of family members in the network
AUS AUT BEL BGR FRA GEO Turks
in DEU
DEU HUN ITA LTU NLD NOR ROU RUS
a204 receiving regular help with childcare
mean 0.586 1.116 0.749 0.653 0.610 0.378 0.262 0.477 1.140 0.351 1.699 1.629 0.259 0.720
sd 0.801 1.229 0.763 0.940 0.954 0.709 0.620 0.883 1.284 0.714 1.379 1.433 0.585 1.003
cv 1.369 1.102 1.019 1.439 1.564 1.875 2.363 1.852 1.127 2.036 0.812 0.880 2.258 1.393
% family 87.6 91.4 97.5 98.4 91.5 98.1 91.9 87.3 87.2 94.3 86.9 89.0 94.0 94.6
a208 giving regular help with childcare
mean 0.172 0.242 0.088 0.339 0.088 0.103 0.098 0.077 0.086 0.339 0.064 0.190
sd 0.451 0.530 0.339 0.630 0.323 0.389 0.378 0.361 0.303 0.679 0.277 0.467
cv 2.631 2.191 3.840 1.860 3.660 3.773 3.839 4.712 3.538 2.000 4.318 2.458
% family 60.0 79.8 87.4 70.0 93.8 81.1 72.0 78.8 82.2 79.1 95.3 83.6
a707 receiving regular help with personal care
mean 0.678 1.207 0.549 1.108 0.806 0.847 0.003 1.255 0.128 1.188 1.263
sd 1.037 0.930 0.820 0.895 0.910 1.016 0.090 1.021 0.369 0.971 1.137
cv 1.530 0.771 1.493 0.808 1.128 1.199 25.995 0.814 2.887 0.817 0.900
% family 77.0 91.9 83.8 92.6 89.2 81.0 73.1 75.9 85.0 87.1 77.5
a711 giving regular help with personal care
mean 0.077 0.076 0.088 0.069 0.057 0.089 0.034 0.059 0.056 0.059 0.104 0.057 0.097
sd 0.280 0.319 0.339 0.280 0.246 0.310 0.214 0.273 0.308 0.263 0.397 0.276 0.320
cv 3.659 4.223 3.836 4.050 4.275 3.500 6.287 4.584 5.536 4.451 3.808 4.812 3.300
% family 89.8 80.3 81.0 94.5 80.9 92.6 82.6 79.4 82.9 88.1 84.0 89.3 86.2
a714 talking to someone about personal experiences and feelings
mean 2.219 1.440 1.322 1.460 1.340 0.687 1.096 1.137 2.563 0.756 1.292
sd 1.515 1.583 1.282 1.647 1.161 0.970 1.285 1.276 1.713 1.092 1.186
cv 0.683 1.100 0.970 1.128 0.866 1.412 1.172 1.122 0.668 1.445 0.918
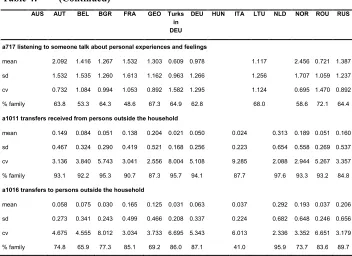
Table 4: (Continued)
AUS AUT BEL BGR FRA GEO Turks
in DEU
DEU HUN ITA LTU NLD NOR ROU RUS
a717 listening to someone talk about personal experiences and feelings
mean 2.092 1.416 1.267 1.532 1.303 0.609 0.978 1.117 2.456 0.721 1.387
sd 1.532 1.535 1.260 1.613 1.162 0.963 1.266 1.256 1.707 1.059 1.237
cv 0.732 1.084 0.994 1.053 0.892 1.582 1.295 1.124 0.695 1.470 0.892
% family 63.8 53.3 64.3 48.6 67.3 64.9 62.8 68.0 58.6 72.1 64.4
a1011 transfers received from persons outside the household
mean 0.149 0.084 0.051 0.138 0.204 0.021 0.050 0.024 0.313 0.189 0.051 0.160
sd 0.467 0.324 0.290 0.419 0.521 0.168 0.256 0.223 0.654 0.558 0.269 0.537
cv 3.136 3.840 5.743 3.041 2.556 8.004 5.108 9.285 2.088 2.944 5.267 3.357
% family 93.1 92.2 95.3 90.7 87.3 95.7 94.1 87.7 97.6 93.3 93.2 84.8
a1016 transfers to persons outside the household
mean 0.058 0.075 0.030 0.165 0.125 0.031 0.063 0.037 0.292 0.193 0.037 0.206
sd 0.273 0.341 0.243 0.499 0.466 0.208 0.337 0.224 0.682 0.648 0.246 0.656
cv 4.675 4.555 8.012 3.034 3.733 6.695 5.343 6.013 2.336 3.352 6.651 3.179
% family 74.8 65.9 77.3 85.1 69.2 86.0 87.1 41.0 95.9 73.7 83.6 89.7
The size of networks giving and receiving personal care is also similar across countries. While the average size of networks for receiving help with personal care is around 1, the average size of giving help in personal care networks is close to 0. Note that a different group of respondents reported on personal care networks: the question on receiving personal care is only put to respondents in need of such care. The percentage of family members in the personal care networks ranges between 73.1% and 94.5% across countries.
Emotional support networks (talking about personal experiences and feelings) range between 0.721 and 2.563 members, on average. Family members represent the majority in these networks. Yet their proportion is lower than in other networks, ranging from 48.6% for France to 76.1% for Romania.
countries, except for Italy, where the percentage of family members outside the household to whom financial support is provided is considerably lower (41.0%).
The previously described results, which demonstrate a high representation of family members in the various networks, justify the relationship categories that are used in Wave 1 of the GGS. Rather than employing detailed categories, rather broad groupings are used. For example, relationships with “friends, neighbours, coworkers” are a single category instead of being partitioned into three separate types. The results suggest that detailed categories would not enhance the quality of data but would heighten respondent burden.
3.5 Effects of imposed restrictions on network size
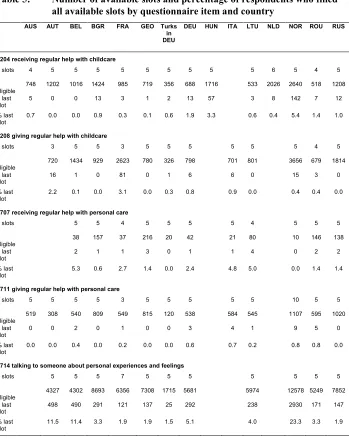
In this section we focus on a particular aspect of the quality of network items by investigating whether the number of ‘slots’ was sufficient to accommodate all the respondents’ network members. The GGS guidelines imposed a maximum limit of five names for individual exchange items (but a higher limit was used in some countries). The rationale for estimating the quality of the social network items is the following: if the number of available slots is sufficiently high, then a very low fraction of respondents will fill all the slots. If the number of slots is too restrictive, a higher fraction of respondents will name enough network members to fill all available slots. The number of responses in the last slot was thus divided by the number of eligible respondents (those who answered “yes” to the filter question) to obtain the fraction of respondents who used up all available slots. Table 5 shows the results.
The table should be read as in the following case of Germany. Five slots were available for each exchange item. On item a204 (receiving regular help with childcare), 688 respondents were eligible to provide an answer and only 13 (1.9%) used all available slots. If more than five slots had been used, they would probably have largely remained empty. We conclude that the five-slot limit is meaningful and does not reduce the quality of obtained data.
Table 5: Number of available slots and percentage of respondents who filled all available slots by questionnaire item and country
AUS AUT BEL BGR FRA GEO Turks
in DEU
DEU HUN ITA LTU NLD NOR ROU RUS
a204 receiving regular help with childcare
n slots 4 5 5 5 5 5 5 5 5 5 6 5 4 5
n
eligible 748 1202 1016 1424 985 719 356 688 1716 533 2026 2640 518 1208
n last
slot 5 0 0 13 3 1 2 13 57 3 8 142 7 12
% last
slot 0.7 0.0 0.0 0.9 0.3 0.1 0.6 1.9 3.3 0.6 0.4 5.4 1.4 1.0
a208 giving regular help with childcare
n slots 3 5 5 3 5 5 5 5 5 5 4 5
n
eligible 720 1434 929 2623 780 326 798 701 801 3656 679 1814
n last
slot 16 1 0 81 0 1 6 6 0 15 3 0
% last
slot 2.2 0.1 0.0 3.1 0.0 0.3 0.8 0.9 0.0 0.4 0.4 0.0
a707 receiving regular help with personal care
n slots 5 5 4 5 5 5 5 4 5 5 5
n
eligible 38 157 37 216 20 42 21 80 10 146 138
n last
slot 2 1 1 3 0 1 1 4 0 2 2
% last
slot 5.3 0.6 2.7 1.4 0.0 2.4 4.8 5.0 0.0 1.4 1.4
a711 giving regular help with personal care
n slots 5 5 5 5 3 5 5 5 5 5 10 5 5
n
eligible 519 308 540 809 549 815 120 538 584 545 1107 595 1020
n last
slot 0 0 2 0 1 0 0 3 4 1 9 5 0
% last
slot 0.0 0.0 0.4 0.0 0.2 0.0 0.0 0.6 0.7 0.2 0.8 0.8 0.0
a714 talking to someone about personal experiences and feelings
n slots 5 5 5 7 5 5 5 5 5 5 5
n
eligible 4327 4302 8693 6356 7308 1715 5681 5974 12578 5249 7852
n last
slot 498 490 291 121 137 25 292 238 2930 171 147
% last
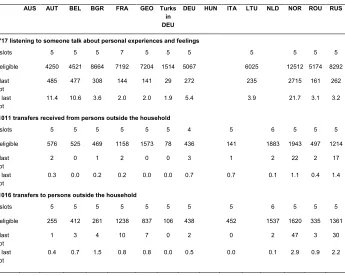
Table 5: (Continued)
AUS AUT BEL BGR FRA GEO Turks
in DEU
DEU HUN ITA LTU NLD NOR ROU RUS
a717 listening to someone talk about personal experiences and feelings
n slots 5 5 5 7 5 5 5 5 5 5 5
n eligible 4250 4521 8664 7192 7204 1514 5067 6025 12512 5174 8292
n last slot
485 477 308 144 141 29 272 235 2715 161 262
% last
slot 11.4 10.6 3.6 2.0 2.0 1.9 5.4 3.9 21.7 3.1 3.2
a1011 transfers received from persons outside the household
n slots 5 5 5 5 5 5 4 5 6 5 5 5
n eligible 576 525 469 1158 1573 78 436 141 1883 1943 497 1214
n last slot
2 0 1 2 0 0 3 1 2 22 2 17
% last
slot 0.3 0.0 0.2 0.2 0.0 0.0 0.7 0.7 0.1 1.1 0.4 1.4
a1016 transfers to persons outside the household
n slots 5 5 5 5 5 5 5 5 6 5 5 5
n eligible 255 412 261 1238 837 106 438 452 1537 1620 335 1361
n last
slot 1 3 4 10 7 0 2 0 2 47 3 30
% last
slot 0.4 0.7 1.5 0.8 0.8 0.0 0.5 0.0 0.1 2.9 0.9 2.2
The experiment was designed as a split-ballot, where the total sample is randomly divided into two subsamples. Each subsample is presented with an alternative version of the survey question. Respondents were thus randomly split into two groups: (a) ‘no cap’ group, where an unlimited number of names could be listed and (b) ‘cap’ group, where a maximum of five names was imposed. The data were collected in the fall of 2011 from a random two-stage stratified sample taken from the Slovenian central population register. The age span was 18 to 79. The size of the starting sample was 648 and that of the final sample 210, resulting in a response rate of 32.4%. The data were collected by a combination of assisted personal interviewing, computer-assisted telephone interviewing, and web surveying, in order to maximise the response rate (Dillman 2000).
We then examined whether capping the number of network members resulted in a shorter list of names. The complicating circumstance is that this cannot be determined by means of a simple t-test. Student’s t-test assumes that both samples have a normal distribution. This assumption is clearly violated: the number of generated names is Poisson-distributed. We resorted to a non-parametric test (the Mann–Whitney U test) that makes no distributional assumptions (Fay and Proschan 2010). The mean size of the emotional support network is somewhat larger in the no-cap condition (2.19) than in the cap condition (1.86), but the difference is not significant (Wilcoxon rank-sum test p-value 0.44). The finding suggests that it does not matter whether a list of possible network members is unlimited or is limited to five. This decision does not influence the results. The results of the experiment confirm that the cap of five, which is used in the first wave of the GGS, is adequate.
4. Overview of research using social network indices from the GGS
4.1 Network influences on demographic behaviour
Publications that utilise network indices in explanations of demographic behaviour are primarily located in the field of fertility. A variety of studies explore the impact of network-based help and support − fertility-related social capital − on individuals’ intentions to have a first or another child within the context of different welfare state regulations.
Philipov, Spéder, and Billari (2006) argue that supportive relationships become especially important for reproductive decisions if institutions of the welfare system are weak or have disappeared, as was the case during the transition periods of Central and Eastern European societies. In a comparative study of Bulgaria and Hungary, they show especially for Bulgaria that the embeddedness in supportive exchange networks has a significant impact on quantum-related and tempo-related reproductive decisions. Bulgarian couples are more likely to have another child and less likely to postpone having a(nother) child if instrumental support is forthcoming. Di Giulio and colleagues (2012) widen the scope of analysis. They opine that supportive social relationships as well as welfare systems matter for reproductive decisions because they are able to ease households’ money and time constraints. As a consequence, the significance of social support varies with the character and effectiveness of the welfare system. This hypothesis is supported for Germany and Bulgaria, but not for Italy. Further evidence is provided by Tanskanen and Rotkirch (2014), who report that grandparental investment, especially emotional support, appears to have the greatest influence on the decision to have a second or third child in wealthier European countries and among more financially secure families.
Balbo and Mills (2012) add a further perspective, by arguing that welfare systems do not only matter for fertility-related social support but also for the presence and significance of normative expectations by the social environment. They show for Bulgaria, France, and Germany that normative expectations to have another child as well as emotional support exert positive influences on respondents’ intentions to have a second or third child. The authors also find a systematic variation of normative pressures depending on the countries’ family policies and gender systems. The more familialistic these institutions are, the more individuals rely on fertility-related social support, and the more they are exposed to normative pressures.
Dommermuth, Klobas, and Lappegård (2011) focus on the relevance of the social environment’s normative expectations to the intended timing of births within the Theory of Planned Behaviour. They show for Norway that normative expectations to have a first or an additional child lead to respondents’ intentions to have this child earlier.
relationships with a high future probability of providing childcare. König (2011) follows the first perspective and shows for Hungary that experienced paid and unpaid childcare (the latter being mostly informal) exerts positive influences on the intentions to have another child. Régnier-Loilier and Vigil (2011) use the perspective of role relationships by addressing a respondent’s mother as a potential provider of childcare in France and Italy. The authors argue that the probability of childcare by the mother declines the further the mother lives away from the respondent, which again has an influence on the respondent’s realisation of fertility intentions. In France, a mother living nearby encourages the realisation of the intention to have a first or another child. The results for Italy, however, are less clear, as a mother living moderately distant from the respondent encourages the realisation of fertility intentions but also the decision to have no more children.
4.2 Care
Research on the topic of care using GGS data has so far largely focused on the impact of externalising care responsibilities on mothers’ employment, and how this impact differs across European countries with varying degrees of economic development and different family regimes. This focus is unsurprising, given aims of increasing female participation in the labour force and the lively debate in policy and public circles about how to combine work and family life. There are two ways of externalising care: help provided by informal caregivers (e.g., extended family members, friends, and neighbours) or the use of formal care services in the public or private market.
and work. There are, however, striking differences between the three regions in making use of these external care resources in the case of small children, with variation in the gender division of labour as a result. In West Germany the ‘male-breadwinner’ and ‘one-and-a-half earner’ models prevail: families with small children are not prone to make use of external care resources. In East Germany and Bulgaria, on the other hand, the ‘dual earner’ model dominates, fostered by a greater availability of public childcare facilities in East Germany and the combined use of institutional and family care in Bulgaria.
Rather than focusing on women’s labour force participation, Kuchařová (2009) uses people’s subjective assessment of work-family conflict as the dependent variable. Her analyses are restricted to people living in a nuclear family in three Eastern European countries (Bulgaria, Czech Republic, and Georgia) and one Western European country (France). A key conclusion drawn from her work is that mothers with young children in France and Georgia are better able than their peers in Bulgaria and the Czech Republic to return to work, due to the greater availability of formal childcare and the help of grandparents, respectively.
4.3 Network influences on well-being
A steadily increasing number of GGS studies have adopted a social network perspective to identify determinants of mental, physical, and economic well-being. Moor and Komter (2011) focus on the relevance of family ties for depressive feelings in Eastern and Western Europe. Their analyses show that the likelihood of depressive mood increases if parents are divorced or if both parents have died. It decreases, however, in the case of being married, having children of age 12 or older, or having one or two siblings. Scodellaro, Khlat, and Jusot (2012), using French data on men and women aged 25–49, report that those with large financial transfers from their parents were much more likely to report very good health than those who had not been given anything. The underlying mechanisms are unclear, however. Do transfers reflect close family bonds which help people feel better, or do they provide the material resources to purchase better health care?
question the dominant focus on improving the quality and number of close relationships in efforts to reduce older adult loneliness. Their study shows that poor health and low socioeconomic status are the primary determinants of loneliness in their sample.
The provision of care and its implications for well-being is the topic of a paper by Wolf, Raissian, and Grundy (2015). Using data from five GGS countries they distinguish three groups: “caregivers” (people who report that their parent has care needs and who provide care), “non-caregivers” (people who report that their parent has care needs but who do not provide care), and those “not at risk” of parental caregiving, the reference group. Evidence of “caregiver stress” (higher depression levels) is reported for Bulgaria and Georgia; evidence of “non-caregiver stress” is reported for Bulgaria and France. The authors emphasise that “non-caregiver stress” is by no means universal. In a resource-rich environment such as France, parental functional decline might be more upsetting. Physical and cultural isolation of Romanian older adults might contribute to the high proportion of non-caregiving adult children. Hansen and Slagsvold (2013) examine the implications of spousal caregiving, using both cross-sectional and longitudinal data from Norway. Their findings show − confirming the findings from many previous studies − that caregiving has considerable detrimental psychological effects for husbands and wives, irrespective of age and socioeconomic status.
Other studies have analysed the impact of marital status and type of family on well-being, utilising standard socio-demographic variables as indicators of the composition of a person’s social network (see, for example, Kovács 2005; Kreyenfeld and Martin 2011). The positive effect on well-being of having a partner (e.g., non-married people are more likely to be in poor health, single parents more often have difficulties in making ends meet) is a consistent finding. A number of studies of well-being have drawn on respondents’ evaluations of their social networks (see, for example, Buckley et al. 2011; Kotwal 2010; Wengler 2010), using items from the De Jong Gierveld Loneliness Scale, such as “There are enough people that I feel close to” and “There are many people that I can count on completely”. These studies, all examining health differences between migrant and non-migrant people, show that those who evaluate their social network as being supportive are on average in better health.
4.4 Implications of demographic changes for social networks
general demographic developments and to the demographic events in an individual’s life.
Puur et al. (2011) argue that country-specific developments in fertility and longevity should be visible in different patterns of multi-generational family structure. Contrary to their hypothesis, however, they find, on the basis of data from nine European societies, a predominance of three generations, irrespective of the demographic developments in the particular countries. The virtually identical proportions of one-, two-, three-, and four-generation families in France and in Russia, despite quite different underlying demographic processes, are a further illustration. In France, where people tend to live long lives, adults have relatively many ascending family generations. In Russia, where people tend to have children at a young age, adults have relatively many descending family generations.
Herlofson and Hagestad (2011) look more closely at the consequences of an ageing society for the availability of kin and intergenerational relationships. They argue, along with others, that reduced fertility does not automatically imply low levels of care for the parents when they are old, as having fewer siblings increases the probability of being involved in care duties. They also note, however, that the number of individuals without any intergenerational relations to close family members is increasing. Pursuing the theme of childlessness, Albertini and Mencarini (2014) report for Italy that older adults without children receive less financial and instrumental help than parents, but more emotional support. The difference increases with increasing age, suggesting that in the last phase of life, childless older adults are likely to lack the type of help that is most needed when functional capacities decline. The authors conclude that older adults without children are most vulnerable in the familistic welfare states of Southern Europe.
Leopold and Skopek (2015) contrast the timing of fertility and the timing of mortality to gain insight into cross-national differences in the age at which people become grandparents, and the duration of the grandparental life stage. Their findings, based on a wider range of surveys than only the GGS, show a strong East-West divide in the timing of the transition to grandparenthood. The median age at the transition to grandparenthood is lower in the East (with age 46 for women and age 49 for men in Ukraine at the lowest end) than in the West (with age 57 for women in Switzerland and age 60 for men in Spain at the highest end). The length of the grandparent life stage is more strongly influenced by the timing of fertility than by the timing of mortality. Estimates for Europe show that the longest years of life shared with grandchildren (35 years) are for East German grandmothers, the shortest (21 years) are for grandfathers in West Germany and Spain.
exchange of emotional support in Eastern European societies, finding substantial levels of intergenerational exchange. The intensity of exchanges is structured by opportunity structures and individual motivations, such as spatial proximity, presence of siblings, or a loss of family ties due to divorce. In Italy, young adults living on their own generally receive less parental support than their peers who live with a partner (Amati, Rivellini, and Zaccarin 2015). However, singles living in north eastern Italy are much more likely than singles living elsewhere in Italy to receive high levels of parental support. Maslauskaitė (2011) investigates the impact of life course events on the intensity of face-to-face contact between parents and non-coresident adult children in Lithuania. After divorce, fathers experience a decline in face-to-face contact with their children, particularly with their daughters. However, this decline is less serious the older the children are when the parental divorce takes place. Post-divorce events, whether in the lives of the parents or the children, have no impacts. Régnier-Loilier (2006) shows with French data that residential separation between parents and children in early phases of life significantly reduces the intensity of face-to-face contacts at older ages. Parental divorce weakens the ties between fathers and children more seriously than the ties between mothers and children, a finding that is also reported by Maslauskaitė (2011). Taking advantage of the supplemental GGS survey of Turkish citizens living in Germany, Steinbach (2013) examines variations in the frequency of contact between adult children and their parents by migrant status and family structure. Findings show that the frequency of contact is significantly higher for biological parents living with the child’s other biological parent than for parents without a partner, parents with a new partner, or stepparents. Contact is more frequent for all Turkish families, but the pattern of variation by family structure is similar for both Germans and Turks.
5. Evaluation of social network indices in the GGS
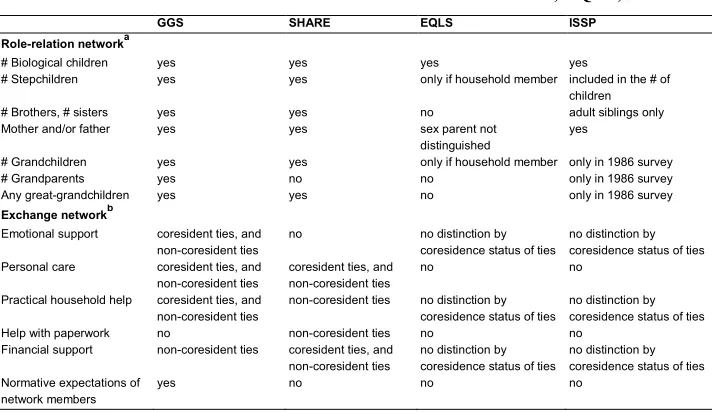
5.1 Uniqueness of the GGS social network indices(step)children and brothers and sisters ever born − enabling analyses of the loss of close family ties by death.
Table 6: GGS social network indices versus those in SHARE, EQLS, and ISSP
GGS SHARE EQLS ISSP
Role-relation networka
# Biological children yes yes yes yes
# Stepchildren yes yes only if household member included in the # of
children
# Brothers, # sisters yes yes no adult siblings only
Mother and/or father yes yes sex parent not
distinguished yes
# Grandchildren yes yes only if household member only in 1986 survey
# Grandparents yes no no only in 1986 survey
Any great-grandchildren yes yes no only in 1986 survey
Exchange networkb
Emotional support coresident ties, and
non-coresident ties
no no distinction by
coresidence status of ties
no distinction by coresidence status of ties
Personal care coresident ties, and
non-coresident ties
coresident ties, and non-coresident ties
no no
Practical household help coresident ties, and
non-coresident ties
non-coresident ties no distinction by
coresidence status of ties
no distinction by coresidence status of ties
Help with paperwork no non-coresident ties no no
Financial support non-coresident ties coresident ties, and
non-coresident ties
no distinction by coresidence status of ties
no distinction by coresidence status of ties Normative expectations of
network members
yes no no no
a GGS is the only survey that has information on the number of (step)children, brothers and sisters ever born, and the number still
alive.
b Both GGS and SHARE have measures of actual support exchanges. EQLS and ISSP have measures of the perceived availability
of support should it be needed. The wording of the types of practical, emotional, and financial support varies across the surveys. SHARE and EQLS have measures of support intensity (number of hours per week).
As the bottom part of Table 6 shows, the GGS is the only survey with information on normative expectations of social network members. Thus, another unique feature of this survey is that it allows assessment of the influence of parents, children, friends, and relatives on decisions such as leaving home, entering the labour market, starting to live with a partner, and having children, respectively.
5.2 Limitations of the GGS social network indices
Though the GGS respondents cover a wide age range, the two extremes of the age distribution, the youngest (0−17) and the oldest (80+), are not represented. Furthermore, the GGS does not include questions about all living generations, ascending and descending. As a consequence, no accurate estimates of generational structures (the proportion of four- or five-generation families) can be made. The numbers of those in extended intergenerational family structures are likely underestimated. Neither can an accurate assessment be made of families including great-great- and great-grandchildren, or of families including great-great- and great-grandparents. Respondents are only asked about the number, and not the gender of (great-)grandparents still living. In order to study men and women in multigenerational structures, not only must the gender of the primary respondent be specified, but also the gender of members in ascending and descending generations.
The GGS reports on exchanges of practical, emotional, and financial support. However, it lacks an adequate measure of conditions for supportive exchanges, such as coresidence, geographic proximity, frequency of contact, and competing obligations. This is attributable to the absence of unique identifying information for members of the exchange network. To illustrate: the GGS only contains information about whether or not the respondent had support exchanges with a child in the last 12 months, not about which child was involved in the exchange.11 Therefore personal information from the
primary respondents cannot be linked to personal information from their children. Neither is information available about how often support exchanges occur between primary respondents and their network members, and about how much time is involved. There is only information on whether or not the respondent engaged in support exchanges in the last 12 months. It is possible that different outcomes would be found if there were details on the frequency and intensity of support exchanges. For example, divorce might affect the intensity of emotional exchanges, rather than the likelihood of those exchanges.
11 Note that the questionnaire developed for GGS wave 4 has resolved this issue: itcombines name generators
As a multi-purpose survey, the GGS targets researchers with a wide range of interests apart from a primary interest in social networks: coresidence, family formation, intergenerational transmission, inequality, care arrangements, life course transitions, and so forth. The social network measures need to draw upon and mesh with measures of related topics (such as the household roster, parental home, unpaid labour) as much as possible. As a result, social network indices are scattered all over the GGS questionnaire. For researchers with a primary interest in social networks, it would be preferable to have the various measures in a separate section.
5.3 Blank spots in the usage of social network indices
As described earlier, social networks are relevant to three kinds of substantive GGP issue: the antecedents and consequences of demographic behaviour, the interplay of private and public care, and the explanation of differences in well-being. In what follows, we consider the extent to which researchers using GGS data have addressed these topics.
A major innovation of the GGS lies in its focus on the impact of intergenerational and gender relations on demographic behaviour. Interestingly, research on this issue has largely focused on fertility behaviour. Little attention has been paid to other demographic behaviours, such as leaving the parental home, starting and ending partnerships, and retirement. Perhaps the focus on parenthood should not come as a surprise: decreasing fertility rates over recent decades have received a considerable amount of attention among researchers and policymakers. Demographers have been considerably more interested in fertility than infertility, and researchers with an interest in families and intergenerational ties have overlooked the rather large proportion of people who do not have children.
Several studies have examined intergenerational linkages in families. Nevertheless, the primary focus has been on biological ties between children, parents, and grandparents. ‘New’ family forms such as stepfamilies have not (yet) received much attention. It is important to note that the GGS is an ideal data set for investigating stepfamilies, given that it has detailed information on the relationship of the respondent to his/her children as well as to the children of the respondent’s coresident partner. The position of the respondent in relation to each household member is assessed in a ‘household grid’.
looked upon as dependents, but also as givers of support and care to their parents and grandparents. This is a topic for future research.
Only a few studies have used the exchange-network questions in analyses of well-being, whether as dependent or independent variables. Some studies have measured social and/or emotional support by using one or more of the items of the De Jong Gierveld Loneliness Scale (De Jong Gierveld and Van Tilburg 2010) instead of the support indices. Most attention has been given to the closest family ties (partner, children, parents). Little attention has as yet been paid to ties with siblings.
Longitudinal GGS data from selected countries are increasingly becoming available. Future waves will provide ample opportunity to examine the impact of changes in networks on various demographic outcomes, or vice versa. Overall, the GGS has a wealth of social network data, both cross-sectional and longitudinal, that warrants a myriad of future investigations.