Issues
ISSN: 2146-4138
available at http: www.econjournals.com
International Journal of Economics and Financial Issues, 2020, 10(1), 244-249.
How do Calendar Anomalies Affect an Investment Choice? A
Proposal of an Analytic Hierarchy Process Model
Matteo Rossi*, Gabriella Marcarelli, Antonella Ferraro, Antonio Lucadamo
Department of Economics, Management and Quantitative Methods, University of Sannio, Italy. *Email: [email protected]
Received: 18 November 2019 Accepted: 10 January 2020 DOI: https://doi.org/10.32479/ijefi.8995 ABSTRACT
In recent years, financial markets changed for globalization. Today, a wide range of investment opportunities is available to investors. In this new scenario, markets are related, but each of them has specific characteristics with particular opportunities for investors. An investment choice can be influenced by numerous qualitative and quantitative factors that often conflict with one other. Thus, portfolio management choice is a multi-criteria decision problem today, so it requires flexible and analytic decision tools for investors. For this task, the Analytic Hierarchy Process (AHP) is suitable. We propose a theoretical model to analyse an investment choice problem taking into account different financial markets. Return of stock market, performance of the government bond and calendar effects in the financial markets considered are the evaluation criteria used in our model. The proposed model has strengths and weaknesses. First, through the AHP methodology the problem can be decomposed into a dominance hierarchy. Then, the subjective judgements expressed by means of pairwise comparisons are cheked in order to verify their consistency. Moreover, it is flexible and allows us to check if the ranking changes based on varying criteria weights. However, in that model we assume that criteria and alternatives are independent. Furthermore, our research lacks of a numerical application to test the model.
Keywords: Analytic Hierarchy Process, Calendar Anomalies, Government Bonds, Stock Market, Investment Choice
JEL Classifications: C13, C44, G11, G14, G40
1. INTRODUCTION
In recent years, financial markets changed for globalization. Today, a wide range of investment opportunities is available to investors. They could select different products (stocks, bonds, currencies, options) in diverse financial markets. In this new scenario, markets are related, but each of them has specific characteristics with particular
opportunities for investors. Investors differ in aims and restrictions,
which makes portfolio management choice more complex and dynamic (Khaksari et al., 1989). Moreover, an investment decision
should be opportunely modelled, as it is regarded as a major and
strategic choice (Zopounidis, 1999). An investment decision may be influenced by many qualitative and quantitative factors in conflict with one other. Thus, portfolio management decision is a multi-criteria problem today, so it requires flexible and analytic decision tools for investors. The Analytic Hierarchy Process (AHP) may be
used for this kind of problem (Saaty, 1980, Ülengin and Ülengin, 1994, Zopounidis, 1999). In fact, AHP supports decision makers
across the whole process, from the formulation to the evaluation
and choice phases (Zopounidis, 1999).
Based on these statements, we present a theoretical model to financial decisions.
Our model considers the following criteria: Return of stock market, performance of the government bonds, and the presence of
calendar effects. We analyse the impact of calendar effects on the
financial choice. A Calendar Anomaly (CA) is cycling irregularity in a stock market (Rossi, 2015). The evidence of observed calendar effects in different stock exchanges have been shown by several researchers (Agrawal and Tandon, 1994; Gultekin and Gultekin, 1983; Ariel, 1987; Latifm et al., 2011).
In order to analyse the calendar effects criterion, we perform some statistic tests.
The structure of the paper is the following. Section 2 offers two different literature reviews: The first one concerns the AHP method
and the second one the calendar effects. Section 3 presents our theoretical model. Finally, section 4 provides conclusions and future development of our paper.
2. THEORETICAL BASIS
In this section, we present two different brief literature reviews.
The section 2.1 presents the literature of AHP in financial context. The paragraph 2.2 shows a review about the most important calendar anomalies.
2.1. AHP Background
At the end of seventies, Saaty introduced the AHP as a multicriteria
method. It represents a problem by using a hierarchical structure and derives relative and global weights for hierachical elements
based on expert judgements (Saaty, 1980). AHP allows complex
decision problems to be analysed by simultaneously considering
qualitative and quantitative elements and it provides priorities by
means of pairwise comparison matrices.
AHP applied in several fields, such as portfolio selection, resource
allocation, environmental impact evaluation. Saaty and Vargas
(1982) illustrate some applications: Business, energy, health and
transportation.
Concerning financial applications, AHP is used for portfolio comparisons (Martel et al., 1988), the evaluation of the exchange rate (Ülengin and Ülengin 1994), financial decision problems (Zopounidis, 1999).
Spronk et al. (2005) analysed contributions of multi-criteria decision methods in finance. Zouponidis et al. (2015) showed a
bibliographic survey of multi criteria analysis contributions in
financial decision making.
Furthermore, it is used for selecting the target markets and
distribution channels, and directing the resource allocation among
portfolio elements (Saaty and Vargas, 1982).
Among the evaluation criteria used to reach the goal are calendar effects, representing an importan topic in the financial field.
2.2. Calendar Effect Background
Calendar effects verify when a change in the stock prices is influenced by specific periods of the calendar year. Various studies have documented unexpected and abnormal regularities in relation to certain moments of a day, days of the week, periods of a month or months of the year (Wachtel, 1942; Rozeff and Kinney, 1976; French, 1980; Barone, 1990; Agrawal and Tandon, 1994; Kolsi and Attayah, 2017; Mansali and Daadaa, 2018).
Essentially, the academic world and professional operators have, in
various ways, analysed stock returns by looking for a link between
price changes and what time they occur. Therefore, the principal calendar effects are explored.
2.2.1. Weekend anomaly
This is a calendar effect under which the stock prices tend to fall on Monday. The first two studies that verify the speed of the generative process of stock prices were realized by Fama (1965) and Granger and Morgenstern (1970). They came to show that when the market is closed the stochastic process followed by the share price (random walk) continues to operate but at a lower speed. This means that the closing price on Monday is less than the closing price on the previous Friday (Latifm et al., 2011).
These results were substained by other studies (French, 1980; Gibbons and Hess, 1981; Jaffe and Westerfield, 1985; Schwert, 2003; Chen and Singal, 2003; Miller et al., 2006).
2.2.2. January effect
“As goes January, so goes the year” is a famous law in the stock market. This is also called the “turn of the year” effect. In other
words, there is an abnormal January returns in most countries
(Gultekin and Gultekin, 1983). The first evidence of abnormal stock returns in January for US stock markets was observed by Wachtel (1942). This effect was confirmed by many scholars (Rozeff and Kinney, 1976; Barone, 1990; Wong et al., 2006; Rossi and Fattoruso, 2017).
2.2.3. Holiday effect
This effect shows a significant return on days before public holidays (Pettengill, 1989; Ariel, 1990; Marrett and Worthington, 2009). This effect influences the performance of daily share returns. Ariel (1990) verifies a significant growth in the Christmas eve and May Day eve compared to other holidays. The abnormality is present in different markets. Different observations (Lakonishok and Smidt, 1988; Barone, 1990; Kim and Park, 1994; Meneu and Pardo, 2004; Cao et al., 2009) confirm these results with abnormal
post-holiday returns.
2.2.4. Turn of the month (ToM) anomaly
In 1987, Ariel first identifies the ToM effect for the US stock market. He discovered that mean returns are higher at the end of a month and at the beginning of the next month. This result is confirmed by many scholars (Thaler, 1987; Pettengill and Jordan, 1988; Agrawal and Tandon, 1994). Some recent researches confirmed that this effect is still present in other stock market (Hensel and Ziemba, 1996; McConnell and Xu, 2008).
2.2.5. Halloween effect
This anomaly, also known as Halloween indicator (sell in May and go away), is a strong seasonal event according to which the equity returns are lesser during the period May - October than the rest of the year (Lean, 2011).
Bouman and Jacobsen (2002), Jacobsen and Visaltanachoti (2009), Haggard and Witte (2010), Andrade et al. (2013) discussed the importance of Halloween anomaly in several stock markets and
2.2.6. Intraday effect
Some studies on the yields of intraday securities have highlited that trading volume, volatility, orders, tend to be higher at the
open and near the minutes just before closing for different stock exchanges (Kucukkocaogly, 2008).
A study on the intraday effect was develop by Lawrence (1986). He calculated the yield rates of the securities every 15 min in a
trading day and found that the variations of the prices are greatest
at the end of trading day. Different scholars (McInish and Wood, 1990; Foster and Viswanathan, 1993; Chan et al., 1996; Bildik, 2001) confirmed the presence of intraday anomaly.
3. RESULTS
The aim of the research is to propose an AHP model to analyze an investment decision involving different stock markets. In our theoretical model we consider the following criteria: SMR, GB performance and CA in different stock markets.
As regard to SMR and GB, data are accessible on international databases. For analyzing CA, we proposed performing some mean difference tests regarding a 10-year period for different financial markets.
For the study of calendar effects, we calculate the averages of the
rates of change for both indices. Then, in order to verify if there is a significant effect in the markets, we perform a statistical test
on proportion differences:
H0: π1−π2=0
H1: π1−π2>0 or H1: π1−π2<0
where π1 is the population proportion of positive (or negative) changes in the considered period (e.g. Holiday), whereas π2 is the population proportion in the other periods.
We use the following statistic to check the rejection or not of the null hypothesis (H0):
1 2
c c
1 2
p p
Z= ~N(0,1)
1 1
p (1 p ) +
n n
-æ ö
- ç ÷
è ø
where:
• p1 is the relative frequency in the sample extracted from the first population
• p2 is the relative frequency in the sample extracted from the
second population
• 1 1 2 2 c
1 2
n p +n p p =
n +n
• n1 and n2 are the sizes of the two samples.
If Z >zα (or Z< −zα) then the null hypothesis has to be rejected. zα is the quantile of the normal standardized distribution and is the chosen significance level (Piccolo, 2010).
Defined all criteria we design the model.
The AHP process requires four steps (Saaty, 1980; Saaty and Vargas, 1982; Saaty, 1994).
3.1. Hierarchical Structure of the Problem
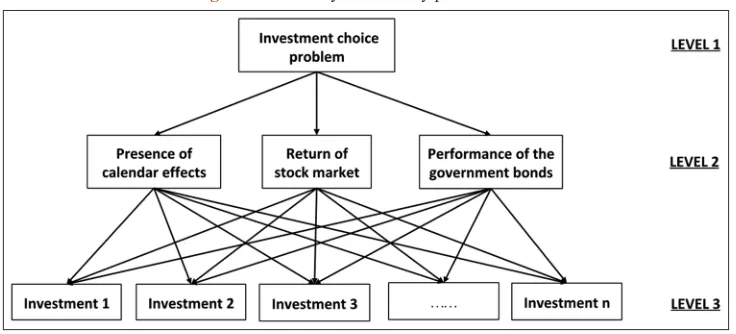
The problem is decomposed into three levels: On the bottom level, there are the alternatives; the intermediate level contains criteria used to compare the investment choices; on the top there is the
objective of the problem.
3.2. Pairwise Comparison Matrices
This step involves the use of pairwise comparisons for
establishing the relative priorities, representing the importance of the components of a level as regards the components of the immediately upper level.
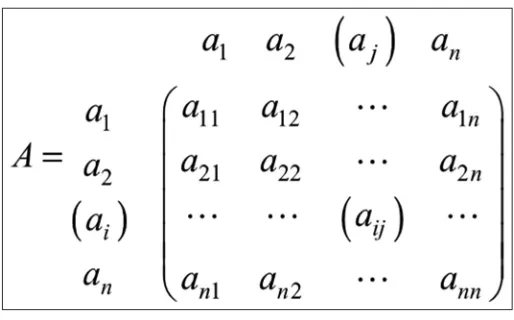
We assign a judgment, aij, to couples of elements (xi,xj) of a level as regard to a given component of the upper level. This judgment is a value >1 if the component xi is preferred to the component xj,
whereas the opposite preference relation is indicated by a value
lower than 1; and the indifference between two components is indicated by 1. A matrix of order n is constructed when compare
n components, as shown in Figure 1.
A pairwise comparison matrix is reciprocal, that is
aji=1⁄aij for i,j=1,….,n (1)
and all values on the main diagonal are equal to 1
aji=1 for i =1,….,n (2)
Judgements are assigned using the Saaty’s scale (1, 2, 3, 4, 5, 6, 7, 8, 9, 1/9, 1/8, 1/7, 1/6, 1/5, 1/4, 1/3, 1/2). In this scale, 1 indicates indifference and therefore equal importance, while the values from
2 to 9 indicate progressively increasing degrees of importance,
from weak to absolute (Saaty and Vargas, 1982).
The matrix is perfectly consistent if the following consistency
condition holds:
aij ajk = aik for each i, j, k =1, 2,….,n (3)
Unfortunately, this matrix may not be consistent. This can happen
and/or proportionality. Indeed, a preference relation is transitive if
assuming that xi is preferred to xj and xj is preferred to xk, then xi is preferred to xk. Furthermore, the inconsistency may be caused by the violation of the proportionality between the elements even
if the transitivity property is satisfied. The preference relation is
proportional if
aij = 4 and ajk = 2 simply that aik = 8.
The literature has proposed several consistency indices to check the inconsistency level in a set of pairwise judgements (Saaty, 1980; Koczkodaj, 1993; Salo and Hamalainen, 1997; Crawford and Williams, 1985). Each index represents the degree of inconsistency in the judgements expressed by a real number.
The consistency index (CI):
CI=(λmax−n)/(n−1) (4)
suggested by Saaty (1980) is equal to zero in the case of perfect consistency; the value increases as inconsistency increases. To check the randomness of judgments Saaty considers the consistency ratio (CR):
CI CR=
RI (5)
where RI is the average value of CI derived from a sample of 50,000 randomly generated reciprocal matrices (Saaty, 1980).
The matrix has a tolerable inconsistency if CR <0.1.
The consistency of judgements is important because it is strictly linked to the accuracy of preferences. When the judgements are
inconsistent the priorites estimates are not reliable because each
prioritization method may provide a different priority vector (Grzybowski, 2016). Instead, if the matrix is are fully consistent, then all prioritization methods give the same result.
We point out that consistency indices and the thresholds proposed in literature may be useful to face cardinal consistency, but they
do not take into account ordinal consistency or transitivity (Siraj
et al., 2015). To overcome this kind of problem, Amenta et al. (2018; 2020) proposed some approximated transitivity thresholds for some consistency indices. These thresholds are useful because
they may allow the avoidance of judgement revision if we are only
interested in a qualitative ranking of preferences. If the CI ranges
between the consistency and transitivity threshold values, then we may be sure of the accuracy of preferences.
3.3. Deriving Relative Priorities
The relative relevance of the components can be obtained as the eigenvector associated with the maximum eigenvalue of A:
A• w- = λmax • w- for i, j = 1, 2,…n (6)
by using the eigenvector method (EM) proposed by Saaty.
Other methods can be used to estimate the priority vector
(Saaty, 1980, Aguaron and Moreno-Jimenez 2003, Pelaez and Lamata, 2003, Gass and Rapsak, 2004): The arithmetic mean method (AMM), the row geometric mean method (RGMM), the logarithmic least squares (LLS) method, the singular value decomposition (SVD).
3.4. Deriving Global Priorities
The final AHP step allows to derive the global priorities, expressing the relevance of investment choices as regards the goal. The
relative weights of the components are aggregated by the principle
of hierarchical composition. The global weights provide the global ranking of alternatives.
Once the final ranking is obtained, the AHP allows us to realize the
sensitivity analysis to verify the stability of the resulting solution.
4. DISCUSSION
The software Expert Choice (1994) implements the AHP method
which allows the investors to construct the hierarchy and solve the problem by using relative or absolute measurements.
The Figure 2 shows our model structure related to an investment choice problem with three evaluation criteria and n alternative investments.
The proposed model has strengths and weaknesses. First, the AHP methodology permits to divide the problem into different hierarchical levels. Then, it allows to express subjective
judgements by means of pairwise comparison matrices and to
check their inconsistency. Furthermore, it is flexible and permits to verify if there is a change in the ranking when the weights of
criteria vary.
However, our model should be tested by a numerical application; furthermore, we highlight that the AHP procedure results could be influenced by the uncertainty of other investors’ behaviours and by the uncertainty connected to the country risks.
5. CONCLUSION
Our research presents a multicriteria model to evaluate an
investment choice problem in different stock markets. We consider how calendar effects influence this kind of decision. This criterion has not be considered previously. So in order to construct the AHP model, an in-depth analysis of calendar effects has been required. To check the presence of anomalies, we performed some statistic
tests.
Humans are involved in the decision-making process. For this
reason, it is important to consider both individual preferences and
knowledge (Zopounidis and Doumpos, 2002).
Future directions of our research are to apply the model to real case studies, and in order to prevent any impact, we could consider
financial agents from different Countries.
REFERENCES
Afi, H. (2017), An examination of the relationship between the disposition effect and stock return, volatility, and trading volume: The evidence in US stock markets. International Journal of Managerial and Financial Accounting, 9(3), 242-262.
Agrawal, A., Tandon, K. (1994), Anomalies or illusions? Evidence from stock markets in eighteen countries. Journal of International Money and Finance, 13(1), 83-106.
Aguaron, J., Moreno-Jimenez, J. (2003), The geometric consistency index: Approximated threshold. European Journal of Operational Research, 147(1), 137-145.
Amenta, P., Lucadamo, A., Marcarelli, G. (2018), Approximate thresholds for Salo-Hamalainen index. IFAC PapersOnLine, 11(11), 1655-1659. Amenta, P., Lucadamo, A., Marcarelli, G. (2020), On the transitivity and
consistency approximated thresholds of some consistency indices for pairwise comparison matrices. Information Sciences, 507, 274-287. Andrade, S.C., Chhaochharia, V., Fuerst, M.E. (2013), Sell in May and go
away. Just won’t go away. Financial Analysts Journal, 69(4), 94-105. Ariel, R.A. (1987), A monthly effect in stock returns. Journal of Financial
Economics, 18(1), 161-174.
Ariel, R.A. (1990), High stock returns before holidays: Existence and evidence on possible causes. The Journal of Finance, 45(5), 1611-1626.
Barone, E. (1990), The Italian stock market: Efficiency and calendar anomalies. Journal of Banking and Finance, 14(2-3), 483-510. Bildik, R. (2001), Intra-day seasonalities on stock returns: Evidence from
the Turkish stock market. Emerging Market Review, 2(4), 387-417. Bouman, S., Jacobsen, B. (2002), The Halloween indicator, sell in May
and go away: Another puzzle. American Economic Review, 92(5), 1618-1635.
Cao, X., Premachandra, I.M., Bhabra, G.S., Tang, Y.P. (2009), Firm size and the pre-holiday effect in New Zealand. International Research Journal of Finance and Economics, 32, 171-187.
Chan, K.C., Fong, W., Kho, B., Stulz, R.M. (1996), Information, trading and stock returns: Lessons from dually-listed securities. Journal of Banking and Finance, 20(7), 1161-1187.
Chen, H., Singal, V. (2003), Role of speculative short sales in price formation: The case of the weekend effect. The Journal of Finance, 58(2), 685-706.
Crawford, G., Williams, C. (1985), A note on the analysis of subjective judgment matrices. Journal of Mathematical Psychology, 29(4), 387-405.
Expert Choice Software. (1994), Expert Choice. Pittsburgh: Expert Choice Software.
Fama, E.F. (1965), The behavior of stock-market prices. The Journal of Business, 38(1), 34-105.
Foster, F.D., Viswanathan, S. (1993), Variations in trading volume, return volatility, and trading costs: Evidence on recent price formation models. Journal of Finance, 48(1), 187-211.
French, K.R. (1980), Stock returns and the weekend effect. Journal of Financial Economics, 8(1), 55-69.
Gass, S., Rapcsak, T. (2004), Singular value decomposition in AHP. European Journal of Operational Research, 154(3), 573-584. Gibbons, M., Hess, P. (1981), Day of the week effects and asset returns.
Journal of Business, 54(4), 579-596.
Granger, C.W.J., Morgenstern, O. (1970), Predictability of Stock Market Prices. Lexington, MA: Heath Lexington Books.
Grzybowski, A. (2016), New result on inconsistency indices and their relationship with the quality of priority vector estimation. Expert Systems with Applications, 43, 197-212.
Gultekin, M.N., Gultekin, N.B. (1983), Stock market seasonality. International evidence. Journal of Financial Economics, 12(4), 469-481.
Haggard, K.S., Witte, H.D. (2010), The Halloween effect: Trick or treat? International Review of Financial Analysis, 19(5), 379-387. Hensel, C.R., Ziemba, W.T. (1996), Investment results from exploiting
turn-of-the-month effects. (Digest summary). Journal of Portfolio Management, 22(3), 17-23.
Jacobsen, B., Visaltanachoti, N. (2009), The Halloween Effect in US Sectors. The Financial Review, 44 (3), 437-459.
Jaffe, J., Westerfield, R. (1985), The weekend effect in common stock returns: The international evidence. Journal of Finance, 40(2), 433-454.
Khaksari, S., Kamath R., Grieves, R. (1989), A new approach to determining optimum portfolio mix. The Journal of Portfolio Management, 15(3), 43-49.
Kim, C.W., Park, J. (1994), Holiday effect and stock returns: Further evidence. Journal of Financial and Quantitative Analysis, 29(1), 145-157.
Koczkodaj, W. (1993), A new definition of consistency of pairwise comparisons. Mathematical and Computer Modelling, 18(7), 79-84. Kolsi, M.C., Attayah, O.F. (2017), How are discretionary accruals priced?
Evidence from the Canadian stock market. International Journal of Managerial and Financial Accounting, 9(3), 283-302.
Kucukkocaogly, G. (2008), Intra-day stock returns and close-end price manipulation in the Istanbul stock exchange. Frontiers in Finance and Economics, 5(1), 46-84.
Lakonishok, J., Smidt, S. (1988), Are seasonal anomalies real? A ninety-year perspective. Review of Financial Studies, 1(4), 403-425. Latifm M., Arhsad, S., Fatima, M., Farooq, S. (2011), Market efficiency,
2(9/10), 1-14.
Lawrence, H. (1986), A transaction data study of weekly and intradaily patterns in stock returns. Journal of Financial Economics, 16(1), 99-117.
Lean, H.H. (2011), The Halloween puzzle in selected Asian stock markets. Journal of Economics and Management, 5(2), 216-225.
Mansali, H., Daadaa, W. (2018), Equities issues and long-term firm’s performances in Tunisian stock market. International Journal of Managerial and Financial Accounting, 10(1), 32-47.
Marrett, G.K., Worthington, A.C. (2009), An empirical note on the holiday effect in the Australian stock market. Applied Financial Letters, 16, 1769-1772.
Martel, J.M, Khoury, N.T., Bergeron, M. (1988), An apllication of a multicriteria approach to protfolio comparisons. Journal of the Operational Research Society, 39(7), 617-628.
McConnell, J.J., Xu, W. (2008), Equity returns at the turn of the month. Financial Analysts Journal, 64(2), 49-64.
McInish, T.H., Wood, R.A. (1990), A transaction data analysis of the variability of common stock returns during 1980-1984. Journal of Banking and Finance, 14(1), 99-112.
Meneu, V., Pardo, A. (2004), Pre-holiday effect, large trades and small investor behaviour. Journal of Empirical Finance, 11(2), 231-246. Miller, J.A., Atkinson-Palombo, C.M., Balling, R.C. (2006), Quantifying
the ozone ‘weekend effect’ at various locations in Phoenix, Arizona. Atmospheric Environment, 40(39), 7644-7658.
Pelaez, J., Lamata, M. (2003), A new measure of consistency for positive reciprocal matrices. Computer and Mathematics with Applications, 46(12), 1839-1845.
Pettengill, G.N. (1989), Holiday closings and security returns. The Journal of Financial Research, 12(1), 57-67.
Pettengill, G.N., Jordan, B.D. (1988), A comprehensive examination of volume effects and seasonality in daily security returns. Journal of Financial Research, 11(1), 57-70.
Piccolo, D. (2010), Statistica. Bologna: Il Mulino.
Rossi, M. (2015), The efficient market hypothesis and calendar anomalies: A literature review. International Journal of Managerial and Financial Accounting, 7(3/4), 285.
Rossi, M., Fattoruso, G. (2017), The EMH and the market anomalies: An empirical analysis on Italian stock market. International Journal of Managerial and Financial Accounting, 9(3), 222-241.
Rozeff, M.S., Kinney, W.R. (1976), Capital market seasonality: The case
of stock returns. Journal of Financial Economics, 3(4), 379-402. Saaty, T.L. (1980), The Analytic Hierarchy Process. New York:
McGraw-Hill.
Saaty, T.L. (1994), How to make a decision: The analytic hierarchy process. Interfaces, 24(6), 19-43.
Saaty, T.L., Vargas, L.G. (1982), The Logic of Priorities; Applications in Business, Energy, Health, and Transportation. Boston: Kluwer-Nijhoff.
Salo, A., Hamalainen, R. (1997), On the measurement of preference in the analytic hierarchy process. Journal of Multi-Criteria Decision Analysis, 6, 309-319.
Schwert, G.W. (2003), Anomalies and market efficiency. In: Constantinides, G.M., Harris, M., Stulz, R., editors. Handbook of the Economics of Finance. Amsterdam: Elsevier Science. p939-974.
Siraj, S., Mikhailov, L., Keane, J. (2015), Contribution of individual judgments toward inconsistency in pairwise comparisons. European Journal of Operational Research, 242, 557-567.
Spronk, J., Steuer, R.E., Zoupounidis, C. (2005), Multicriteria decision analysis/aid in finance. In: Figuiera, J., Greco, S., Ehrgott, M., editors. Multiple Criteria Decision Analysis: State of the Art Surveys. New York: Springer Sciences. p799-857.
Thaler, R. (1987), Anomalies seasonal movements in security prices II: Weekend, holiday, turn of the month, and intraday effects. Journal of Economic Perspectives, 1(1), 169-177.
Ülengin, F., Ülengin, B. (1994), Forecasting foreign exchange rates: A comparative evaluation of AHP. Omega, 22(5), 505-519.
Wachtel, S.B. (1942), Certain observations on seasonal movement in stock prices. Journal of Business, 15(2), 184-193.
Wong, W.K., Agarwal, A., Wonf, N.T. (2006), The disappearing calendar anomalies in the Singapore stock market. The Lahore Journal of Economics, 11(2), 123-139.
Zopounidis, C. (1999), Multicriteria decision aid in financial management. European Journal of Operational Research, 119(2), 404-415. Zopounidis, C., Doumpos, M. (2002), Multi-criteria decision aid in
financial decision making: Methodologies and literature review. Journal of Multi-Criteria Decision Analysis, 11(4-5), 167-186. Zouponidis, C., Galariotis, E., Doumpos, M., Sarri, S., Andriosopoulos,