29 Available online at www.ijiere.com
International Journal of Innovative and Emerging
Research in Engineering
e-ISSN: 2394 - 3343 p-ISSN: 2394 - 5494
Power Quality Improvement Using D-STATCOM
Maitree Patel
P.G Student, Department of electrical engineering, S.C.E.T Engineering college, Surat, Gujarat, India.
Abstract:
The Wind Energy System is generated the Wind Power. Due to the wind energy system many power quality problems are occurred in the power system. To solve the power quality problems many FACTS devices are used. For control the FACTS devices many different control strategies are used. In this paper to solve wind connected problems D-STATCOM is used. For the control of D-STATCOM IRP method is used. Matlab simulation for this is presented in this paper.
Keywords: Power Quality, Wind Energy System (WES), D-STATCOM, Instantaneous Real and Reactive Power Theory (IRP), Battery Energy Storage System (BESS).
I. INTRODUCTION
The renewable energy resources like wind, biomass, hydro, co-generation are necessary to meet the energy need in sustainable growth and social progress. To integrate the wind energy into the power system to make it possible to minimize the environmental impact on conventional plant. Wind turbine transform the energy in the wind into the mechanical power which can be converted into the electrical power to generate the electricity [1]. These power variations are caused by the effect of turbulence, wind shear, and tower shadow. One of the simple method of running a wind energy system is to use the induction generator and it’s directly connected to the grid system. The wind energy system present a technical challenges like stability, voltage regulation, and power quality issues [2]. The power quality is affected by the operation of transmission and distribution side in the grid. The power quality issue is the most important to the wind turbine. The power quality issues such as voltage sag, voltage swell, voltage fluctuation/ voltage flicker, voltage unbalance, harmonics etc. One of the most important Power Quality Issue in grid is voltage sag (voltage dip). The voltage sag is short duration of reduction in r.m.s voltage. Its range between 10% to 90 % of nominal voltage and with duration from half a cycle to 1 min. Voltage sag caused due to a fault in the utility system, a large increase of the load current like a starting the motor or transformer energizing [3]. There are different ways to mitigate the power quality issue in transmission and distribution system. A wide range of very flexible controllers like power electronics components are emerging for custom power application [4]. The Distribution Static Compensator (D-STATCOM) are most effective device based on Voltage Source Converter (VSC). STATCOM is usually used in transmission system while D-STATCOM is used in distribution system however it’s called as the Distribution Static Compensator (STATCOM). STATCOM is utilizes power electronics to solve many power quality issues by distributed system. D-STATCOM used to improve the voltage regulation, load balancing, power factor correction and harmonics etc. D-D-STATCOM and STATCOM are used to different control strategy. The use of STATCOM is wide and its control strategy is mature wherever the introduction of D-STATCOM is seldom reported. Many control techniques such as Instantaneous Real and Reactive Power Theory (IRP) from H. Akagi and power balance theory etc. There is Instantaneous Real & Reactive Power Theory (IRP) are used. To obtained the gating pulses for the Insulated Gate Bipolar Transistor (IGBT) devices used in Current Controlled Voltage Source Converter (CC-VSC) working as D-STATCOM. The control scheme of D-STATCOM with connected wind energy system is simulated using MATLAB/SIMULINK.
II. POWER QUALITY STANDARDS &ISSUES
A) International Electro Technical Commission Guidelines:
The International standards are developed by the working group of Technical Committee-88 of the International Electro-technical Commission (IEC), IEC standard 61400-21, describes the procedure for determining the wind turbine power quality characteristics [5].
The standard are as follow.
30 power quality characteristic.
2) IEC 61400-3-7: Assessment of emission limit for fluctuating load. 3) IEC 61400-12: Wind Turbine performance.
4) IEC 61400-13: Wind Turbine—measuring procedure in determining the power behavior.
B) Voltage Variation:
The voltage variation issues results from the wind velocity and generator torque. The voltage variation is directly related to real and reactive power variation. The voltage variation is commonly classified as [6]:
Voltage Sag
Voltage Swell
Voltage Flicker/ Voltage Fluctuation
Voltage Unbalance
C) Harmonics:
The harmonic generates due to the operation of power electronic converters or non-linear load. The harmonic voltage and current should be limited to the acceptable level at the point of wind turbine connection to the network. The harmonic voltage within limit, each source of harmonic current can allow only a limited contribution. The rapid switching gives a large reduction in lower order harmonic current compared to the line commutated converter, but the output current will have high frequency current and can be easily filter-out [6].
D) Wind Turbine Location in Power System:
To connecting the wind energy system into the power system highly influences the power quality. Thus the operation and its influences on power system depend on the structure of the adjoining power network [6].
E) Self-Excitation of Wind Turbine Generating System
The self-excitation of wind Energy system (WES) with an asynchronous generator takes place after disconnection of wind Energy system with non- linear load. The risk of self-excitation arises especially when WES is equipped with Voltage Programmable Source. This block are only constant voltage block. The voltage block connected to induction generator provides reactive power compensation. However the voltage and frequency are determined by the balancing of the system. The disadvantages of the self-excitation are the safety aspect and balance between real and reactive power [6].
III. GRID CO-ORDINATE RULE. 1) Voltage Sag
RMS reduction in the AC voltage at power frequency from half of a cycle to a few seconds duration and this is caused due to short circuit, starting of inductive load or overload etc. Voltage sag happen when the RMS voltage decrease between 10% to 90% of nominal voltage for one half cycle to one minute. The voltage sag happen due to such as line-to-ground fault occurs, electric motor draws more current when they start, lightning, falling of object in power line, sudden load changes etc.[7]
𝐝 = 𝐊𝐮 𝐒𝐧
𝐒𝐤 … (1) Where,
d is relative voltage change, Snis rated apparent power,
Sk is short circuit apparent power, Kuis sudden voltage reduction factor. The acceptable voltage sag limiting value is 3 %.
2) Voltage swells
Voltage swell is defined as increase in RMS voltage level to 110-180% of nominal, at power frequency for duration of ½ cycles to 1 min. This is caused due to the sudden power outages, shut down of heavy rating motor, load shed, etc. The voltage swell at the point of common coupling can be approximated as a function of maximum apparent power𝑆𝑚𝑎𝑥of the turbine, the grid impedance R and X at the point of common coupling and the phase angle Φ [7],
∆𝒖 = 𝑺𝒎𝒂𝒙 (𝑹 𝐜𝐨𝐬 ∅−𝑿 𝐬𝐢𝐧 ∅)
𝑼𝟐 … (2) Where,
∆𝑢 = voltage swell
𝑆𝑚𝑎𝑥 = maximum apparent power Φ = phase difference
31 The limiting voltage swell value is 2 %.
3) Voltage fluctuations/Voltage Flicker
Voltage fluctuation is the voltage fall in between 0.1 - 0.7 % of nominal voltage with frequency less than 24Hz. It is also called as “flicker”. It is caused due to some of the loads such as [8],
Electric arc furnace
Cyclo converter
Large rating motor (While starting)
Static frequency converter
Rolling mill drivers
Main winders
Welders
Boilers
𝐏𝐥𝐭= 𝐂(𝛙𝐤) 𝐒𝐧 𝐒𝐤
… (𝟑)
Where,
𝑃𝑙𝑡 = Long term flicker
𝐶(𝜓𝑘) = Flicker coefficient from Rayleigh distribution of the wind speed The limiting value for Flicker coefficient is about ≤ 0.4 for average time of 2 h.
4) Voltage Unbalance
Voltage unbalance is defined as the ratio of negative or zero sequence component to positive sequence component. It is the voltage variation in power system such that the voltage magnitude or phase angle difference between them is not equal. Whenever the voltage unbalance occurs, it creates problems to poly phase motors.[7]
5) Total Harmonic Distortion (THD):
The total harmonic distortion is defined as that of all the frequencies that occur on an electrical power system are not integer multiplies of the fundamental frequency as are harmonic. Frequency that involved in this is less than that of fundamental frequency [9].
𝑽𝑻𝑯𝑫= √∑ 𝑽𝒏𝟐 𝑽𝟏 𝟒𝟎
𝒉=𝟐 𝟏𝟎𝟎 … (4) Where,
𝑉𝑛 is the nth harmonic voltage and 𝑉1is the fundamental frequency (50) Hz. The THD limit for 132 KV is 3%.
𝑰𝑻𝑯𝑫= √∑ 𝑰𝒏 𝑰𝟏 𝟒𝟎
𝒉=𝟐 𝟏𝟎𝟎 … (5) Where,
𝐼𝑛is the nth harmonic current and 𝐼1is the fundamental frequency (50) Hz.
The THD of current and limit for 132 KV is 2.5 %.
IV. TOPOLOGY FOR POWER QUALITY IMPROVEMENT
32 Fig. 1 Grid connected system for power quality improvement [10]
A) Wind Energy System (WES)
Wind generations are based on constant speed topologies with pitch control turbine. The induction generator is used in the proposed scheme because of its simplicity, it does not require a separate field circuit, it can accept constant and variables loads, and has natural protection against short circuit. The available power of wind energy system is presented as under eq.5,[10]
𝑷𝒘𝒊𝒏𝒅= 𝟏
𝟐𝝆𝑨𝑽𝒘𝒊𝒏𝒅
𝟑 … (5) Where,
𝜌 (kg/m) is the air density and
A (m) is the area swept out by turbine blade, 𝑉𝑤𝑖𝑛𝑑is the wind speed in m/s.
It is not possible to extract all kinetic energy of wind, thus it extract a fraction of power in wind called power coefficient 𝐶𝑝 of the wind turbine and is given in eq.6,
𝐏𝐦𝐞𝐜𝐡= 𝐂𝐩𝐏𝐰𝐢𝐧𝐝 … (𝟔) Where 𝐶𝑝 is the power coefficient, its depends on type and operating condition of wind turbine. This coefficient can be express as a function of tip speed ratio λ and pitch angle θ. The mechanical power produce by wind turbine is given in eq.7,
𝑷𝒎𝒆𝒄𝒉 = 𝟏 𝟐𝝆 𝝅 𝑹
𝟐𝑽 𝒘𝒊𝒏𝒅
𝟑 𝑪
𝒑 … (7) Where R is the radius of the blade (m).
B) BESS-D-STATCOM
The battery energy storage system (BESS) is used as an energy storage element for the purpose of voltage regulation. The BESS will naturally maintain dc capacitor voltage constant and is best suited in D-STATCOM since it rapidly injects or absorbed reactive power to stabilize the grid system. When power fluctuation occurs in the system, the BESS can be used to level the power fluctuation by charging and discharging operation. The battery is connected in parallel to the dc capacitor of D-STATCOM. The D-STATCOM is a three-phase voltage source converter having the capacitance on its DC link and connected at the point of common coupling (PCC). The D-STATCOM injects a compensating current of variable magnitude and frequency component at the bus of common coupling [11-15].
C) System Operation
33 generator and to the nonlinear load in the grid system. The main block diagram of the system operational scheme is shown in Fig. 2 [16].
Fig.2. System operational scheme in grid system [16]
V. CONTROL SCHEME
A. Instantaneous Real & Reactive Power Theory (IRP) :
Instantaneous P-Q Theory was initially proposed by Akagi [17]. This theory is based on the transformation of three phase quantities to two phase quantities in α-β frame and the Instantaneous active and reactive power is calculated in this frame. Sensed inputs (𝑉𝑠𝑎, 𝑉𝑠𝑏,𝑉𝑠𝑐) &(𝑖𝐿𝑎, 𝑖𝐿𝑏, 𝑖𝐿𝑐)are fed to the controller and these quantities are processed to generate reference currents (𝑖𝑠𝑎∗ , 𝑖𝑠𝑏∗ , 𝑖𝑠𝑐∗ ) which are fed to a hysteresis based PWM current controller to generate switching pulses(g1,g2and g3) for D-STATCOM.
abc/αβ
abc/αβ
Power calculation
I_αβ
V_αβ
LPF
p
p
q -1
αβ Current calculation
IC_abc* -q
αβ/abc
-p+p_loss P_loss
Fig.3. Control block diagram of instantaneous Real & Reactive power theory (IRP) [17] These phases can be transformed into α-β coordinates using Clarke’s transformation as follows.
[𝐕𝐕𝛂 𝛃] = √
𝟐 𝟑[
𝟏 −𝟏⁄𝟐 −𝟏⁄𝟐
𝟎 √𝟑⁄𝟐 −√𝟑⁄𝟐] [ 𝐕𝐚 𝐕𝐛 𝐕𝐜
34 [𝐢𝐢𝛂 𝛃] = √ 𝟐 𝟑[ 𝟏 −𝟏⁄𝟐 −𝟏⁄𝟐 𝟎 √𝟑⁄𝟐 −√𝟑⁄𝟐] [ 𝐢𝐚 𝐢𝐛 𝐢𝐜
] … (9)
Where α and β axes are the orthogonal coordinates. Conventional instantaneous power for three phase circuit can be defined as,
𝐏 = 𝐕𝛂𝐈𝛂+ 𝐕𝛃𝐈𝛃 … (10) Where p is the conventional equation,
𝐩 = 𝐕𝐬𝐚𝐈𝐬𝐚+ 𝐕𝐬𝐛𝐈𝐬𝐛+ 𝐕𝐬𝐜𝐈𝐬𝐜 … (11) Similarly, the instantaneous reactive power is defined as,
𝐪 = 𝐕𝛃𝐈𝛂− 𝐕𝛂𝐈𝛃 … (12)
In matrix form, instantaneous real and reactive power are given as,
[𝐩𝐪] = [𝐕𝛂 𝐕𝛃 𝐕𝛃 −𝐕𝛂] [
𝐢𝛂
𝐢𝛃] … (13) The α-β currents as follows,
[𝐢𝐢𝛂 𝛃] = 𝟏 𝐕𝛂𝟐+ 𝐕𝛃𝟐[ 𝐕𝛂 −𝐕𝛃 𝐕𝛃 𝐕𝛂 ] [ 𝐩
𝐪] … (14) Instantaneous active and reactive powers p and q can be decomposed into an average (dc) component and oscillatory component,
𝐩 = 𝐩̅ + 𝐩̃ … (15) 𝒒 = 𝒒̅ + 𝒒̃ … (16)
Where 𝑝̅ and 𝑞̅ are the average dc component and 𝑝̃ and 𝑞̃ are the oscillatory (ac) component of these real and reactive instantaneous power. To calculate reference currents are to compensate the instantaneous oscillatory component of the instantaneous active and reactive power.
[𝐢𝐜𝛂 ∗ 𝐢𝐜𝛃∗ ] = 𝟏 𝐕𝛂𝟐+ 𝐕𝛃𝟐 [𝐕𝛂 −𝐕𝛃 𝐕𝛃 𝐕𝛂] [ −𝐩̃ + 𝐩̅̅̅̅̅̅𝐥𝐨𝐬𝐬
−𝐪 ] … (17) The oscillatory part of real power p and reactive power q is obtained by using 4th order low pass Butterworth filter of cut-off frequency 45 Hz. These currents can be transformed into abc quantities to find reference currents in a-b-c coordinates using reverse Clarke’s transformation.
[ 𝐢𝐂𝐚∗ 𝐢𝐂𝐛∗ 𝐢𝐂𝐜∗ ] = √𝟐 𝟑 [ 𝟏 𝟎 −𝟏 𝟐 ⁄ √𝟑⁄𝟐 −𝟏 𝟐 ⁄ −√𝟑⁄ ]𝟐 [𝐢𝐂𝐚 ∗ 𝐢𝐂𝐛∗ ] … (18) SYSTEM PERFORMANCE
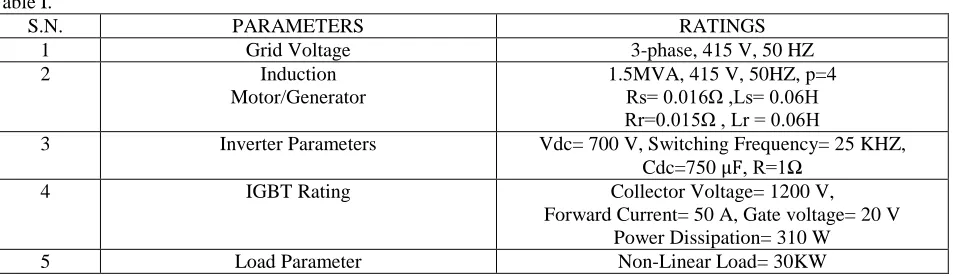
The proposed control scheme is simulated using SIMULINK in power system block set. The system parameter is given in Table I.
S.N. PARAMETERS RATINGS
1 Grid Voltage 3-phase, 415 V, 50 HZ
2 Induction
Motor/Generator
1.5MVA, 415 V, 50HZ, p=4 Rs= 0.016Ω ,Ls= 0.06H Rr=0.015Ω , Lr = 0.06H
3 Inverter Parameters Vdc= 700 V, Switching Frequency= 25 KHZ,
Cdc=750 µF, R=1Ω
4 IGBT Rating Collector Voltage= 1200 V,
Forward Current= 50 A, Gate voltage= 20 V Power Dissipation= 310 W
5 Load Parameter Non-Linear Load= 30KW
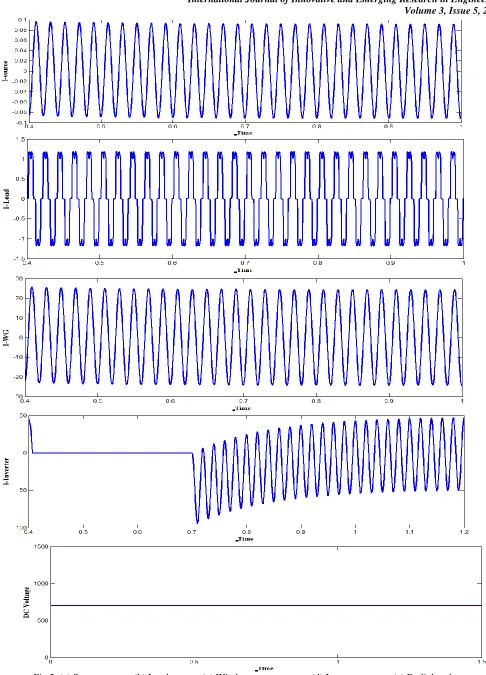
(I) D-STATCOM performance
35 harmonic current. Thus, D-STATCOM can regulate the available real power from source. The result of source current, load current are shown in Fig. 5(a) and (b) respectively. The generated current from wind generator at PCC are shown in Fig. 5(c) and while the result of injected current from D-STATCOM are depicted in Fig. 5(d).The DC link voltage regulates the source current in the grid system, so the DC link voltage is maintained constant across the capacitor as shown in Fig. 5(e).
(II) Power Quality Improvement
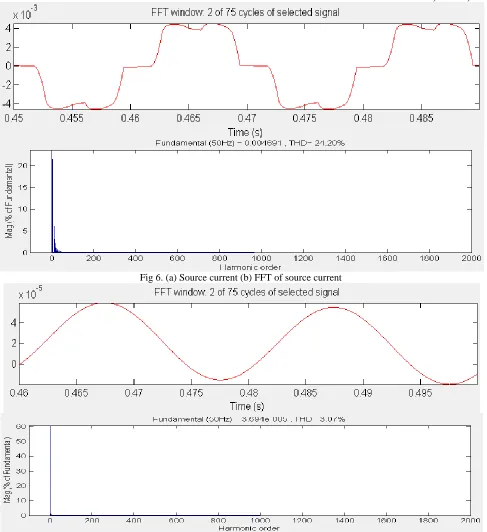
It is observed that the source current on the grid is affected due to the effects of nonlinear load and wind energy system, thus purity of waveform may be lost on both sides in the system. The converter output voltage under D-STATCOM operation. The dynamic load does affect the converter output voltage. This shows that the unity power factor is maintained for the source power when the D-STATCOM is in operation. The current waveform before and after the D-STATCOM operation is analyzed. The Fourier analysis of this waveform is expressed and the THD of this source current at PCC without D-STATCOM is 24.20%, as shown in Fig.6. The power quality improvement is observed at point of common coupling, when the controller is in ON condition. The D-STATCOM is ON in the operation at 0.7 s and source current waveform is shown in Fig. 7 with its FFT. It is shown that the THD has been reduced.. The above tests with proposed scheme has not only power quality improvement feature but it also has sustain capability to support the load with the energy storage through the batteries.
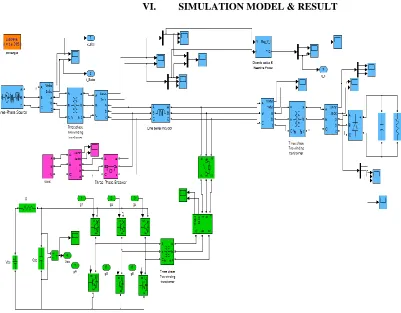
VI. SIMULATION MODEL & RESULT
37 Fig 6. (a) Source current (b) FFT of source current
Fig 7. (a) Source current (b) FFT of source current
CONCLUSION
38
REFERENCES
[1] A. E. Hammad, “Comparing the voltage source capability of present and future var compensation techniques in
transmis, July/August, PP. 682-688, 1999.ery. Volume1. No.1 Jan 1995.
[2] G. Yalienkaya, M.H.J Bollen, P.A. Crossley, “Characterization of voltage sags in industrial distribution system” ,
IEEE Trans on industry applications, volume 34, No , July/August, PP.682-688, 1999.
[3] Anaya-Lara O, Acha E., “ Modelling and analysis of Custom Power Systems by PSCAD/EMTDC “, IEEE Trans on power Delivery , Volume 17, Isuue:2002, Pages: 266-272.
[4] Haque , M.H., “ Compensation of Distribution Systems Voltage sags by DVR and D-STATCOM”, Power Tech Proceedings,2001 IEEE Porto, Volume 1, PP. 10-13, September 2001.
[5] Wind Turbine Generating System—Part 21, International standard-IEC61400-21, 2001.
[6] Yuvaraj and Dr. S.N.Deepa, “ Improving grid power quality with FACTS Devices on Integration of Wind Energy System” Student Pulse April 2011 Vol. 3, Issue 4.
[7] S. Heier, Grid Integration of Wind Energy Conversions. Hoboken, NJ: Wiley, 2007, pp. 256–259.
[8] J. J. Gutierrez, J. Ruiz, L. Leturiondo, and A. Lazkano, “Flicker measurement system for wind turbine
certification,” IEEE Trans.Instrum. Meas., vol. 58, no. 2, pp. 375–382, Feb. 2009. [9] Indian Wind Grid Code Draft report on, Jul. 2009, pp. 15–18, C-NET.
[10]Sharad W. Mohod and Mohan V. Aware, “ A-STATCOM control scheme for grid connected wind energy system for power quality improvement”, IEEE System Journal, Vol. 4,No. 3, Septe
[11]C. Han, A. Q. Huang, M. Baran, S. Bhattacharya, and W. Litzenberger, “STATCOM impact study on the
integration of a large wind farm into a weak loop power system,” IEEE Trans. Energy Conv., vol. 23, no. 1, pp. 226– 232, Mar. 2008.
[12]D. L. Yao, S. S. Choi, K. J. Tseng, and T. T. Lie, “A statistical approach to the design of a dispatchable wind power—Battery energy storage system,” IEEE Trans. Energy Conv., vol. 24, no. 4, Dec. 2009.
[13]F. Zhou, G. Joos, and C. Abhey, “Voltage stability in weak connection wind farm,” in IEEE PES Gen Meeting,2005, vol. 2, pp 1483–1488.
[14]T. Kinjo and T. Senjyu, “ Output leveling of renewable energy by electric double layer capacitor applied for energy
storage system”, IEEE Trans. Energy Conv., Vol 21, No 1, March 2006.
[15]R. S. Bhatia, S.P. Jain, D.K. Jain and B. Singh, “ Battery Energy Storage System for power conditioning of renewable energy sources”, in Proc. Int. Conf. Power Electron Drives System, Jan. 2006, Vol. 1, PP. 501-506. [16]K. Somsai and T. Kulworawanichpong , “ Instantaneous Power control of D-STATCOM with consideration of
power factor correction”, IEEE International conf. on May 2010, PP. 1186-1190.
![Fig. 1 Grid connected system for power quality improvement [10]](https://thumb-us.123doks.com/thumbv2/123dok_us/8874955.1816299/4.612.185.430.58.240/fig-grid-connected-power-quality-improvement.webp)