Flood estimation in ungauged catchment using
ENKI
simulation: A case study in Norway
Yueyang Chen
1,2, Oddbjørn Bruland
2and Tiejian Li
1,31 State Key Laboratory of Hydroscience and Engineering, Tsinghua University, Beijing 100084,
China
2 Department of Civil and Environmental Engineering, Norwegian University of Science and
Technology, Trondheim 7491, Norway
3 Sanjiangyuan Collaborative Innovation Center, Qinghai University, Xining 810016, China Corresponding author: [email protected]
Abstract
This paper deals with flood estimation in ungauged catchment using continuous rainfall-runoff model. The rainfall-runoff model used in this study is developed based on the ENKI hydrological framework. In this study, flood estimation in ungauged catchment is based on transfer of parameter values from nearby station. The catchment used in this study to test the suitability of the ENKI system in flood estimation of ungauged catchment is the Gaula catchment located in Norway. This catchment has three main sub-catchments where flow records are available. The ENKI system is calibrated for each sub-catchment. In order to test its suitability in flood estimation, the average of the parameter set obtained from any of the two sub-catchments is used in the remaining sub-catchments. The performance of the ENKI system in flood estimation is evaluated in terms of the Nash–Sutcliffe (NSE) model efficiency index and the model ability to simulate the daily observed Annual Maximum Series (AMS). The result of this study shows that the ENKI framework has considerable potential in flood estimation in ungauged catchments.
1
Introduction
Floods cause problems in many countries around the world. Floods can be very devastating natural disasters and their impacts can have great influence on economy, environment and people. Worldwide, floods account for 40% of economic losses due to natural hazards. As urban economic zones become more populated, the impacts of floods in these zones will increase substantially [1]. Flood zone mapping provides useful information that can be used by the planner to mitigate against the adverse flood impacts. The specification of flood zone requires flood estimates to be made. The purpose of
Volume 3, 2018, Pages 428–437
flood estimation is to determine the relationship between flood magnitude and return period. This information is used to develop flood zone maps for different return periods.
There are three main methods by which flood estimations can be made. These methods are event based rainfall-runoff model, regional flood frequency analysis, and continuous rainfall-runoff model [2]. In the event based rainfall-runoff model, the design rainfall storm is used in conjunction with a unit hydrograph model to produce the design flood hydrograph for a given return period. The design flood peak discharge can also be estimated using the rational method. However, the rational method is a primitive form of the unit hydrograph model.
The regional flood analysis enables flood estimates to be made at a site where there is no or short record of flow data. It is based on the development of a dimensionless regional flood frequency curve. When this dimensionless frequency curve is multiplied by the flooding index, it yields the flood estimates at a given location. The flood index is typically the mean or the median flood. The value of the flood index is normally estimated from regional equation relating the flood index to catchment properties.
The essence of flood estimation using continuous rainfall-runoff model is the generation of a long discharge time series from the rainfall-runoff model. Subsequently, the generated time series will be subjected to the usual at-site flood frequency analysis to determine the relationship between flood magnitude and return period. The application of rainfall-runoff model to a particular catchment requires the specification of the model parameter values. These parameter values are normally estimated through calibration procedure involving a comparison between the observed and the model simulated discharges. In the context of ungauged catchments where there is no recorded discharge data, these parameters can be estimated based on information transfer from nearby catchments or through the use of regional developed equations between model parameters and catchment properties.
This paper deals with flood estimation in ungauged catchment using continuous rainfall-runoff model. The rainfall-runoff model used in this study is developed based on the ENKI hydrological framework. The catchment used in this study to test the suitability of the ENKI system in flood estimation of ungauged catchment is the Gaula catchment in Norway. This catchment has three main sub-catchments where flow records are available.
This paper is organized in the following manner. Firstly, materials and methods used in this paper are described, the materials and methods section contains ENKI modelling framework, data, study area as well as the criteria used for evaluating model performance. Secondly, the results of the study are given. Thirdly, the results of the study are discussed. Finally, the conclusions rising from this study are given.
2
Material and methods
2.1 Model Introduction
appropriate for the modelling objectives. In this way, it is very powerful modelling tool than those provided by a single environmental modelling software. The framework can facilitate the development and the evaluation of hydrological models. The present ENKI software package is an open source developed under GNU LGPL. [3, 4, 5]
ENKI provides estimate for the discharge time series at a selected location, thus it is suitable for flood forecasting purposes. Likewise, the estimated discharge time series can be used in flood frequency analysis. The flood frequency analysis provides information about the relationship between the flood peak magnitude and its return period/frequency of occurrence. The information obtained from the flood frequency analysis can be utilised in the design of water infrastructure.
2.2 Study Area
Gaula River, known as one of the longest salmon rivers in Norway, which crosses the entire study region has a range of 85 km. It starts from Holtålen and drains all the way to the Sokna River in Midtre Gaudal. The climate of Gaula catchment is mainly maritime, as Norway is surrounded by two seas, namely, the Norwegian Sea and the North Sea. Due to the huge embrace by the sea mainly in the western part of the country, higher temperature and more precipitation will occur. Accordingly, there are higher probabilities that flood will occur frequently as a result of extreme precipitation and the mountainous topography [6].
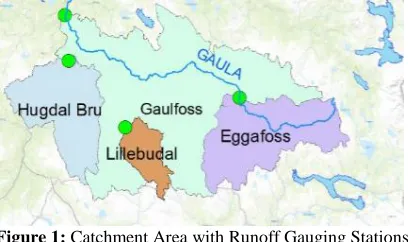
This study focuses on flood estimation in the Gaula catchment located in Norway. It is mainly located in the municipality of Sør-Trondelag with an area of 3086 km2. Figure 1 shows the location of
Gaula catchment in Norway. Based on the Norwegian Water Resources and Energy Directorate (NVE) website statistics, this catchment accounts for ca. 0.95% of the total area of Norway. There are four runoff stations inside of the catchment namely Eggafoss, Lillebudal Bru, Hugdal Bru and Gaulfoss. The Gaulfoss station is located at the catchment outlet. In the Gaula catchment, precipitation has high spatial variation due to mountainous terrain. The flood generating mechanism in the Gaula catchment is the combination of rainfall and snow melt [7].
Figure 1 below shows the map of the relative location of the catchment. The catchment has three main sub-catchments, namely, Eggafoss, Lillebudal Bru and Hugdal Bru.
Figure 1: Catchment Area with Runoff Gauging Stations
Figure 2: Catchment Basic Information
2.3 Data
The development of a daily hydrological model using the ENKI framework requires the daily information about precipitation, potential evapotranspiration and discharge. In this study, the potential evapotranspiration is calculated using the Penman equation which requires information about air temperature, wind speed, relative humidity and global radiation. The data required in this study is download from these sources, namely, NVE (https://www.nve.no), eKlima (eklima.met.no), and NIBIO (https://www.nibio.no/en).
In any modelling study, checking the quality of the data is an important step in modelling development as garbage in, produces garbage out. Accordingly, the data used in this study has been subjected to data quality control. The objective of data quality control is to identify data errors and missing data. In this study, the data quality control procedures involve the use of double mass curve, correlation analysis as well as visual inspection based on graphical plots. Data identified in the study were corrected. Likewise, missing data were filled based on information transfer from the nearby stations. Filling the missing data would enable the software package to operate on continuous basis without crashing. As the missing values are normally given alphanumeric codes or large negative number and this would cause the software package crash or produce unrealistic values. [8]
2.4 Methodology and tools
As stated in the introductory section of this paper, the main purpose of this paper is flood estimation in ungauged catchments using continuous rainfall-runoff model. The rainfall-runoff model used in this study is developed based on the ENKI hydrological framework. The catchment used in this study to test the suitability of the ENKI system in flood estimation of ungauged catchment is the Gaula catchment in Norway.
The scheme used in conjunction with the ENKI system for flood estimation in ungauged catchment is based on parameter information transfer from nearby catchments. In this study, three sub-catchments within the Gaula catchment are used to test the suitability of ENKI system in flood estimation in ungauged catchments.
The general methodology used to test the ENKI system in an ungauged catchment is based on the use of the average of the parameter set obtained from the nearby sub-catchments. This requires calibrating the ENKI model for each sub-catchment. The model is applied to each sub-catchment using a grid-cell based format. This would enable spatial information to be used. The version of the
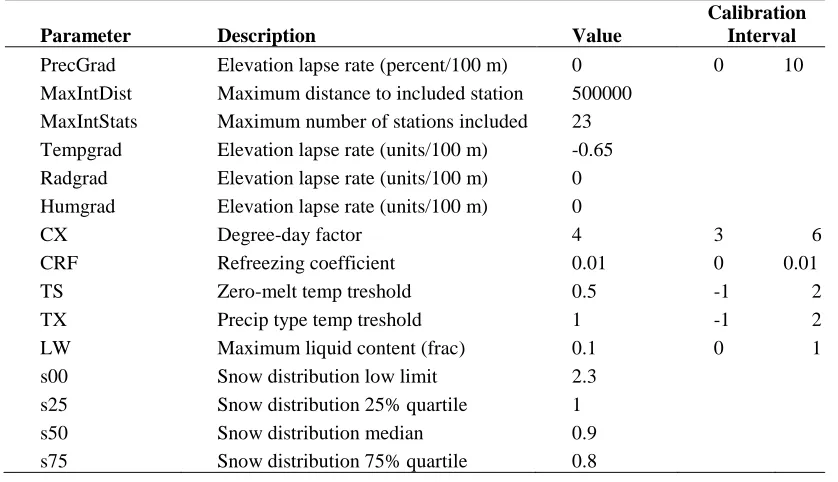
ENKI model used in this study has 19 parameters to be estimated by calibration. Table 1 shows a brief summary description of these parameters together where other variables are set to constant values.
Table 1:ENKI Parameter and Calibration Interval Values
Parameter Description Value
Calibration Interval
PrecGrad Elevation lapse rate (percent/100 m) 0 0 10 MaxIntDist Maximum distance to included station 500000
MaxIntStats Maximum number of stations included 23 Tempgrad Elevation lapse rate (units/100 m) -0.65 Radgrad Elevation lapse rate (units/100 m) 0 Humgrad Elevation lapse rate (units/100 m) 0
CX Degree-day factor 4 3 6 CRF Refreezing coefficient 0.01 0 0.01 TS Zero-melt temp treshold 0.5 -1 2 TX Precip type temp treshold 1 -1 2 LW Maximum liquid content (frac) 0.1 0 1 s00 Snow distribution low limit 2.3
s100 Snow distribution high limit 0.3 LandAlbedo Albedo of snow free surface 0.1 Ptalpha Prisley-Taylor alpha parameter 1.26
FC Field capacity 200 50 600 LP Treshold for minimum SM/FC 0.9 0.7 0.99 BETA Nonlinearity in unsaturated storage 2 1 5 K2
Outlet coefficient quick outflow upper
tank 0.3 0.1 0.6
K1
Outlet coefficient slow outflow upper
tank 0.1 0.01 0.15
K0 Outlet coefficient outflow lower tank 0.05 0.01 0.1 Perc
Percolation rate from upper to lower
tank 0.6 0.5 5
Tresh
Threshold height for fast outflow in
upper tank 20 10 60
Lakep Lake portion of catchment (0 - 1) 0.02
Rcorr Bias correction factor for rain 1.05 1.05 1.2 Scorr Bias correction factor for snow 1.2 1.15 1.5 The ENKI system has a number of algorithms to perform calibration and sensitivity analysis. These algorithms include PEST (multi-surface gradient search using Jacobian matrix), SCE-UA (global shuffled complex evolution), Random MC (GLUE), DREAM MCMC (adaptive metropolis sampler) and Conditional Univariate. In this study, the SCE-UA (global shuffled complex evolution) and Random MC (GLUE) are used for calibration and sensitivity analysis. These two algorithms are widely used in practical applications. [9] In this study, a sequential optimization procedure is used for model calibration. In this procedure, the final optimum parameters set obtained from a probabilistic global research procedure based on random sampling is used as a starting parameter set for the global shuffled complex evolution. The use of such sequential optimization procedure would enhance the chance of getting the best possible results.
The calibration process requires the specification of the objective functions to be minimized or maximized. In this study, the least squared function based on the minimization of the sum squares of the differences between the observed and the model estimated discharge is used. The least squared function is the most widely used in the hydrological applications and has links to model evaluation indices. [10]
2.5 Evaluation of Model Performance
where Qo is the observed discharge, Q0 is the average discharge during the calibration period, Qs is
the model simulated discharge.
In the context of the NSE index, the naïve model used is that model which has the mean discharge of the calibration period as its output all the times. The NSE index values can range between −∞ to 1. If the model is perfect, the NSE index value would be 1. When the value of the NSE index value is negative, this means that the performance of the substantive model is worse than that of the naïve model.
3
Results
In this study, 11 years of daily data covering the period from 1999 to 2010 is used. The model development also requires the specifications of the warm-up period. This period is normally discarded from the calculation of model performance as it is used to compensate for the effects on modelling result due to the unknown initial conditions at the start of the model run. In this study, the warm-up period is taken as 1 year based on the modelling experience in Norway [Teklu T. Hailegeorgis].
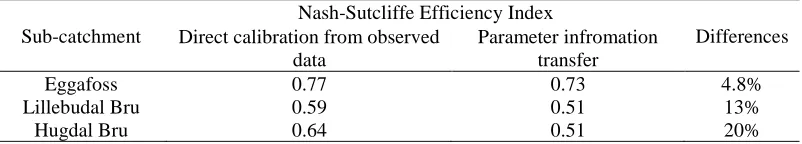
The performance of the distributed model developed in this study is evaluated at the using the NSE index. Table 2 shows the NSE index values from the three sub-catchments. Examination of the table shows that the NSE index values vary between 0.59 to 0.77. The highest NSE value is obtained in the case of Eggafoss sub-catchment which is located at the upper part of the catchment. The lowest NSE value is obtained in the case of Lillebudal Bru sub-catchment located in the lower part of the catchment.
Table 2 also shows the NSE index values for the three sub-catchments where the parameters are obtained through information transfer from the nearby catchments. Inspection of the table shows that the NSE index value is between 0.51 to 0.73. The highest NSE value is obtained in the case of Eggafoss sub-catchment which is located at the upper part of the catchment. However, in the case of the two remaining sub-catchments, the model has similar performance with an NSE index value of 0.51.
Table 2: Nash-Sutcliffe Efficiency Index Values Sub-catchment
Nash-Sutcliffe Efficiency Index
Differences Direct calibration from observed
data
Parameter infromation transfer
Eggafoss 0.77 0.73 4.8%
Figure 4: Eggafoss – Observed Flow v.s. Simulated Flow
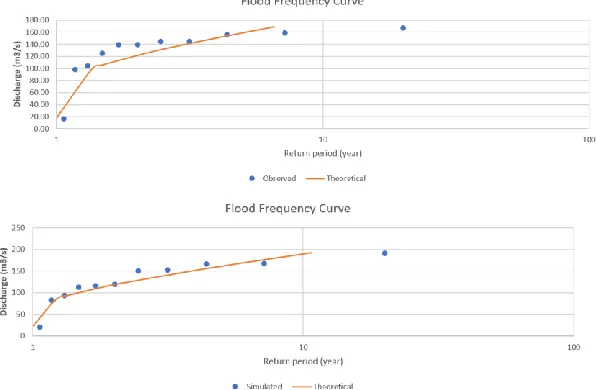
Gumbel distribution probability plot for Eggafoss is shown in Figure 5 to illustrate how the observed flow and simulation flow match the theoretical distribution for a flood event with a return period of 10 years.
the figures reveals that the distributed model has some poor NSE index values. Considerable efforts have been made to improve the model performance using automatic and manual calibration incorporating the sensitivity analysis. However, these efforts did not result in a significant improvement in model performance. There are various plausible reasons for this poor model performance. It may well be that there are issues with data quality in terms of spatial and temporal resolution. During the course of the study, it has been found that the data has substantial amount of missing values. Different techniques have been used to fill the missing data. Such a process of the filling of missing data increases the level of data uncertainty. It is also plausible that the model structure is not adequate for small catchments. The model may require further refinement in order to suit the conditions of small catchment such as those used in the present study. The poor model performance may also be the result of the failure of the calibration procedure identify the global optimum parameter set.
In general, it has been observed that the best model results can be obtained in the case of the upper stream sub-catchment where there may be very little land use changes. Table 2 shows the percentage of the difference in model performance when using two different parameter sets. The first parameter set is obtained from direct model calibration using the observed discharge hydrograph. For a particular sub-catchment, the second parameter set is obtained from the information transfer from the other two sub-catchments. This parameter set is basically the average parameter set of the other two sub-catchments. Examination of the table shows that the percentage of the difference in model performance vary between 4.8% to 20%. The highest percentage difference is obtained in Hugdal Bru catchment. While the lowest percentage difference is obtained in the case of Eggafoss sub-catchment. The percentage of the model performance in the case of Lillebudal Bru sub-catchment and the Eggafoss sub-catchment can be regarded as acceptable for practical purpose.
5
Conclusions
In this study, a distributed hydrological model based on ENKI framework is developed for the Gaula catchment in Norway. The purpose of this paper is to test the suitability of the ENKI framework in flood estimation in three sub-catchments within the Gaula catchment. The result of the study shows that the ENKI framework can yield good results in terms of reproducing the observed flood hydrograph. When the ENKI framework is used as a tool for flood estimation in ungauged catchments, the result of the study shows that it has considerable potential. In future study, the work should focus on improving model results through improving the resolution of the spatial data as well as model calibration. Also, future work should aim at increasing the number of catchments to be used in estimating the model parameters in ungauged catchments.
Based on Gumbel Distribution Probability plot, the result of the study shows that the distributed model produces good performance in terms of simulating the relationship between the flood magnitude and the return period. Overall, the model performance is not that satisfactory based on the NSE criteria. In some cases, the NSE values in some sub-catchments are low.
Reference
[1] Changnon Jr, Stanley A. "Climate fluctuations and impacts: The Illinois case." Bulletin of the American Meteorological Society 66.2: 142-151,1985.
[3] Kolberg, Sjur, and Oddbjørn Bruland. "An Open Source modular platform for hydrological model implementation." EGU General Assembly Conference Abstracts. Vol. 12. 2010.
[4] Kolberg, Sjur, and Oddbjørn Bruland. "The Open Source module framework ENKI." EGU, 2012.
https://presentations.copernicus.org/EGU2012-13630_presentation.pdf
[5] John F. Burkhart and Kolberg, Sjur. "Open Source ENKI: Dynamic Environmental Model Framework." European Fully Coupled Atmospheric-Hydrological modelling and WRF-Hydro Users workshop, 2014.
http://cesmma.unical.it/wrf-hydro2014/pdf/Burkhart_ENKI-WRF.pdf [6] https://en.wikipedia.org/wiki/Norway
[7] Killingtveit, A. "Flood regimes and flood prevention in Norway: Lessons learnt from the 1995 flood." Recent trends of floods and their preventive measures, 1996.
[8] Rinde, T. “Data acquisition and quality control.“ Institutt for vann og miljøteknikk. 2013a. [9] Yang, Jing, et al. "Comparing uncertainty analysis techniques for a SWAT application to the Chaohe Basin in China." Journal of Hydrology 358.1-2 (2008): 1-23.
[10] Gupta, Hoshin V., et al. "Decomposition of the mean squared error and NSE performance criteria: Implications for improving hydrological modelling." Journal of Hydrology 377.1-2 (2009): 80-91.
[11] Yang, Ying Nan, et al. "Integrated qualitative and quantitative methodology to assess validity and credibility of models for bridge maintenance management system development." Journal of Management in Engineering 27.3 (2010): 149-158.
[12] Krause, Peter, D. P. Boyle, and Frank Bäse. "Comparison of different efficiency criteria for hydrological model assessment." Advances in geosciences 5 (2005): 89-97.