Iranian Journal of Economic Studies
Journal homepage: ijes.shirazu.ac.ir
Prediction-Based Portfolio Optimization Model for Iran’s Oil-Dependent Stocks Using Data Mining Methods
Mohammad Sayadi∗, Meysam Omidi Faculty of Economics, Kharazmi University, Tehran, Iran. Article History Abstract
Received date: 20 July 2019 Revised date:29 January 2020 Accepted date: 01 February 2020 Available online: 02 March 2020
This study applied a prediction-based portfolio optimization model to explore the results of portfolio predicament in the Tehran Stock Exchange. To this aim, first, the data mining approach was used to predict the petroleum products and chemical industry using clustering stock market data. Then, some effective factors, such as crude oil price, exchange rate, global interest rate, gold price, and S&P 500 index, were used to estimate each industry index using Radial Basis Function and Multi-Layer Perceptron neural networks. Finally, by comparing the validation ratios in a bullish market using K-Means, SOM, and Fuzzy C-means clustering algorithms, the best algorithm was employed to predict indicators for each industry. The sample was collected between December 15, 2008, and April 25, 2018. The results revealed that the Multi-Layer Perceptron algorithm had the highest accuracy and was the best option for portfolio predicament. However, the Fuzzy C-means algorithm produced the best clusters. Practical results showed that Sepahan oil and Kharg petrochemical stocks were the most important stocks in the short term while Kharg petrochemical, Fannavaran petrochemical, and Tehran oil refinery stocks made higher contributions in a stock portfolio in the medium- or long-term. JEL Classification:
C38 C45 G11
Keywords: Stock Index
Portfolio Optimization Data Mining
Artificial Neural Networks Clustering
Tehran Stock Exchange
1. Introduction
The special importance of the stock exchange market for economic development in many countries is materialized through the management and optimal allocation of resources. Capital investment requires a decision-making process that needs to be informed by the information obtained about the changes taking place in the stock market. Therefore, if the process of changes in the market trends is investigated using appropriate methods and the results are utilized in forecasting these changes, the investor can predict the amount of return on investment and this can lead to development in the stock market. One of the most popular financial markets to invest in is the stock market or stock exchange, depending on the number of assets they hold. The stock exchange in each country is the most important mechanism to attract and reallocate optimally
∗[email protected]
the resources and small savings to individuals. The main role of the stock exchange is to direct liquidity, rescue savings, and finance the economy by promoting the private sector. This market allows individuals to participate in expanding industries and earning more from their capital.
A difficult decision for investors to make is how to choose the right shares and manage their portfolio when there are not many cut-and-dried criteria that can be used to compare different stocks. A clear and trustful method for portfolio predicament that can be applied by experts is to make the investors more confident and ensure them that they can gain more interest (Huang, 2012). Many factors affect the stock flow resources; these factors include macroeconomic policy and goals, the general economic situation of a country, aggregate price level, trading rates in the banking system, investor’s assumptions, the development outlooks for other stock markets, and even the psychology of investors (Miao et al., 2007).
A great body of research conducted on the stock markets in developed or emerging economies shows that stock returns vary depending on the macroeconomic variables. Therefore, it is expected that the total stock index (the index of different groups of the stock exchange) will have a strong correlation with the changes in macroeconomic variables. This is because the value of the profit and the return on the equity determine the actual value of the stock although this value is distributed in a way that is separate from the performance of a firm (since the price cut of the stock is determined outside the company). Thus, profits and values are clearly affected. Investors and market analysts predict market employing technical measurements. Various technical ratios have been employed to analyze the value of the stock market. The stock index is derived from the price of stocks; it provides an overview of the economic situation and relies on various factors (Patel et al., 2015). Due to the importance of the chemical and petrochemical industries in the Tehran Exchange Market (TSE), the current article focused on these sectors.
Based on the data released from the Tehran Stock Exchange (TSE) in 2018, chemical and petrochemical industries covered about 30% of the total value of the market (TSE, 2018). Thus, any changes in the key factors can have impressive effects on the total value of the stock market. In other words, since more than 70% of non-oil exports are attributed to chemical and petrochemical products, these are major sources of foreign exchange and essential for the Iranian economic growth in many aspects. Therefore, these industries can have a significant effect on an investor’s decision-making and that is why studying them is of great significance. This article was aimed to address this issue in detail. In analyzing this issue using the proper methodology, the researchers hoped that the outcome would bridge the distance between academia and policymakers.
such as petrochemical companies, attracted investors to the capital market. However, the main reason for such heightened interest among investors was the rise in the price of the exchange rate. That is to say, the growth in the capital market was fueled by petrochemical companies. Some researchers believed that such an appetite for investing could improve the Iranian capital and financial markets greatly and that the new economic situation could pave the way for the development of macroeconomic policies aimed to control the exchange rate and inflation. Therefore, the key question at the time was how investors could optimize their stock portfolio by including petrochemical companies and how the optimization would vary according to different time scales. Highlighting the importance of petrochemical companies in TSE, Figure 1 shows the share of the top ten major industries for December 2018.
Figure. 1. The market capitalization of the top industries in the Tehran Stock Exchange (December 2018).
Source:Statistic and Information, Ministry of Industry, Mining, and Trade (2018).
Ministry of Industry, Mining, and Trade (2018) clearly showed that among the products exported, the ’Material and Chemical Products’ ranked first with an export value amounting to more than USD 6 billion, followed by ‘coke and oil products’ with an export value exceeding USD 4 billion. In addition ‘basic metals’ export value amounted to USD 3.2 billion. With the rise in the return of the stock market, especially for the petrochemical and chemical-related stocks, it was obvious that the demand for these stocks would stand at the top of the list of total demand in the capital market. Policymakers believe that determining the exchange rate in the free market will attract more investors toward the capital market and they will invest more in the export-oriented petrochemical industry. This article contributes to this area of interest by showing how investors can optimize and allocate their stocks in sub-companies within the petrochemical category to gain the highest return for their portfolios.
Stock prices are affected by two distinct factors. One is macro factors, such as economic growth, inflation rate, interest rate, exchange rate, oil price; the second category is micro factors, such as profit sharing, corporate programs, etc, which are related to the internal issues of corporations and institutions. Stock prices and corporate stock returns are influenced by various internal factors or economic, psychological, political, and other factors that can affect the stock price of companies. Therefore, identifying the effects of macroeconomic variables and factors which affect stock returns can help investors to plan for the future (Blair et al., 2002).
Some of these factors are internal and some other ones are associated with the variables outside the scope of the domestic economy. Accordingly, the factors affecting the stock price can be classified into internal and external factors (Ibid).
Internal factors include the factors that influence the stock price and affect a company’s operations and decisions. In this research, internal factors are used for stock clustering. External factors include factors that are outside the scope of a company’s management and control but affect the performance of the company in some way. These factors are the events and decisions outside the company that affect the stock price. In general, these factors can be divided into two sub-sections as follows:
A) Political factors such as war, peace, disruption of political and economic ties with other countries, changes in political institutions, and the emergence of rival political parties;
Interest rates are one of the most reliable predictors of stock returns (Rapach et al., 2005) and money market return, as a competitor for the stock market (Mashayekh et al., 2011), across and between countries.
In recent years, due to the high profitability and risk-avoidance feature, the role of the gold market in encouraging people to invest more has increased. As a result, several studies have been carried out to explore the relationship between the gold yield and the stock market. For instance, Baryshevsky (2004) showed that the yield of gold (10-year average) had a high negative correlation with the return of the real stock market.
In the Tehran Stock Exchange, in addition to the total stock index which reflects the overall market situation, each industry also has an index indicating the performance existing companies operating in that industry. In this research, we aimed to predict the index of two petroleum products and chemical products.
Although different methods have already been applied for portfolio predicament and optimization in the literature, it is hoped that the present article will contribute to the literature by filling gaps in it regarding the modeling. More specifically, this article comprises two parts. In the first part, a prediction index is introduced using a neural networks portfolio optimization model. In the second part, a clustering method is developed to identify the optimum portfolio. There are various techniques for constructing an index which vary according to the time series econometrics. Classic statistical models, which consist of MA, ARIMA model, and exponential smoothing techniques, are used to create a linear index. Artificial neural network (ANN) is also another algorithm that is broadly used to forecast the stock price movements and values (Bollerslev, 1986; Zhang & Wu, 2009). Network models allow a better understanding of the economic phenomena.
To this end, different clustering techniques, namely, self-organizing maps (SOM), K-means, and Fuzzy C-means, and the validation ratios were used. In terms of the scope of the study, we explored the information pertinent to two industries, i.e. petroleum products and chemical products, which had a high value in Iran’s capital market. In so doing, it was hoped that a picture of the future of these two industries could be predicted with minimal risk but maximum returns. Since this study was an attempt to improve the applicable and methodological aspects concerned with it and the studies of its ilk, different issues need to be highlighted.
Specifically, this article will address the following questions:
- How will the oil-dependent stock groups perform in the TSE market? - Which companies will yield the highest return and what would be the
optimal portfolio in the short-, medium- and long-run?
- How would the results of the clustering algorithm differ between K-means, SOM, and Fuzzy c-means?
The remainder of this research is organized as follows. The relevant literature is discussed in Section 2. The methodological framework and clustering-based stock selection methods are discussed in section 3. Section 4 depicts the empirical results and, finally, in section 5, some conclusions are made and some applicable policy implications are offered for policymakers and investors in the stock market.
2. Literature Review
The expansion and accessibility of the data sources, especially in financial markets, encouraged the researchers to use a variety of methods for data analysis and mining. Also, the managers of investment companies and shareholders benefited from this data analysis in the market. Although there is a huge body of literature corresponding to the financial market analysis, reviewing all of the relevant studies conducted is out of the scope of this article. This section, thus, reviews only the literature on stock market prediction and clustering techniques for portfolio management.
2.1 Review the Literature on Stock Market Prediction
The study done by Schwartz and Whitcomb (1977) can be cited as a pioneer study on predicting the stock market using IBM's daily price data. Their results showed that neural networks had the capabilities to identify the nonlinear patterns depending on time series. Their findings also indicated that there were some changes in the stock and asset price caused by unknown rules. Following this study, the finance-based studies broadly used neural networks. For instance, Chiang et al., (1996).
Used the data from investing companies with regard to net asset price variables and compared the results obtained from a back propagation network and the traditional econometric method. The results revealed that the neural network forecasted the asset price more effectively than did the traditional econometric method. By applying a new forecasting approach, Chen and Leung (2004) mixed the effects of neural network and multivariate time series model and employed the results to predict the exchange rate in the UK, USA, and Japan. A number of statistical criteria are used to compare the performance of two-stage models with that of single-stage models. The results indicate that the proposed hybrid approach, compared to the single-stage models, can not only lead to the best forecast of the exchange rate but also result in higher investment returns.
methods. They concluded that the traditional methods were less accurate than the intelligent-based methods. Kanjamapornkul et al. (2016) developed a new technique to analyze and predict the financial markets and time series. They examined the importance of portfolio selection and the multi-string system and how the stability of algorithms would affect the transaction costs in the long-run. Results The results indicated the separation of the network into two clusters and some isolated nodes. They also stated that the plot for the closeness centrality of the algorithm for IMF7 was the best means for identifying market crash. Applying the artificial neural network, Misiunas et al. (2016) employed the system of adaptive neuro-fuzzy inference and used the data from 2004 to 2012 to classify the daily forecast for the stock return for the specified period. The results of DEANN showed that while the size of the training dataset could be reduced significantly, the accuracy of the ANN could be maintained.
In an empirical assessment of high-utility itemset mining (HUIM) algorithms, Zhang et al. (2018) understood that the HUIM had appeared as a main research topic in data mining. They presented an empirical evaluation of 10 major HUIM algorithms in their study. Their results suggested that d2HUP and EFIM were generally the top two performers in the running time.
Gandhmal and Kumar (2019) presented a comprehensive review of 50 studies which had used different methodologies, including Fuzzy classifier, Bayesian model, SVM classifier, NN, ANN, and Machine Learning Methods, to predict the stock market. They added that the main challenge facing the prediction of the stock price systems was that most of the mentioned techniques could not utilize the historical stock data as they are affected by only certain factors. Their findings indicated that due to the complexities involved in the prediction of the stock market, different factors must be considered if the future of the stock market is to be forecast more efficiently and accurately.
2.2 Review of the Literature on Clustering Techniques for Portfolio Management
Clustering and detailed classification methods were applied in more detail by Zhong (2004) and Zhong et al. (2001). It was proved that these forecasting methods could lead to the most precise forecast and predict the index value or stock price most accurately. The investors can achieve high profits following the results obtained from forecasting strategies. Using panel data of the exchange rate for three currencies accompanied by time series prediction with multi-layer perception, Galeshchuk (2016) predicted the daily, monthly, and quarterly trends with the neural networks. Finally, the best neural network was selected based on its power of forecasting. The findings indicated that the short-term prediction method maintained good prediction accuracy and could be employed in any practical system to predict the exchange rate.
the mean quadratic error, its standard deviation, and the structural error in SOM were smaller than those of the k-means technique. Moreover, the results indicated that in the last stages of its training procedure, the SOM algorithms were the same as the k-means algorithm. Liao and Chou (2013) applied clustering algorithms and association rules to investigate the co-movement in China (Hong Kong) and Taiwan stock market. They classified the stock indices into thirty clusters to explore the association between the stock indices. Durante and Foscolo (2013) employed an index to evaluate the contagion effects among various markets. They utilized crisp and fuzzy clustering methods on the dissimilarity matrix. They devised a clustering of the indices of the European stock market to estimate their trends. As an empirical application, the proposed index was applied to set a clustering for the market indices of the European stock to investigate their behavior in recent years.
Nair et al. (2017) created self-organizing maps and regression tree approaches. Furthermore, the authors used these techniques to create temporal clusters and applied them to create trading recommendations. Choosing the US, UK, India, and Brazil stock markets, they evaluated 16 recommender system variants. The proposed recommenders generated recommendations for doing a profitable trade. Nanda et al. (2010) compared three clustering algorithms, namely, K-means, SOM, and Fuzzy c-means, during various time series. Investigating the 2007-2008 data from the Bombay stock exchange, they concluded that k-means was more effective than SOM and Fuzzy C-means algorithms in clustering the selected stocks. Momeni et al. (2015) applied the AHP and K-means clustering algorithm to cluster three companies in the Tehran stock market. Their findings suggested that the K-means algorithm, compare to AHP, had better performance in clustering. Then, having clustered different validation indices, such as Silhouette, Davies-Bouldin, and Dunn’s, the authors proposed the optimal number of cluster deviations. They showed lower quadratic and structural errors.
Zhong and Enke (2017) employed a Fuzzy C-means method (FCM) to cluster the process and principal component analysis (PCA) and predict the daily trend of the S&P 500 index ETF (SPY) return according to 60 financial and economic factors. Subsequently, artificial neural networks (ANNs) and logistic regression models were used to classify twelve transferred data sets. According to the results, the prediction accuracy of ANN classifiers was higher than that of the logistic regression classifiers. This indicates the effect of PCA dimensionality reduction.
Li (2019) a novel method that was based on the common principal component (CPC) analysis. The empirical results revealed that Mc2PCA had many advantages to the traditional methods regarding the multivariate time series clustering.
Generally, reviewing and comparing the corresponding literature shows that most of the research has been devoted to the investigation of financial markets using data mining methods to examine the behavior of a total stock market index or predict the price of a particular stock. However, these studies did not mention the possible reasons to show that the applied algorithms were optimal. Accordingly, the present study was undertaken to address this gap by offering a detailed analysis of the TSE, in general, and two groups of products, i.e. chemical products and petrochemical products, more specifically, at the same time. These products were chosen because they are the most influenced groups of products when the macroeconomic variables, such as oil prices and exchange rates, change through time. Iran’s macroeconomic environment has changed substantially. Different algorithms have been tested to identify and apply the most optimal algorithm for achieving the most accurate results. We also considered both technical and fundamental types of analysis in the process of group and stock selection by considering the forecasts of each group indices and the financial situation of the companies as well. Finally, using these approaches and considering the investors’ attitudes, different portfolios are proposed for various time scales.
3. Methodology
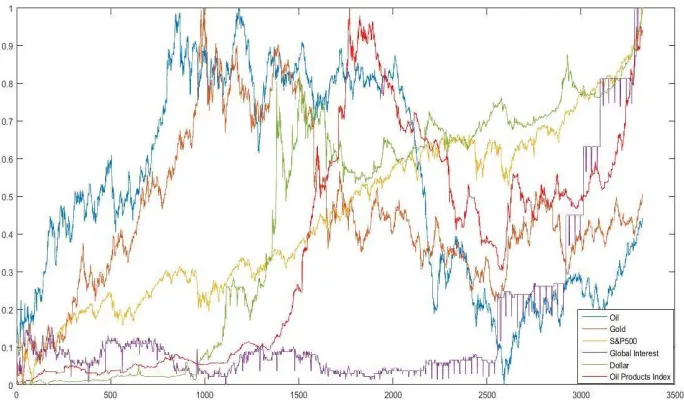
The methodology applied in this study consisted of two sections. In the first section, the petrochemical and chemical industry indices in TSE were approximated by RBF and MLP neural networks. Utilizing some of the relevant macroeconomic variables, including West Texas Intermediate (WTI) crude oil spot price, exchange rate, gold price, global interest rate, and Standard & Poor's 500 (S&P 500), the index for each of the two groups, namely, petroleum products and chemical products, was compiled, accompanied by the neural networks. This approach is very useful in recognizing trends and making decisions for entering or leaving the market. Figure 2 shows changes in the independent variables and the index of oil products over time.
clustering was done using that method. After identifying the clusters and prioritizing them, they were introduced with regard to the efficiency of the Konan stock portfolio for the long-, medium-, and long-term with the highest returns and the least risk.
Figure 2. Changes in the independent variables and index of oil products over time.
The MLP model, among different neural network models, has been applied in a great number of studies in engineering, medical studies, and mathematics. This algorithm takes the inputs in terms of weighted and bias duration and transfers them to an initiative level, utilizing a transfer function to produce an output. Then, the units will be organized in a layer free-forward topology. However, the RBF neural network has also been utilized by many researchers. The comparison between RBF and MLP shows that the former is the most popular. The RBF networks have the capability to handle the modeling for nonlinear data. Researchers may seem to prefer these algorithms to an iterative process in the MLP algorithm (Venkatesan & Anitha, 2006). Furthermore, to conduct the neural network algorithms, clustering is essential. As a method employed by many researchers, clustering is a strategy to reveal the classification structure of the data that is collected from real-world events.
3.1 Index Prediction
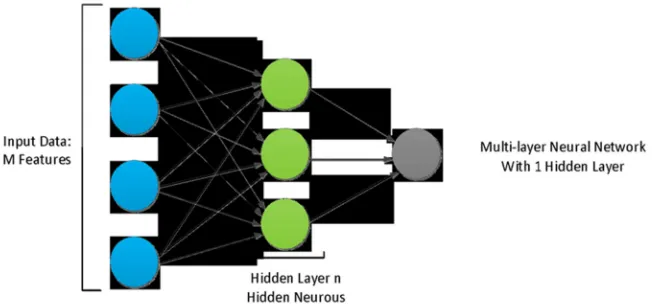
3.1.1 Multi-Layer Perceptron (MLP)
vector, the input layer algorithm takes data and middle layer takes the output data from the first layer and adds weight to any variables. Then, the data is sent to the activation function. Figure 3 shows the structure of a typical multi-layer perceptron in a schematic view.
Figure 3. Structure of the multi-layer perceptron.
The data from the output layer is taken from the last middle layer and is sent to the output layer activation function, which is usually an identity function for producing the values for target variables. Following Rezaee et al. (2018), various activation functions have been introduced that can be generally shown in the form of Eq. (1) as presented below:
∑ (1)
Table 1. The description of different variables in multi-layer perceptron
Variable Description
activation function
activation of ith hidden layer node
interconnection between ith hidden layer node and 0th output layer node bias of ith hidden layer
Source: Rezaee et al. (2018).
3.1.2 Radial Basis Function (RBF)
value will be yielded when the distance is zero and this value will decrease when the distance increases.
Also, in the RBF network, there are two weight classes: 1) The relationship between the hidden layer and the input layer, and 2) the relationship between the output layer and the hidden layer. The input layer weights include the basic function parameters and the hidden layer weights to the output layer of the combination of the activation and the base functions. This combination is due to the nonlinearity feature of the hidden layer, the reception of linear output, and the decreasing network process. Equation 2 shows the output function in the general form:
∑ (2)
Following Yilmaz and Kaynar (2011), the functional form of φ_j is shown in Equation 3:
−‖‖
ᵟ ! (3)
Table 2. The description of different variables in multi-layer perceptron
Variable Description
weighted relation between the output layer and the base function nonlinear (Gaussian) function of unit j
input data vector
" number of base functions
# center of RBF unit
$ The spread of the Gaussian basis function Source: Yilmaz and Kaynar (2011).
There are several methods to calculate the error value in the neural networks. In this study, the Mean Average Error (MAE), Root Mean Square Error (RMSE), and the Mean Square Error (MSE) were applied to calculate the accuracy of network performance.
3.2 Clustering and Efficient Portfolio
This section briefly discusses the algorithms and methods employed in the present study to find the optimum portfolio.
3.2.1 K-Means
%&'. ) = ∑ *+,‖. − -‖ , 0 = 1, 2, … , % (4) In which, and - represent the i-th input and the center of j-th cluster, respectively.
By applying the above objective function, the cluster variance will be minimized. The cluster variance refers to the squared distance between each center and its assigned data points. Equations 6 and 7 describe the KM’s membership and the weight functions, respectively. The characteristics of the algorithm are limited to constant weight function that treats the importance of all data points equally. It has a hard membership function but a simplified shape (Hamerly & Elkan, 2002).
*45 = 61 , + 7 = 89:*+, ‖− -‖
0 , <=>9+? (5) 45 = 1 (6)
3.2.2 Self Organizing Map (SOM)
This study used the SOM technique to visualize and analyze the high-dimensional database. It is a sophisticated method for presenting a high dimensional dataset into lower-dimensional ones. Since it is an unsupervised learning algorithm, not all the target vector will be needed. SOM technique is a topology that the neighborhood relations are saved in its mapping presentation. Due to these advantages, this study utilized it for clustering.
3.2.3 Fuzzy C-Means (FCM)
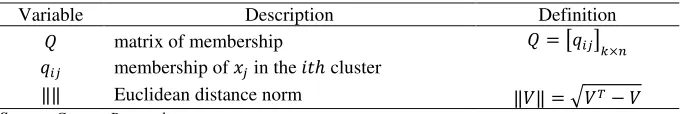
FCM is a clustering method which accompanies the fuzzy logic and assigns data to different clusters. This is the most common fuzzy clustering algorithm. FCM is structurally similar to the k-means algorithm, with the difference that FCM does not act hard and considers the membership percentage of each member as numerical between zero and one. The verification of the cluster association is achieved through the computation of the reverse distance to the center of the cluster. FCM clusters the data through an iterative search between a set of fuzzy clusters and their associated centers to display the structure of the data in the best possible way. The user specifies the number of clusters. Equation 7 shows the objective function, which should be minimized in the FCM algorithm:
@. A. *; ' = ∑ ∑ C . D‖− E‖ (7)
Table 3. The description of different variables in the multi-layer perceptron
Variable Description Definition
* fuzzy factor F m= 1
H number of clusters
@ cluster centers vector @ = . . … .
, number of data points
Variable Description Definition
A matrix of membership A = ICJK.
C membership of in the +=> cluster
‖‖ Euclidean distance norm ‖L‖ = ML− L
Source: Current Research.
* is added to Equation 8 to normalize the memberships. An iterative technique in the form of alternating optimization minimizes N function. Assuming * O 1, the solution for the optimization can be shown in Equation 9 as follows:
C = P∑ ‖‖QQRS‖‖! D
T U
(8)
When 1 V + V H,1 V 0 V , , Equation 9 depicts the center of the ith cluster. Following Yilmaz and Kaynar’s (2011) suggestion, after clustering the data, different validation tests were carried out which will be discussed in more detail in the next subsection.
@ =∑ WXRY
Z [
\]
∑[\]WXRY (9)
3.2.4 Validity
There are several indices for determining the degree of coherence or the quality of clusters and their optimal number. Some of the used indices are discussed in brief below. In this study, the authors used the following four indices (Table 4) for the verification of the optimal number of clusters and the performance of each clustering.
Table 4. The applied indices for determining the degree of coherence
Index Measurement
Silhouette (2002) A large value indicates a higher quality of the clustering. Davies–Bouldin
(2003)
A low value represents a higher quality of the clustering structure.
Calinski–Harabasz (2003)
To evaluate the clustering solution by comparing similarities and differences among the objects within each cluster. Gap (2001) A large value represents a higher quality of the clustering. Source: Yilmaz and Kaynar (2011).
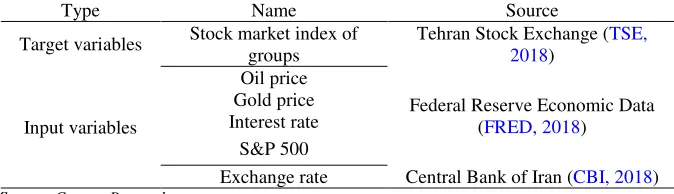
3.3 Data
Table 5. The description of data and the sources used for the prediction of index variables
Type Name Source
Target variables Stock market index of groups
Tehran Stock Exchange (TSE, 2018)
Input variables
Oil price
Federal Reserve Economic Data (FRED, 2018)
Gold price Interest rate
S&P 500
Exchange rate Central Bank of Iran (CBI, 2018) Source: Current Research.
Tables 6 and 7 show a description of the different datasets used in this study and the validation ratios applied for each company in two industries and the corresponding sources, respectively. These ratios were calculated from the data collected from 2016 to 2018, a period during which the indices of the industries showed a bullish trend.
Table 6. The validation ratios calculated for each company in two industries
Factor Description
EPS Earnings Per Share
P/S Price to sales
P/E Price to earnings ratio
P/B Price to book
DPS Dividend per share
ROE Return on equity
DE Debt on Equity
Transaction value The total value of shares that trade in a day Transactions volume Total number of shares that trade in a day Source: Current Research.
Table 7. Data description and sources for clustering variables
Type Name Source
Financial ratios EPS, P/E, DPS, P/S, P/B, ROE, DE
www.new.tse.ir www.ifb.ir www.codal.ir Return average
Monthly Three-month
Six-month Yearly
Daily transaction Trading value average Trading volume Source: Current Research.
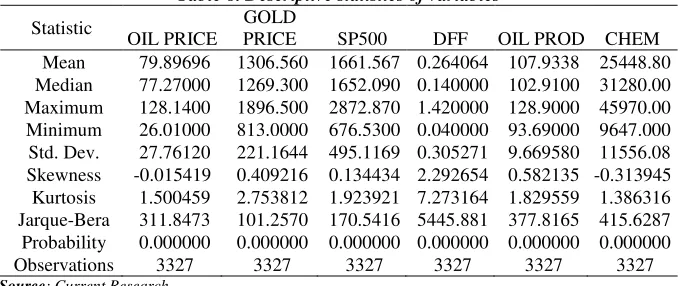
mean, the median, Std. dev., skewness, and Kurtosis values for the variables are presented in Table 8.
Table 8. Descriptive statistics of variables
Statistic
OIL PRICE
GOLD
PRICE SP500 DFF OIL PROD CHEM Mean 79.89696 1306.560 1661.567 0.264064 107.9338 25448.80 Median 77.27000 1269.300 1652.090 0.140000 102.9100 31280.00 Maximum 128.1400 1896.500 2872.870 1.420000 128.9000 45970.00 Minimum 26.01000 813.0000 676.5300 0.040000 93.69000 9647.000 Std. Dev. 27.76120 221.1644 495.1169 0.305271 9.669580 11556.08 Skewness -0.015419 0.409216 0.134434 2.292654 0.582135 -0.313945 Kurtosis 1.500459 2.753812 1.923921 7.273164 1.829559 1.386316 Jarque-Bera 311.8473 101.2570 170.5416 5445.881 377.8165 415.6287 Probability 0.000000 0.000000 0.000000 0.000000 0.000000 0.000000 Observations 3327 3327 3327 3327 3327 3327 Source: Current Research.
After data collection, a linear normalization was used to uniform the scales of inputs and target variables. The dataset was divided into three parts, including 70% for the train data, 15% for the validation, and 15% for testing the data. Then, the network training process was started by applying various numbers of neurons and 10 iterations for each stage to verify the optimal number of neurons.
It should be noted that the stock data for the companies in the petrochemical and chemical industries which are listed in the TSE were gathered from 2016 to 2017. This time frame was chosen because the analysis of the industry charts showed that these industries had a positive outlook over these two years. Therefore, to reduce the investment risk, we collected data belonging to a bullish period for these industries. There are 35 companies within these two industries. After collecting data for each company, the companies were clustered using the mentioned clustering algorithms.
4. Results and Discussion
This section discusses the results obtained from the predictive methods, artificial neural networks, including the MLP and RBF algorithms, three types of clustering algorithms, and cluster quality measurement indicators. In addition, the prediction for the indices is presented and discussed. Then, the best-optimized portfolio is identified using the clustering methods.
4.1 Predicting Indices
algorithm is run. Figure 4 depicts the neural network performance using (a) the MLP algorithm and histogram and (b) RMSE criteria for schemes of errors.
(a) (b) Figure 4. The diagram and histogram of errors
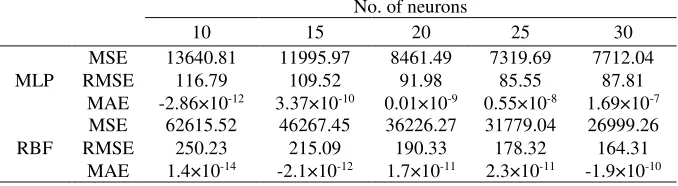
Tables 9 and 10 depict the results of the artificial neural network run on the chemical and petrochemical products. It is clearly shown that MLP is performing much better than RBF when the error values in the MLP are lower than those in RBF. This means that to predict the stock indices in the TSE market, MLP algorithms need to be analyzed precisely if they are to produce more credible results. It needs to be noted that the efficiency of different algorithms differs depending on the stock exchange market environment and stocks.
Table 9. Results of each neural network for the chemical index
No. of neurons
30 25
20 15
10
7712.04 7319.69
8461.49 11995.97
13640.81 MSE
MLP RMSE 116.79 109.52 91.98 85.55 87.81
1.69×10⁻⁷ 0.55×10⁻⁸
0.01×10⁻⁹ 3.37×10⁻¹⁰
-2.86×10⁻¹² MAE
26999.26 31779.04
36226.27 46267.45
62615.52 MSE
RBF RMSE 250.23 215.09 190.33 178.32 164.31 -1.9×10⁻¹⁰ 2.3×10⁻¹¹
1.7×10⁻¹¹ -2.1×10⁻¹²
1.4×10⁻¹⁴ MAE
Source: Research Findings.
Table 10. Results of each neural network for the petrochemical index
No. of neurons
30 25
20 15
10
80489503 59883566
8097119 100445318
178578898 MSE
MLP RMSE 13363.34 10022.24 8998.39 7738.44 8971.59 -96.3×10⁻⁹ -1.07×10⁻⁸
154.8×10⁻⁸ -60.7×10⁻⁹
275.7×10⁻¹⁰ MAE
211681908 226279626
260386017 314691692
484639215 MSE
RBF RMSE 22014.52 17739.55 16136.48 15042.59 14549.29 -5.36×10⁻⁹ -1.03×10⁻⁸
-1.11×10⁻⁸ -8.5×10⁻⁹
-4.9×10⁻¹⁰ MAE
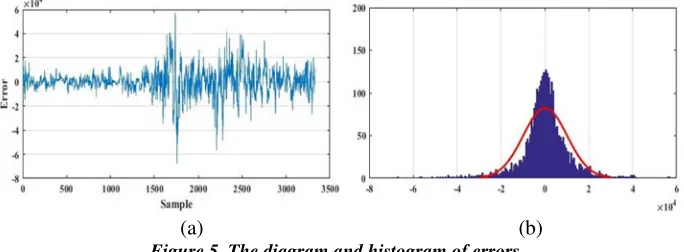
Also, as it can be seen in Figure 5(b), the histogram of the data has a normal shape and the errors fluctuate in the range of about 400 to 400 and -4×10⁴ to 4×10⁴. These results show that, according to the values for each of the
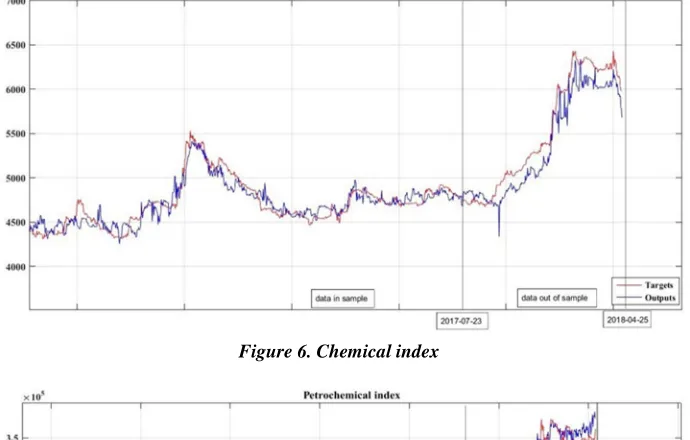
indicators, the oscillation of the error in these intervals is reasonable. After estimating the indices with both algorithms, according to the data shown in Table 8 and Table 9, the optimal number of the neurons was chosen to be 25. Also, it was observed that the MLP network had a better performance, so we used it to approximate the indices. The indices were predicted from 2017-07-23 to 2018-04-25. A daily transaction in the total sample approximation for 3327 days and 300 daily data transactions out of the sample were chosen for the prediction.
(a) (b) Figure 5. The diagram and histogram of errors
Figure 6. Chemical index
Figure 7. Petrochemical index
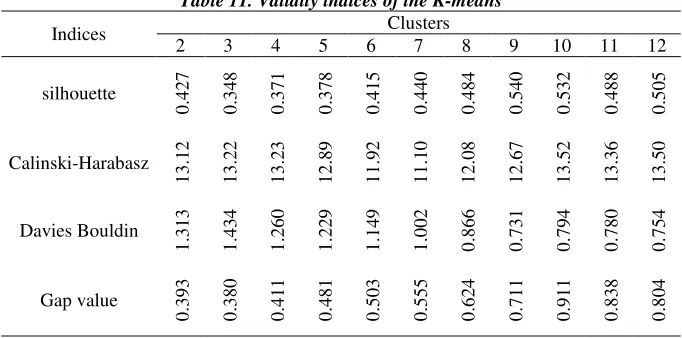
4.2 The Results for Clustering Companies and the Efficient Portfolio 4.2.1 The Results for K-Means
Table 11. Validity indices of the K-means Clusters Indices 12 11 10 9 8 7 6 5 4 3 2 0 .5 0 5 0 .4 8 8 0 .5 3 2 0 .5 4 0 0 .4 8 4 0 .4 4 0 0 .4 1 5 0 .3 7 8 0 .3 7 1 0 .3 4 8 0 .4 2 7 silhouette 1 3 .5 0 1 3 .3 6 1 3 .5 2 1 2 .6 7 1 2 .0 8 1 1 .1 0 1 1 .9 2 1 2 .8 9 1 3 .2 3 1 3 .2 2 1 3 .1 2 Calinski-Harabasz 0 .7 5 4 0 .7 8 0 0 .7 9 4 0 .7 3 1 0 .8 6 6 1 .0 0 2 1 .1 4 9 1 .2 2 9 1 .2 6 0 1 .4 3 4 1 .3 1 3 Davies Bouldin 0 .8 0 4 0 .8 3 8 0 .9 1 1 0 .7 1 1 0 .6 2 4 0 .5 5 5 0 .5 0 3 0 .4 8 1 0 .4 1 1 0 .3 8 0 0 .3 9 3 Gap value
Source: Research findings.
4.2.2 The Results for SOM
Applying the SOM toolbox from MATLAB routing showed that clustering operations could be different due to the differences in the initial configuration of the algorithm in the software, the choice of map size, and the shape of output neurons. It should be noted that for returning the best results for the training and fine-tune phases, α was assumed to be 0.5 and 0.05, followed by a batch training algorithm. Table 12 presents the validation results obtained from SOM. The results revealed that the values for 10 clusters were ideal for optimal clustering. Regarding the indices derived from the SOM algorithm, three indicators showed that 10 clusters were optimal while one indicator showed that 12 clusters were optimal. Therefore, the optimal number of clusters was chosen to be 10.
Table 12. Validity indices of SOM clustering
Clusters Indices 12 11 10 9 8 7 6 5 4 3 2 0 .6 2 5 0 .5 6 2 0 .7 0 8 0 .6 4 0 .5 7 4 0 .6 2 3 0 .5 5 4 0 .4 8 5 0 .5 2 2 0 .4 5 1 0 .4 7 2 silhouette 2 .6 1 9 2 .7 8 1 2 .9 7 9 2 .7 7 2 .6 9 2 2 .7 0 6 2 .5 1 1 2 .4 3 2 .4 6 3 2 .3 3 4 2 .4 0 6 Calinski Harabasz 0 .7 3 3 0 .7 9 9 0 .5 4 1 0 .5 6 6 0 .5 7 9 0 .5 6 3 0 .5 8 7 0 .6 0 2 0 .5 8 5 0 .6 0 6 0 .5 8 4 Davies Bouldin 1 .6 8 9 1 .5 4 9 1 .4 4 3 1 .2 6 1 .0 8 6 0 .8 7 2 0 .7 7 7 0 .6 8 2 0 .6 0 5 0 .6 2 7 0 .6 2 9 Gap value
4.2.3 The Results for FCM
Applying the FCM algorithm and taking the value of 2 for the fuzziness-weighting exponent, the researchers found that that the tolerance of the maximum termination was equal to10-6. The Standard Euclidean distance norm
method was used to calculate the cluster centers. The results for the validity indices are reported in Table 13. In this algorithm, the basis for selecting each member in a cluster is the highest percentage of membership in that cluster.
Table 13. Validity indices of FCM clustering
Clusters Indices 12 11 10 9 8 7 6 5 4 3 2 0 .5 7 5 0 .5 4 0 .6 2 7 0 .4 5 1 0 .5 3 1 0 .3 6 2 0 .3 0 4 0 .2 2 4 0 .2 3 3 0 .1 8 6 0 .5 silhouette 8 .2 3 5 8 .3 5 1 6 .7 2 7 5 .9 4 8 5 .9 9 6 5 .0 1 7 5 .0 3 6 4 .5 2 4 .6 4 3 3 .1 6 3 3 .0 3 8 Calinski-Harabasz 0 .5 9 3 0 .5 8 7 0 .4 3 0 .7 0 2 0 .7 6 2 0 .6 9 6 0 .8 0 2 0 .4 5 2 0 .4 8 0 .5 1 9 2 .4 1 6 Davies-Bouldin 1 .4 6 6 1 .4 8 3 1 .3 6 2 1 .2 5 9 1 .2 0 9 1 .1 4 5 1 .1 3 7 1 .1 1 7 1 .1 0 6 1 .1 3 4 1 .1 5 4 Gap value
Source: Research findings.
4.3 The Results for the Performance Evaluation
Figure 8. Performance evaluation of clustering methods
Source: Research findings
.
Comparing the results for indices in the K-means and FCM showed that the values for the Calinski-Harabasz criterion are were equal and that Davies-Bouldin and Gap value performed better in the FCM. That explains why FCM clustering showed better results. A comparison of FCM and SOM showed that Silhouette, Davies-Bouldin, and Gap value performed better in the FCM; accordingly, it was established that FCM had a better performance. Thus, it can be concluded that FCM performed better than the other criterion.
4.4 The Results Regarding the Efficient Portfolio
Given that the Fuzzy C-means showed the best performance in clustering, it was employed for clustering. Therefore, 10 clusters were selected to create an efficient portfolio. It should be mentioned that three clusters were omitted when creating portfolios because they had negative signs. The clusters were prioritized by their return in 1, 3, 6 months and 1-year period. The results are shown in Table 14.
Table 14. The prioritization of clusters in the study periods based on maximum returns
Long-term Medium-term Short-term
No
.
o
f
cl
u
st
er
s
1 year 6 months
3 months 1 month
3 3
3 3
5 5
5 5
10 2
10 10
8 8
8 8
1 10
1 9
9 1
9 1
2 9
2 2
Source: Research findings.
clusters were chosen to create an efficient portfolio. This minimized the risk of investment. According to the results shown in Table 10, the efficient portfolio and the weight of each stock for short-, medium- and long-term are presented in Table 15. It is clear that each cluster includes companies from both chemical and petrochemical products, and this distribution is uniformly evident in other clusters, too. By comparing the efficiency of each company, it became evident that the algorithm had a high ability to cluster companies. It is worth mentioning that the index for each group increased in conjunction with the increases in the world oil price and the exchange rate appreciation. Therefore, as it was expected, the highest returns were observed in the companies in the petrochemical group although there were companies with higher returns in the chemical group. This result matches the real economic situation of Iran, where the chemical and petrochemical products are export-oriented and the motivation for export increases as the exchange rate depreciates more.
Table 15. Prioritized clusters during the study period based on maximum returns
Short-term Medium-term Long-term
Company weight (%) Company weight (%) Company weight (%)
Sepahan oil 25.53 Kharg
petrochemical 25.24
Kharg
petrochemical 27.8 Kharg
petrochemical 25.53
Fannavaran
petrochemical 24.33
Fannavaran
petrochemical 23.3
Niroocolor 13.68 Tehran oil
refinery 19.47
Tehran oil
refinery 15.7 Bandar Abbas
oil refinery 12.16 Shelaab 14.05 Niroocolor 12.6 Shiraz oil
refinery 12.77
Shiraz oil refinery
9.64 Shiraz oil
refinery 10.6 Tehran oil
refinery 10.33 Pars oil 7.27 Pars oil 9.79 Source: Research findings.
The main results of this study are summarized in Table 14, in which the most efficient stock portfolio and its components are presented in different time periods. In other words, is Table 14 shows that if an investor desires to receive higher returns in the short-term, he/she needs to choose a basket with more than 50% of it attributed to the stocks from Sepahan oil and Kharg petrochemical companies. Equally important, the findings of this research suggest that when investors try to make a profit in medium- or long-term, they need to select a stock portfolio which includes Kharg petrochemical, Fannavaran petrochemical, and Tehran oil refinery stocks with more than 70% contributions.
5. Conclusion and Policy Implications
trade and to find a stock for yielding maximum returns while reducing risk. To address this issue, data mining techniques were used to investigate the Tehran Stock Market. Furthermore, the artificial neural network algorithms were used to forecast stock prices and the indicators were examined to estimate future trends. In the present study, the companies in the petrochemical and chemical industries were selected due to the fact that these industries attracted a high share of capital in the TSE. Once the companies were chosen from these categories, they were clustered and analyzed. WTI crude oil spot price, exchange rate, gold price, global interest rate, and S&P 500 were among the most relevant variables considered for indexing the petroleum and chemical products. Then, using neural networks, the index was compiled. Afterward, K-Means, SOM, and FCM clustering algorithms were examined, the best algorithm for each group was identified, and the stock portfolio with the highest returns, considering the short-, medium-, and long-term periods was introduced.
The results showed that between the two artificial neural networks used to predict indices, MLP had better performance and higher accuracy compared with that of the RBF. This conclusion was reached based on the numerical values of the measured error indices. However, one cannot generally comment on the superiority of one of the algorithms since the error indices measured in the RBF algorithm are generally higher than the values obtained in the MLP algorithm. This result is in line with those of Chiang et al. (1996) and Misiunas et al. (2016). Therefore, based on the error indices values, the MLP algorithm was used to predict the indices. The histogram of the error of estimating each index using the MLP algorithm manifested the high accuracy of the algorithm in predicting the results with more accuracy. By predicting the chemical and petrochemical indices, it was noticed that they had experienced a bullish trend between 2017 and 2018. This growth was accompanied by a rise in crude oil prices. The petrochemical index was more influenced by the rise in the oil prices which was due to the growth of crack spread of the products. However, the chemical products index followed a steady declining trend after a short growth. Examining the fundamental conditions of the companies investing in this period showed that they had a low risk of investing.
- The results of the forecasting methods indicated that the index of oil products had more influence when the explanatory variables, such as oil price and the exchange rate, experience an increase;
- The proposed portfolio built based on the research findings showed that when investors were concerned for return in the short-run, higher contribution needed to be specified to Sepahan oil and Kharg petrochemical stocks while when they had medium- or term plans, Kharg petrochemical, Fannavaran petrochemical, and Tehran oil refinery stocks had to form at least two-thirds of the portfolio contribution.
- The highest returns in the medium- and long-term in each of the proposed portfolios belonged to the chemical companies. That was due to the rise in the price of the exchange rate, impacting the corporate financial statements over time. Exploring a preliminary index for other groups, such as the group of basic metals and metal minerals which had a solid correlation with each other and with the external variables, can be another important topic for future research.
- A comparison of the indices determined by each clustering algorithm regarding the optimal number of clusters showed that the fuzzy clustering algorithm had a better performance than the K-means and SOM algorithms. Therefore, it can be stated that the fuzzy method produces better clusters. This finding is in line with that of Lu et al. (2018).
References
Bação, F., Lobo, V., Painho, M., (2005). Self-organizing maps as substitutes for k-means clustering, International Conference on Computational Science. Springer, pp. 476-483.
Baryshevsky, D.V., (2004). The interrelation of the long-term gold yield with the yields of another asset classes. Available at SSRN 652441.
Blair, B., Poon, S.-H., Taylor, S.J., (2002). Asymmetric and crash effects in stock volatility for the S&P 100 index and its constituents. Applied Financial Economics, No. 12, pp. 319-329.
Bollerslev, T., (1986). Generalized autoregressive conditional heteroskedasticity. Journal of econometrics, No. 31, pp. 307-327.
CBI, (2018). Economic trends. Economic Statistics Department, Tehran, Iran. Chen, A.-S., Leung, M.T., (2004). Regression neural network for error
correction in foreign exchange forecasting and trading. Computers & Operations Research, No. 31, pp. 1049-1068.
Chen, G., Jaradat, S.A., Banerjee, N., Tanaka, T.S., Ko, M.S., Zhang, M.Q., (2002). Evaluation and comparison of clustering algorithms in analyzing ES cell gene expression data. Statistica Sinica, pp. 241-262.
Chiang, W.-C., Urban, T.L., Baldridge, G.W., (1996). A neural network approach to mutual fund net asset value forecasting. Omega, No. 24, pp. 205-215.
Chiu, C.-Y., Chen, Y.-F., Kuo, I.-T., Ku, H.C., (2009). An intelligent market segmentation system using k-means and particle swarm optimization.
Expert Systems with Applications, No. 36, pp. 4558-4565.
Durante, F., Foscolo, E., (2013). An analysis of the dependence among financial markets by spatial contagion. International Journal of Intelligent Systems, No. 28, pp. 319-331.
FRED, F.R.E.D., (2018). Federal Reserve Bank of St. Louis: Exchange Rates. Available online at http://research. stlouisfed. org/fred2/categories/158. Last accessed 5.
Galeshchuk, S., (2016). Neural networks performance in exchange rate prediction. Neurocomputing, No. 172, pp. 446-452.
Gandhmal, D.P., Kumar, K., (2019). Systematic analysis and review of stock market prediction techniques. Computer Science Review, No. 34, pp. 100-190.
Hamerly, G., Elkan, C., (2002). Alternatives to the k-means algorithm that find better clusterings, Proceedings of the eleventh international conference on Information and knowledge management. ACM, pp. 600-607.
Kanjamapornkul, K., Pinčák, R., Bartoš, E., (2016). The study of Thai stock market across the 2008 financial crisis. Physica A: Statistical Mechanics and its Applications, No. 462, pp. 117-133.
Kasturi, J., Acharya, R., Ramanathan, M., (2003). An information theoretic approach for analyzing temporal patterns of gene expression.
Bioinformatics, No. 19, pp. 449-458.
Li, H., (2019). Multivariate time series clustering based on common principal component analysis. Neurocomputing, No. 349, pp. 239-247.
Liao, S.-H., Chou, S.-Y., (2013). Data mining investigation of co-movements on the Taiwan and China stock markets for future investment portfolio. Expert Systems with Applications, No. 40, pp. 1542-1554.
Lu, Y.-N., Li, S.-P., Zhong, L.-X., Jiang, X.-F., Ren, F., (2018). A clustering-based portfolio strategy incorporating momentum effect and market trend prediction. Chaos, Solitons & Fractals, 117, pp. 1-15.
Mashayekh, S., Moradkhani, H.H., Jafari, M., (2011). Impact of macroeconomic variables on stock market: The case of Iran, 2nd International Conference on Business and Economic Research (2nd ICBER 2011) Proceeding. Conference Master Resources, pp. 350-360.
Miao, K., Chen, F., Zhao, Z., (2007). Stock price forecast based on bacterial colony RBF neural network [j]. Journal of Qingdao University (Natural Science Edition), No. 2.
Misiunas, N., Oztekin, A., Chen, Y., Chandra, K., (2016). DEANN: A healthcare analytic methodology of data envelopment analysis and artificial neural networks for the prediction of organ recipient functional status.
Omega, No. 58, pp. 46-54.
Momeni, M., Mohseni, M., Soofi, M., (2015). Clustering Stock Market Companies via K-Means Algorithm. Kuwait Chapter of the Arabian Journal of Business and Management Review 4, 1.
Nair, B.B., Kumar, P.S., Sakthivel, N., Vipin, U., (2017). Clustering stock price time series data to generate stock trading recommendations: An empirical study. Expert Systems with Applications, No. 70, pp. 20-36.
Nanda, S., Mahanty, B., Tiwari, M., (2010). Clustering Indian stock market data for portfolio management. Expert Systems with Applications, No. 37, pp. 8793-8798.
Patel, J., Shah, S., Thakkar, P., Kotecha, K., (2015). Predicting stock market index using fusion of machine learning techniques. Expert Systems with Applications, No. 42, pp. 2162-2172.
Rapach, D.E., Wohar, M.E., Rangvid, J., (2005). Macro variables and international stock return predictability. International journal of forecasting, No. 21, pp. 137-166.
Santos, A.A.P., da Costa Jr, N.C.A., dos Santos Coelho, L., (2007). Computational intelligence approaches and linear models in case studies of forecasting exchange rates. Expert Systems with Applications, No. 33, pp. 816-823.
Schwartz, R.A., Whitcomb, D.K., (1977). Evidence on the presence and causes of serial correlation in market model residuals. Journal of Financial and Quantitative Analysis, No. 12, pp. 291-313.
Shu, G., Zeng, B., Chen, Y.P., Smith, O.H., (2003). Performance assessment of kernel density clustering for gene expression profile data. International Journal of Genomics, No. 4, pp. 287-299.
Statistic, I.a., (2018). Information and Statistic, in: Ministry of Industry, M.a.T.o.I.R.o.I. (Ed.).
Tibshirani, R., Walther, G., Hastie, T., (2001). Estimating the number of clusters in a data set via the gap statistic. Journal of the Royal Statistical Society: Series B (Statistical Methodology), No. 63, pp. 411-423.
TSE, (2018). Tehran Stock Exchange. Tehran Stock Exchange Corp, Tehran, Iran.
Venkatesan, P., Anitha, S., (2006). Application of a radial basis function neural network for diagnosis of diabetes mellitus. Current Science, No. 91, pp. 1195-1199.
Yilmaz, I., Kaynar, O., (2011). Multiple regression, ANN (RBF, MLP) and ANFIS models for prediction of swell potential of clayey soils. Expert systems with applications, No. 38, pp. 5958-5966.
Zhang, C., Almpanidis, G., Wang, W., Liu, C., (2018). An empirical evaluation of high utility itemset mining algorithms. Expert Systems with Applications, No. 101, pp. 91-115.
Zhang, Y., Wu, L., (2009). Stock market prediction of S&P 500 via combination of improved BCO approach and BP neural network. Expert systems with applications, No. 36, pp. 8849-8854.
Zhong, X., (2004). A study of several statistical methods for classification with application to microbial source tracking. Worcester Polytechnic Institute. Zhong, X., Enke, D., (2017). A comprehensive cluster and classification mining
procedure for daily stock market return forecasting. Neurocomputing, No. 267, pp. 152-168.