A New Framework for Identifying Cementation Level of MICP-Treated Sands
Ashkan Nafisi1 and Brina M. Montoya, Ph.D., P.E.2
1
Graduate Student Researcher, Dept. of Civil, Construction, and Environmental Engineering, North Carolina State Univ., Raleigh, NC 27695. E-mail: [email protected]
2
Assistant Professor, Dept. of Civil, Construction, and Environmental Engineering, North Carolina State Univ., Raleigh, NC 27695. E-mail: [email protected]
Abstract
Microbial induced calcium carbonate precipitation (MICP) is a ground improvement technique that can be employed to increase soil stiffness and shear strength. Based on the treatment’s objectives, soil properties are improved to reach different levels of cementation. Shear wave velocity and mass of calcium carbonate can be used to categorize treated soils into various levels of cementation. However, the obtained results show that these two parameters are not sufficient in categorizing cementation and may be misleading. Therefore, a new framework which considers particle size, the dependency of shear modulus on confinement, shear wave velocity, and calcium carbonate content is proposed. In this paper, three types of poorly graded sands with different particle sizes were used. Shear modulus was measured at varying levels of cementation and confinement pressures to find out the amount of dependency of small strain shear modulus on confining pressure. According to the results, the finest soil needs more calcium carbonate to reach heavily cemented level, but the final shear wave velocity is lower compared to the coarser sands. Based on the obtained results, n (the slope of log Gmax against log of mean effective stress)
values for lightly, moderately, and heavily MICP-sands are about 0.4, 0.3, and less than 0.1, respectively.
INTRODUCTION
The increasing demand for environmentally-friendly, cost effective, and sustainable techniques for ground improvement has driven scientists and engineers to investigate such methods. Bio-mediated soil improvement techniques have the potential to meet the aforementioned demands (Dejong 2013). Among bio-mediated soil improvement techniques, microbial induced calcium carbonate precipitation (MICP) has drawn the attention of researchers in recent decades. In this method urea hydrolyzing bacteria, such as Sporosarcina pasteurii, are used to facilitate the precipitation of calcium carbonate by increasing the alkalinity of pore fluid. Strength and stiffness of the soil increase after bio-treatment due to the densification and bonding effects of the precipitated calcium carbonate (Dejong et al. 2010). The degree of improvement relies upon the treatment process, chemical recipe, and soil properties. Based on the achieved improvement, treated soils are classified into different levels of cementation. Cementation levels are defined so that specific behavior and properties of treated soil, namely shear strength behaviors, can be presumed. Montoya and DeJong (2015) observed that strain hardening behavior changes to strain
softening behavior in moderately bio-cemented specimen which is the threshold between lightly and moderately MICP-sand.
The degree of cementation is usually presented by the weight ratio of the added cementing agents (e.g., Portland cement, calcite, or gypsum) to the soil mass in artificially cemented soils (Chang and Woods 1987; Ismail et al. 2002b). However, in MICP-sand, this ratio cannot be specified accurately before starting bio-treatment because the mass of precipitated calcium carbonate is a function of soil properties, bacteria activity, and environmental factor (Mortensen et al. 2011). This issue becomes more important in experimental settings since the mass of calcium carbonate is measured by destructive methods such as acid washing (Feng and Montoya 2015; Whiffin et al. 2007). Therefore, the need of non-destructive methods in determining the level of cementation is appreciable. Measuring shear wave velocity is a non-destructive technique which helps determine the level of cementation. However, the behavior of treated soils can be affected by some other factors such as grain size distribution and particle shape, which play a role in specifying the level of cementation (Nafisi et al. 2018). Indeed, two specimens with the same shear wave velocity and mass of calcium carbonate can behave differently which indicates that the level of improvement is different. Therefore, another framework based on soil behavior is needed to classify MICP-sands.
The effect of cementation degree on the various in small strain shear stiffness (G) of cemented soils relative to applied pressure (e.g., vertical effective stress, σ'mean) has been
evaluated by Chang and Woods (1987) and Montoya et al. (2013). The results indicated that G becomes less dependent to the confining pressure as the cementation level increases. Generally, the relationship between the log G against log σ'v for sands has a slope of about 0.5 (Stokoe et al.
1985).
Montoya et al. (2013) performed a series of laboratory tests on Ottawa 50-70 sand with different degrees of cementation to find how dependent shear stiffness is to the vertical effective stress in MICP sand at different levels of cementation. It was observed that n (the slope of log Gmax against log σ'v) does not remain constant during treatment and gets smaller by increasing the stiffness of treated soils. Lightly cemented specimens had n value less than 0.5 and the line was almost horizontal for heavily cemented specimens.
Chang and Woods (1987) investigated the dependency of the shear modulus of artificially cemented sands on the confining pressure at different levels of cementation. Their results also highlighted that the n value decreases by increasing the cementation degree.
These results indicate that the n value (the slope of log Gmax versus log σ'mean) can be an
index for categorizing cemented soils into different levels of cementation. Hence, this paper sets forth the relationship between different levels of cementation and the n value for three different types of sand.
MATERIALS AND METHODS
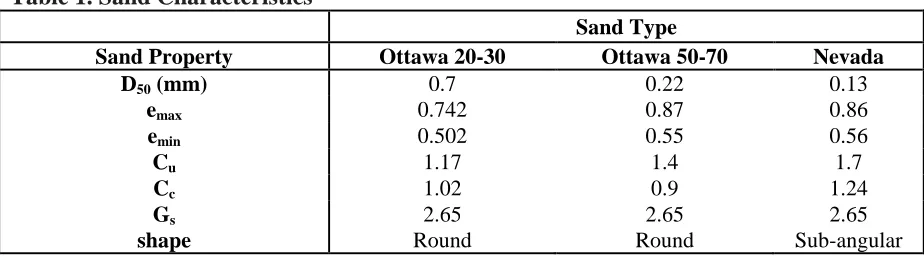
Soil Properties. Three types of poorly graded silica sand with different mean particle sizes were used in this study. The sand properties are tabulated in Table 1.
Table 1. Sand Characteristics
Sand Type
Sand Property Ottawa 20-30 Ottawa 50-70 Nevada
D50 (mm) 0.7 0.22 0.13
emax 0.742 0.87 0.86
emin 0.502 0.55 0.56
Cu 1.17 1.4 1.7
Cc 1.02 0.9 1.24
Gs 2.65 2.65 2.65
shape Round Round Sub-angular
Sample Preparation. Three specimens were prepared using dry pluviation with a relative density of 40%. The height and diameter of specimens were 144 mm and 72 mm, respectively. The prepared specimens were placed under 100 kPa vacuum after preparation. Therefore, the dimensions were measured while effective stress was 100 kPa. After filling up the triaxial cell, the cell pressure increased gradually while the vacuum was released so that the effective stress did not exceed 100 kPa during sample preparation. The top and bottom triaxial caps were modified to install bender elements that made the shear wave velocity measurement possible during treatment.
Treatment Process. In this study, Sporosarcina pasteurii was used. To culture the bacteria, the growth medium consisted of: 0.13 mol l-1 Tris buffer, 10 g l-1 (NH4)2 SO4, and 20 g l-1 yeast were autoclaved separately and then mixed together (Montoya and DeJong 2015). S. pasteurii stock culture was introduced to the growth medium, and then incubated in shaking incubator at 30oC and 200 rpm for about 40 hours. After reaching the desired optical density (OD)600 of 0.8 to 1.2, cultures were centrifuged at 4000 g for 15 minutes.
A two-phase injection method was used for treatment. Treatments were initiated by injecting biological solution (the bacteria was inoculated to the specimen through biological injection) with retention time of 4 to 6 hours followed by injecting the cementation solution. Cementation treatments were repeated in 6-6-12 h interval, and the direction of injection was alternately changed from top to bottom and bottom to top to improve the uniformity of calcium carbonate distribution. The chemical recipes for the both solutions are listed in Table 2.
Table 2. Biological and cementation solution
Chemicals Biological Solution (mM) Cementation Solution (mM)
Urea 333 333
Ammonium Chloride 374 374
Calcium Chloride 0 100
Shear Wave Velocity Measurements. Bender elements with a known separation distance were used to measure the shear wave velocity during treatment to monitor the cementation process non-destructively. The top and bottom triaxial caps were modified to install bender elements.
Waves were generated by a function generator model Agilent 33522A and were received by a digital oscilloscope model Agilent MSO6014A. The shear wave velocity of the soil was directly calculated
by measuring the time required for a small strain elastic shear wave to be transmitted from a transmitting to a receiving bender element through a known distance (here is almost equal to the height of the specimens). Bender elements were prepared by following a special preparation technique proposed by Montoya et al. (2012).
Small Strain Shear Modulus Assessment. The shear modulus can be estimated by using the following equation:
G
max
V
s2 (1)Where ρ is the mass density of treated soil and Vs is the shear wave velocity. Mass density is
calculated for the specimens based on the mass of soil and volume of each specimen.
In this study, estimating shear modulus is of primary interest to evaluate the dependency of Gmax on the confining pressure at different levels of cementation. To achieve this, a specimen
of each sand was prepared and treated until the “lightly cemented” shear wave velocity was achieved (Table 3). These shear wave velocities were picked up based on the previous works (Montoya and DeJong 2015) and the authors’ prediction of shear wave velocity at different levels of cementation for the three types of sands. Having reached the specific shear wave velocity, the confining pressure (i.e., mean effective stress, p') was reduced from 100 kPa to 10 kPa, and then it increased from 10 kPa to 100 kPa and from 100 kPa to 400 kPa. At each loading and unloading path, the change in shear wave velocity was assessed. After the shear wave velocity measurements were complete at 400 kPa, the confinement was reduced to 100 kPa and additional treatments were conducted. The treatment and loading processes were repeated for “moderately cemented” and “heavily cemented” levels (Table 3). The change in volumetric strain during the loading and unloading cycles were minimal and assumed to be an insignificant change to the soil fabric.
The n value was assessed for the three loading steps separately to account for the effect of unloading and reloading in the specimens. Therefore, the reported values are n1, n2, and n3 for the
three mentioned ranges of confinement.
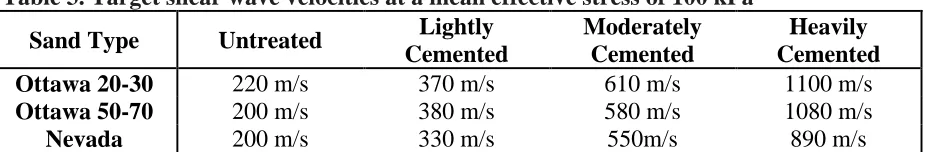
Table 3. Target shear wave velocities at a mean effective stress of 100 kPa
Sand Type Untreated Lightly
Cemented
Moderately Cemented
Heavily Cemented
Ottawa 20-30 220 m/s 370 m/s 610 m/s 1100 m/s
Ottawa 50-70 200 m/s 380 m/s 580 m/s 1080 m/s
Nevada 200 m/s 330 m/s 550m/s 890 m/s
Calcium Carbonate Content. The final mass of calcium carbonate was measured for each specimen after obtaining the level of cementation so that shear modulus was almost independent of the confinement (heavily cemented level) by acid washing technique with 1 M HCL solution.
RESULTS
The shear modulus of soil is a function of the applied stress, which is as a result of a reduction in the void ratio and restraining of relative movement between soil particles (Chang and Woods 1987). In addition, calcium carbonate precipitation primarily happens at the particle contacts (Dejong et al. 2010) which has remarkable contribution in increasing the stiffness of MICP-sand. Therefore, along the cementation process, the particles are bound to each other until they form a continuum media in which the majority of particles are bridged to each other (heavily cemented soil). At this level of cementation, any induced stress is supported by the stiff structure of the soil in a way that any volume change and relative movement between soil particles are negligible. Indeed, sand particles are cemented to adjacent particles by the precipitated calcium carbonate, and any relative movement is restrained by the calcium carbonate bonds. In this situation the stiffness becomes almost independent of the confining pressure. Therefore, it is expected that the confining pressure exerts less influence on the shear modulus as the cementation process happens. The obtained results match well with the proposed scenario. The variation of the shear modulus versus confining pressure are presented in Figure 1. Initial n values for untreated specimens are 0.51, 0.48, and 0.5 for Ottawa 20-30, Ottawa 50-70, and Nevada sand, respectively. These numbers correspond well with the presented values in other studies (Stokoe et al. 1985). Table 4 shows the n values for each sand for different cementation levels and ranges of confinement. At the same shear wave velocity, the coarser sand has a higher n value, and the ultimate value for n is about 0.05 in all types of sand.
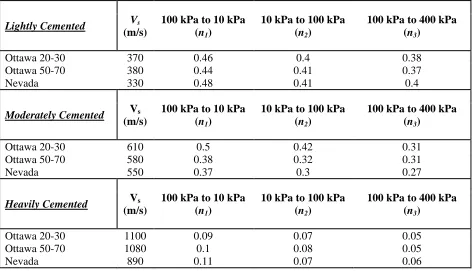
Table 4. n values for different types of sand and levels of cementation
Lightly Cemented Vs
(m/s)
100 kPa to 10 kPa (n1)
10 kPa to 100 kPa (n2)
100 kPa to 400 kPa (n3)
Ottawa 20-30 370 0.46 0.4 0.38
Ottawa 50-70 380 0.44 0.41 0.37
Nevada 330 0.48 0.41 0.4
Moderately Cemented Vs
(m/s)
100 kPa to 10 kPa (n1)
10 kPa to 100 kPa (n2)
100 kPa to 400 kPa (n3)
Ottawa 20-30 610 0.5 0.42 0.31
Ottawa 50-70 580 0.38 0.32 0.31
Nevada 550 0.37 0.3 0.27
Heavily Cemented Vs
(m/s)
100 kPa to 10 kPa (n1)
10 kPa to 100 kPa (n2)
100 kPa to 400 kPa (n3)
Ottawa 20-30 1100 0.09 0.07 0.05
Ottawa 50-70 1080 0.1 0.08 0.05
Nevada 890 0.11 0.07 0.06
Figure 1. Variation of Gmax versus confining pressure for (a) Ottawa 20-30; (b) Ottawa 50-70; (c) Nevada Sand
DISCUSSION
The compressive strength of the precipitated calcium carbonate is higher than its tensile strength (Lin et al. 2014), so the n value at a given shear wave velocity is unique for different loading paths, especially in lightly and moderately levels of cementation in which the calcium carbonate bonds are not strong enough to support tensile stresses. Hence, the n value is higher when confining pressure decreases compare to the condition in which confining pressure increases (n1
>n2, Table 4). Comparing n2 and n3 shows that these two values are close to each other even
though the maximum confining pressure is 40 times greater than the minimum confining pressure (10 kPa). Based on the Hertz theory (Lambe and Whitman 1969), the contact area for uncemented particles has a direct relationship with N2/3where N is the applied load to a particle. Therefore, it is expected to have about an 11 times larger contact area for particles at 400 kPa compared to 10 kPa. However, the contact area is smaller than the bonding area after
cementation (DeJong et al. 2006). Hence, it is reasonable to assume that 40 times increase in confining pressure does not change the bonding area significantly after cementation which justifies the small difference between n2 and n3.
Treated soils are categorized into three levels of cementation according to the measured shear wave velocities and the correspondent n values. Lightly, moderately, and heavily cemented sands are delineated based on the n values of about 0.4, 0.3, and less than 0.1, respectively.
The measured shear wave velocity for Nevada and Ottawa 50-70 sands are less than that of Ottawa 20-30 while the final mass of calcium carbonate is higher and the n values are almost the same. The difference can be attributed to the different size and the shape of soil particles in Nevada, Ottawa 50-70, and Ottawa 20-30. The number of particle contacts in a soil mass increases by decreasing the particle size (Ncontact (1/R3), (Ismail et al. 2002a)). Considering the shape and size of particles, the number of particle contacts is higher in Nevada sand compared to the two other sands. Hence, more calcium carbonate is needed to bind particles to reach any specific level of cementation. Regarding the lower shear wave velocity for Nevada and Ottawa 50-70 sand compare to Ottawa 20-30, it is proposed that sending waves must travel longer path in the treated soil mainly because of the higher number of contact points in Nevada sand compare to the two other types of sands. Therefore, at the same level of cementation (almost similar n value), the mass of calcium carbonate is more in Nevada sand while the shear wave velocity is less. Table 3 tabulates average calcium carbonate percentage for the three specimens at heavily cemented level (the ratio between mass of calcium carbonate and the mass of the soil).
Table 5. Final average mass of calcium carbonate for the specimens
Sand Type Ave. Mass of Calcium carbonate (%)
Ottawa 20-30 2.6%
Ottawa 50-70 6.3%
Nevada 7.2%
Figure 2 shows the variation of n against shear wave velocity for the three types of sand. The curve is developed by employing logarithmic curve-fitting method which is statistically best fit. This figure can be used to estimate the level of cementation of MICP treated soils at different depths (ranging from 0.5 m to 25 m) based on a known shear wave velocity. It can be also used to predict Gmax at different levels of cementation and confining pressure when shear wave velocity is measured at just one confining pressure. The n value can be assessed through an iterative process by assuming an appropriate n value using the results in Table 4 as a guide, estimating the shear wave velocity at 100 kPa using Equation 2 determining the n value using Figure 2, and repeating the process until the n value converges. Equation 2 is as follows:
100
( )
2 ( )
100 s
V Log
V n
P Log
(2)
Where n, Vs, V100, and P are the slope of log Gmax versus log σ'mean, shear wave velocity,
equivalent shear wave velocity at 100 kPa, and mean effective stress (kPa), respectively.
Figure 2. Variation of the n value versus measured shear wave velocity
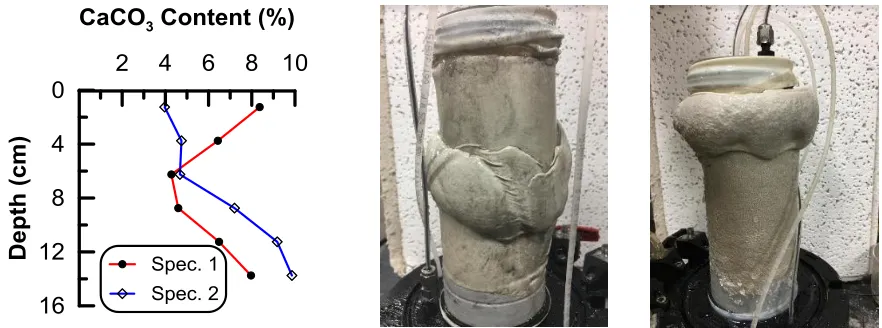
Representative Mass of Calcium Carbonate.The amount of precipitated calcium carbonate is usually presented by reporting the average mass of calcium carbonate for bio-treated soil (Gomez et al. 2014; Terzis et al. 2016). The average value can be a reliable index to determine the behavior of bio-treated soil in cases which precipitated calcium carbonate has been distributed uniformly. However, the average value is not the best index to be considered when non-uniformity is observed. Two specimens with non-uniform distribution of calcium carbonate were prepared to show how failure is affected by the calcium carbonate distribution. Each specimen was divided into 6 sections after shearing to measure the mass of calcium carbonate in each section. Figure 3 shows the calcium carbonate distribution and sheared specimens after 15% of axial strain in a drained triaxial compression test. Table 4 shows the minimum and average mass of calcium carbonate in each specimen. As it can be seen, the section with minimum amount of calcium carbonate governs the behavior of specimens, and failure takes place in the weakest section of treated soil. Therefore, the minimum should be reported along with the average value of precipitated calcium carbonate in cases which calcium carbonate distribution is non-uniform.
Table 6. Minimum and average mass of calcium carbonate
# Sand Type Ave. Min.
1 Ottawa 50-70 6.3% 4.3%
2 Ottawa 20-30 6.1% 4.0%
Figure 3. Non-uniform calcium carbonate distribution and sheared specimens (Spec. 1 on the left and Spec. 2 on the right side)
CONCLUSION
Based on the experimental results the following conclusions can be drawn:
1- The n value (the slope of log Gmax vs log σ'mean) varies between 0.05 to 0.52 depends on
sand type and cementation level. The higher the level of cementation, the lower the n
value.
2- Classifying MICP treated soils into different levels of cementation based on their shear wave velocity and/or the mass of precipitated calcium carbonate is not inclusive. Different types of soil can reach to a specific level of cementation, based on their behavior, with different shear wave velocity and mass of calcium carbonate.
3- The maximum shear wave velocity, and thus small strain shear modulus, that can be achieved after treatment depends on the matrix of cemented sand.
4- A new framework is proposed in which cementation level is a function of n. The n value for lightly, moderately, and heavily MICP-sand are about 0.4, 0.3, and less than 0.1, respectively.
ACKNOWLEGEMENTS
Funding provided by the United States National Science Foundation (#1537007). Any opinions, findings, and conclusions presented in this paper are those of the writers and do not necessarily reflect the opinions of the National Science Foundation.
REFERENCE
Chang, T., and Woods, R. D. (1987). “Effect of confining pressure on shear modulus of cemented sand.” Developments in Geotech. Eng., Elsevier Applied Science, 43, 193–208.
Dejong, J. T. and 33 others. (2013). “Biogeochemical processes and geotechnical applications: progress, opportunities and challenges.” Géotechnique, 63(4), 287–301.
DeJong, J. T., Fritzges, M. B., and Nüsslein, K. (2006). “Microbially Induced Cementation to Control Sand Response to Undrained Shear.” Journal of Geotech. and Geoenviron. Eng. Engineering, 132(11), 1381–1392.
Dejong, J. T., Mortensen, B. M., Martinez, B. C., and Nelson, D. C. (2010). “Bio-mediated soil improvement.” Ecological Engineering, 36, 197–210.
Feng, K., and Montoya, B. M. (2015). “Influence of confinement and cementation level on the behavior of microbial-induced calcite precipitated Sands under monotonic drained loading.”
Journal of Geotech. and Geoenviron. Eng., 2(Atcc 11859), 4015057.
Gomez, M. G., Martinez, B. C., DeJong, J. T., Hunt, C. E., Major, D. W., and Dworatzek, S. M. (2014). “Field-scale bio-cementation tests to improve sands.” Proc. ICE ground improvement, 168(3), 206–216.
Ismail, M. A., Joer, H. A., Olph, M. F. R., and Meritt, A. (2002a). “Cementation of porous materials using calcite.” Geotechnique, 52(5), 313–324.
Ismail, M. A., Joer, H. A., Sim, W. H., and Randolph, M. F. (2002b). “Effect of Cement Type on Shear Behavior of Cemented Calcareous Soil.” J. of Geotech. and Geoenviron. Eng., 128(6).
Lambe, T. W., and Whitman, R. V. (1969). Soil Mechanics. Wiley, New York.
Lin, H., Suleiman, M. T., Helm, J., and Brown, D. G. (2014). “Measurement of Bonding Strength between Glass Beads Treated by (MICP).” Geo-Congress, 1625–1634.
Montoya, B. M., and DeJong, J. T. (2015). “Stress-Strain Behavior of Sands Cemented by MICP.” j. Journal of Geotech. and Geoenv. Eng., 141(6), 4015019.
Montoya, B. M., Gerhard, R., DeJong, J. T., Wilson, D. W., Weil, M. H., Martinez, B. C., and Pederson, L. (2012). “Fabrication, operation, and health monitoring of bender elements for aggressive environments.” Geotechnical Testing Journal, 35(5), 1–15.
Montoya, B. M., De Jong, J. T., and Boulanger, R. W. (2013). “Dynamic response of liquefiable sand improved by microbial-induced calcite precipitation.” Géotechnique, 63(4), 302–312.
Mortensen, B. M., Haber, M. J., Dejong, J. T., Caslake, L. F., and Nelson, D. C. (2011). “Effects of environmental factors on microbial induced calcium carbonate precipitation.” Journal of Applied Microbiology, 111(2), 338–349.
Nafisi, A., Khoubani, A., Montoya, B. M., and Evans, M. T. (2018). “The effect of grain size and shape on mechanical behavior of MICP sand I: Experimental study.” Proceedings of the 11th National Conf. in Earthquake Eng., Earthquake Eng. Research Ins., Los Angeles, (In review).
Stokoe, K. H., Lee, S. H. H., and Knox, D. P. (1985). “Shear Moduli Measurements under True Triaxial Stresses.” Adv. in the Art of Testing Soils Under Cyclic Conditions, ASCE, 166– 185.
Terzis, D., Bernier-Latmani, R., and Laloui, L. (2016). “Fabric characteristics and mechanical response of bio-improved sand to various treatment conditions.” Géotechnique Letters, 6(1).
Whiffin, V. S., Van Paassen, L. A., and Harkes, M. P. (2007). “Microbial Carbonate Precipitation as a Soil Improvement Technique.” Geomicrobiology Journal, 24, 417–423.