ABSTRACT
PHELPS, ERIN MELISSA. Polyalanine and Aβ Aggregation Kinetics: Probing Intermediate Oligomer Formation and Structure Using Computer Simulations. (Under the direction of Carol K. Hall).
The aggregation of proteins into stable, well-ordered structures known as amyloid fibrils
has been associated with many neurodegenerative diseases. Amyloid fibrils are long straight,
and un-branched structures containing several proto-filaments, each of which exhibits “cross
beta structure,” – ribbon-like layers of large beta sheets whose strands run perpendicular to the
fibril axis. It has been suggested in the literature that the pathway to fibril formation has the
following steps: unfolded monomers associate into transient unstable oligomers, the oligomers
undergo a rearrangement into the cross-β structure and form into proto-filaments, these proto
-filaments then associate and grow into fully formed fibrils. Recent experimental studies have
determined that the unstable intermediate structures are toxic tocells and that their presence
may play a key role in the pathogenesis of the amyloid diseases. Many efforts have been made
to determine the structure of intermediate oligomer aggregates that form during the
fibrillization process. The goal of this work is to provide details about the structure and
formation kinetics of the unstable oligomers that appear in the fibril formation pathway.
The specific aims of this work are to determine the steps in the fibril formation pathway
and how the kinetics of fibrillization changes with variations in temperature and concentration.
The method used is the application of discontinuous molecular dynamics to large systems of
peptides represented with an intermediate resolution model, PRIME, that was previously
Aβ17-40, and Aβ17-42; the latter two are truncated sequences of the Alzheimer’s peptide. We
simulate the spontaneous assembly of these peptide chains from a random initial configuration
of random coils.
We investigate aggregation kinetics and oligomer formation of a system of 192
polyalanine (KA14K) chains over a variety of temperatures and concentrations. The fibril
formation pathway has the following steps: free monomers associate into small amorphous
aggregates, those small amorphous aggregates grow, the amorphous aggregates rearrange into
β-sheets, and finally the β-sheets stack into small fibrillar structures. The rate of fibril
formation increases as concentrationincreases and temperature decreases; this faster fibril
formation is the combination of several effects, including increased amorphous aggregate
formation from free monomers, increased amorphous aggregate rearrangement into β-sheets,
and increased stacking into small fibrils. There is a competition between enthalpy and entropy
that determine the behavior of the final structure in the system. At low temperature, enthalpy
is dominant and the system produces multiple large fibrils, while at high temperatureentropy is
dominant and the system produces one or no large fibrils. As temperature increases and
concentration decreases the intermediate structures that form, such as β-sheets and large
independent amorphous aggregates, are more stabilized which leads to slower fibril formation
and fewer chains in the large final fibrillar structure.
We study the formation of β-sheets and small fibrillar structures for both Aβ17-40 and
Aβ17-42to determine the difference between the two sequences in aggregation kinetics and
oligomer structure as a function of temperature. We observe that at low temperatures, both
at intermediate temperatures the peptides form a mixture of β-sheets and fibrils that are
surrounded by amorphous aggregates, and at high temperatures the peptides form small
amorphous aggregates or remain isolated as free monomers. Aβ17-42forms fibrils over a larger
temperature range than Aβ17-40. The structure of the β-sheets changes as temperature
increases through the range conducive to fibril formation. Aβ17-42goes through the transition
from predominantly intra-strand hydrogen bonds to predominantly inter-strand hydrogen
Polyalanine and Aβ Aggregation Kinetics: Probing Intermediate Oligomer Formation and Structure Using Computer Simulations
by
Erin Melissa Phelps
A dissertation submitted to the Graduate Faculty of North Carolina State University
in partial fulfillment of the requirements for the degree of
Doctor of Philosophy
Chemical Engineering Raleigh, North Carolina
2011
APPROVED BY:
____________________________ __________________________
Carol K. Hall David F. Ollis
Committee Chair
____________________________ __________________________
ii
DEDICATION
iii
BIOGRAPHY
Erin Phelps was born on July 28, 1981 in Denver, CO as a surprise to her parents. She is the second daughter of Thomas and Venna Phelps and has a twin sister, Jennifer, and a younger sister, Lindsay. After spending three short years in Orlando, FL her family moved to New Jersey following her mother’s career. She attended North Warren Regional High School and graduated as valedictorian in June 1999. She then attended Rose Hulman Institute of Technology and earned her B.S. in Chemical Engineering in May 2003. While at Rose Hulman she earned a varsity letter for four years playing softball and served one year as president of the Iota student chapter of Alpha Chi Sigma. She also spent two years as a resident assistant in an upper-class dormitory attempting to teach a building full of
iv
ACKNOWLEDGEMENTS
I would like to take the time to thank everyone who made it possible for me to complete this dissertation.
First I would like to thank Professor Hall for her guidance and support throughout my graduate studies here at North Carolina State University. Without her encouragement and occasional nudges it would have taken even longer for me to finish the work presented here.
Second I would like to thank the other members of my dissertation committee, Dr. Clay Clark, Dr. Keith Gubbins, and Dr. David Ollis for their time and support during the pursuit of my PhD. I would also like to thank the faculty and staff of the Chemical and Biomolecular Engineering department at NCSU as well as Todd Marcks and Dr. David Shaffer ofthe NCSU Graduate School for administrative support during my time in Raleigh. I would especially like to thank Dr. George Roberts for the time he spent with me lending his
expertise on kinetic modeling and analysis of my data. I wish he could be here to read this; he is sorely missed.
v I would like to thank my fellow members of the Hall group for their support over the years, especially Dr. Victoria Wagoner and Johnny Maury-Evertsz. They helped me keep my balance while I was in the office and for that I will always be grateful. I would also like to thank Lauren Ridge and David Latshaw for their technical support in creating pictures and movies of my research.
Outside of research I would like to thank all of my friends and fellow competitors over the years as I participated in flag football, soccer,softball, dodgeball, and volleyball. Getting me out of the office and running around with people who do not stare at a computer screen all day kept me from getting lazy and bored. Thanks for reminding me that there are other things in life.
I would like to thank the undergraduate students I had the pleasure of teaching during my semesters as a teaching assistant. I would especially like to thank the members of the CHE 316 class in the spring of 2010 that stayed with me when I lectured as the instructorof record. They helped me keep in mind why I was pursuing my degree and that it all would be worth it in the end. I wish all of them the best of luck in their future
endeavors.
I would like to thank my cat, Loki, who kept me company on the couch over many a weekend.
vi do anything I wanted and for their willingness to let me succeed on my own. Thanks to my little sister, Lindsay, who reminded me that is was okay that not everyone loves math and science as much as I do. I would like to thank my twin sister, Jennifer, for her
vii
Table of Contents
LIST OF FIGURES ... x
LIST OF TABLES ... xiv
CHAPTER ONE ... 1
Introduction ... 1
1.1 Motivation... 1
1.2 Overview... 4
1.3 References...8
CHAPTER TWO ... 16
Structural Transitions and Oligomerization along Polyalanine Fibril Formation Pathway from Computer Simulations ... 16
2.1 Introduction...16
2.2 Materials and Methods... 24
2.3 Results...29
2.3.1 Overall Population Behavior...29
2.3.2 Structural Transitions...33
2.4 Discussion... 40
viii
2.6 List of Figures...45
2.7 References...53
CHAPTER THREE ... 59
Concentration and Temperature Effects on Polyalanine Aggregation Kinetics Using an Intermediate Resolution Model ... 59
3.1 Introduction...59
3.2 Materials and Methods...64
3.3 Results...69
3.3.1 Aggregate Population Behavior as a Function of Temperature and Concentration ...69
3.3.2 Simple Exponential Kinetic Models...75
3.3.3 Structure Transitions...79
3.4 Discussion and Conclusions...91
3.5 List of Figures...97
3.6 List ofTables... 112
3.7 References... 114
CHAPTER FOUR ... 120
Computer Simulation of Aβ Peptide Aggregation Kinetics and Structure ... 120
ix
4.2 Materials and Methods...126
4.3 Results...132
4.4 Discussion...139
4.5 List of Figures... 144
4.6 References...154
CHAPTER FIVE ... 162
Future Work ... 162
5.1 Expansion of Aggregate Definitions...163
5.2 Growth and Structural Rearrangement of Fibrils...163
5.3 Annealing Aβ Peptides...164
5.4 Improving the Kinetic and Mathematical Model...165
x
LIST OF FIGURES
Structural Transitions and Oligomerization along Polyalanine Fibril Formation Pathway from Computer Simulations
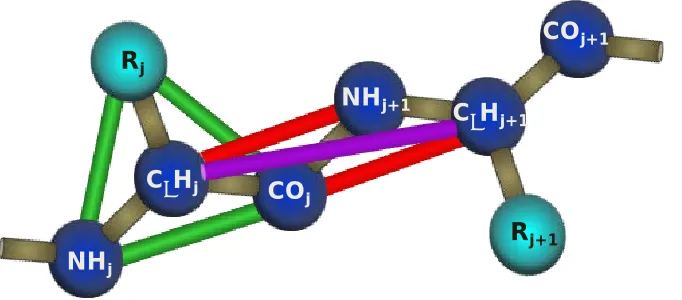
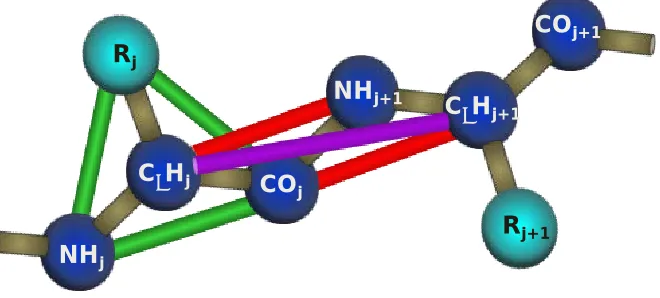
Figure 2. 1 Geometric representation of polyalanine in PRIME: The backbone united atoms are colored a dark blue while the side chain (-CH3for alanine) is colored a light blue.
Covalent bonds are in brown, pseudo-bonds that maintain L-isomerization are in green, ideal backbone angles are in red, and the transconformation are in purple. For ease of viewing atoms are not shown to scale...46 Figure 2. 2 Representation of various structures – M is a free monomer, B4is a beta sheet with four peptide chains, A5is an amorphous aggregate consisting of five peptide chains,
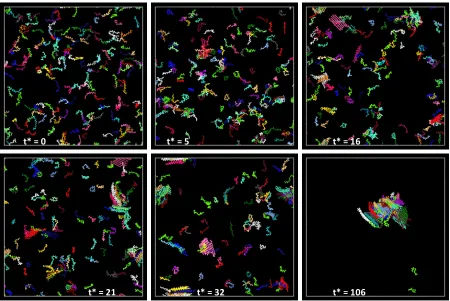
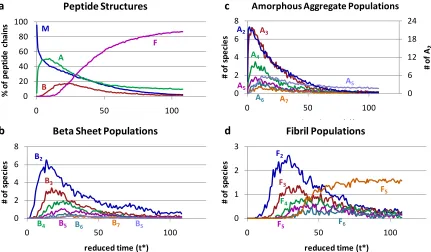
and F2is a fibril that contains two beta sheets...46 Figure 2. 3 A series of snapshots over the course of one simulation at T* = 0.13 and c = 5mM. The peptide chains are colored according to their final conformation, so that all chains in the same beta sheet at the end of the simulation are the same color; amorphous and free monomer chains are bright green...47 Figure 2. 4 Populations of Structures – (a) shows the percentage of peptide chains in each structure, (b) shows the number of amorphous aggregate of each size, (c) shows the
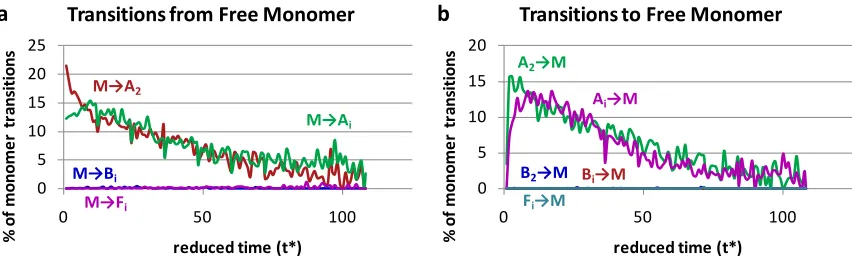
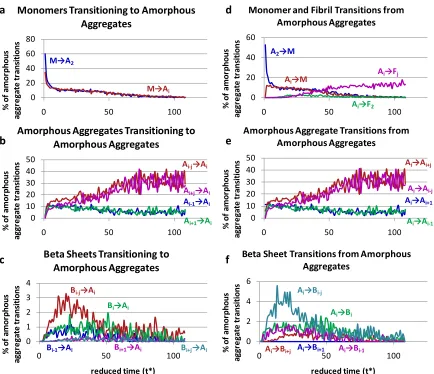
number of beta sheets of each size, and (d) shows the number of fibrils of each size...48 Figure 2. 5 (a) The percentage of chains that started as a free monomer and transitioned to a different structure, and (b) the percentage of chains that started in a different structure and transitioned to a free monomer...49 Figure 2. 6 Amorphous Aggregate Transitions: The left column shows the percentage of chains that transition to amorphous aggregates from (a) free monomers, (b) other amorphous aggregates, and (c) beta sheets as a function of simulation time; the right column shows the percentage of chains that transition from an amorphous aggregate to (d) free monomers and fibrils, (e) other amorphous aggregates, and (f) beta sheets as a
xi of simulation time; the right column shows the percentage of chains that transition from a fibril to (c) beta sheets and (d) amorphous aggregates as a function of simulation time...52
Concentration and Temperature Effects on Polyalanine Aggregation Kinetics Using an Intermediate Resolution Model
Figure 3. 1 Geometric representation of polyalanine in PRIME: The backbone united atoms are colored a dark blue while the side chain (-CH3for alanine) is colored a light blue.
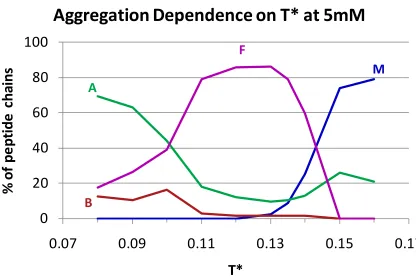
Covalent bonds are in brown, pseudo-bonds that maintain L-isomerization are in green, ideal backbone angles are in red, and the transconformation are in purple. For ease of viewing atoms are not shown to scale...99 Figure 3. 2 Temperature dependence of fibril formation for a system of polyalanine at a concentration of 5mM showing the percentages of chains that remained free monomer (M), ended up in a beta sheet (B), ended up in an amorphous aggregate (A), and formed into a fibril (F)... 100 Figure 3. 3 Monomer and Amorphous Aggregate Behavior: Monomer behavior as a
function of simulation time is shown for temperatures T* = 0.11, 0.12, 0.13, 0.135, and 0.14 at (a) c = 2.5mM, (b) c = 5mM, and (c) c = 10mM. Amorphous aggregate behavior as a function of simulation time is shown for temperatures T* = 0.11, 0.12, 0.13, 0.135, and 0.14 at (d) c = 2.5mM, (e) c = 5mM, and (f) c = 10mM... 101 Figure 3. 4 Beta Sheet and Fibril Behavior: Beta sheet behavior as a function of simulation time isshown for temperatures T* = 0.11, 0.12, 0.13, 0.135, and 0.14 at (a) c = 2.5mM, (b) c = 5mM, and (c) c = 10mM. Fibril behavior as a function of simulation time is shown for temperatures T* = 0.11, 0.12, 0.13, 0.135, and 0.14 at (d) c = 2.5mM, (e) c = 5mM, and (f) c = 10mM... 102 Figure 3. 5 Two-Step Model Results: Simulation results showing the percentage of peptide chains in a fibriland the model solutions versus reduced simulation time for each T* at a concentration of (a) c = 2.5 mM, (b) c = 5 mM, and (c) c = 10 mM. Model parameter (d) fmax,
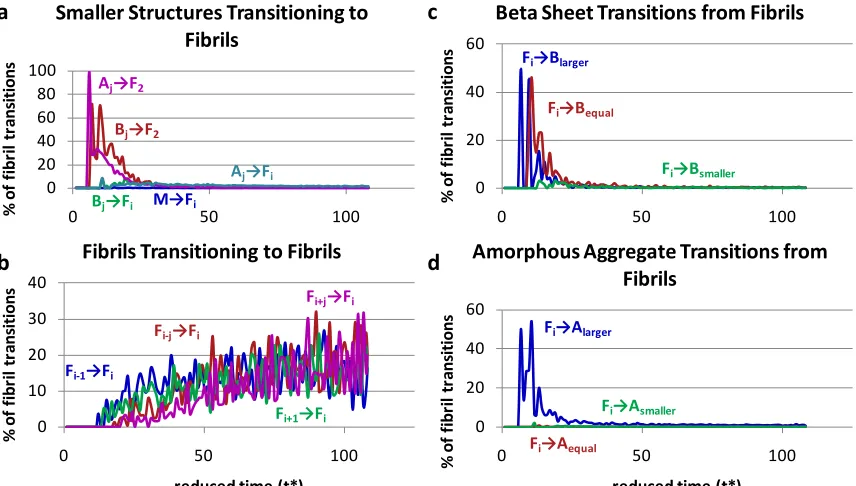
xii Figure 3. 8 Monomer Transitions at c = 5mM: Transitions (a) from A to M and (b) from M to A normalized by the monomer population for each T* as a function of reduced time...106 Figure 3. 9 Amorphous Aggregate Transitions at c = 5mM: Transitions (a) from M to A, (b) from B to A, (c) from F to A, (d) from A to M, (e) from A to B, and (f) from A to F normalized by the amorphous aggregate population for each T* as a function of reduced time...107 Figure 3. 10 Beta Sheet Transitions at c = 5mM: Transitions (a) from A to B, (b) from F to B, (c) from B to A, and (d) from B to F normalized by the beta sheet population for each T* as a function of reduced time...108 Figure 3. 11 Fibril Transitions at c = 5mM: Transitions (a) from B to F, (b) from A to F, (c) from F to B, and (d) from F to A normalized by the fibril population for each T* as a function of reduced time...109 Figure 3. 12 Transitions between amorphous aggregates and beta sheets at 5mM:
Transitions from amorphous aggregates to beta sheets where the amorphous aggregates are (a) the same size, (b) one chain larger, and (c) multiple chains larger than the beta sheets for each T* as a function of reduced time. Transitions from beta sheets to
amorphous aggregates where the beta sheets are (a) the same size, (b) one chain smaller, and (c) multiple chains smaller than the amorphous aggregates for each T* as a function of reduced time. All curves are normalized by the amorphous aggregate population... 110 Figure 3. 13 Fibril initiation transitions at 5mM: Transitions from (a) amorphous aggregates and (b) beta sheets to two sheet fibrils (F2) for each T* as a function of reduced time. Transitions to a two-sheet fibril (F2) from (c) an amorphous aggregate and (d) a beta sheet for each T* as a function of reduced time. The data in (a) is normalized by the number of chains in the amorphous aggregates, (b) is normalized by the number of chains in a beta sheet, while (c) and (d) are normalized by the number of chains in a fibril... 111
Computer Simulation of Aβ Peptide Aggregation Kinetics and Structure
Figure 4. 1 Geometry of PRIME representation ofpolyalanine: The backbone united atoms
are colored a dark blue while the side chain is colored a light blue. Covalent bonds are in brown, pseudo-bonds that maintain L-isomerization are in green, ideal backbone angles are in red, and the transconformation are in purple. For ease of viewing atoms are not shown to scale...146 Figure 4. 2 Representation of various structures – M is afree monomer, B4is a beta sheet with four peptide chains, A5is an amorphous aggregate consisting of five peptide chains,
xiii Figure 4. 3 Aβ peptide conformations as a function of temperature (T*): Figure 4a shows the final aggregate populations for the Aβ17-40sequence while 4b shows the final aggregate populations of the Aβ17-42sequence...147 Figure 4. 4 Snapshots of Aβ17-40at T* = 0.12: (a) shows the initial configuration at t* = 0; (b) shows the final configuration of chains including all 144 chains; (c) shows only the peptide chains that are in a beta sheet or fibril configuration; and (d) shows a single two-sheet fibril consisting of four chains in total, one sheet is green and the other sheet is purple...148 Figure 4. 5 Percentage of Peptide Chains in Structural Classifications: The average
xiv
LIST OF TABLES
Concentration and Temperature Effects on Polyalanine Aggregation Kinetics Using an Intermediate Resolution Model
Table 3. 1 Summary of Results for Model I – Two Step Model: The R2value is based on the of the fit for the model solution to the simulation data, the difference of squares between the model solution and the simulation data is the total difference of squares over all data points, normalized by the total number of data points at each set of conditions...113
1
CHAPTER ONE
Introduction
1.1 Motivation
Protein aggregation is an important field of study because of its impact on public health. Insoluble ordered protein aggregates known as amyloid fibrils are the hallmark of the human neurodegenerative diseases known as “amyloid diseases”, such as Alzheimer’s, Parkinson’s, and the prion diseases [1-7]and are a major concern in the production of pharmaceuticals where they can affectdrug toxicity and efficacy.[8-10] Amyloid fibrils are long straight, and un-branched structures containing several proto-filaments, each of which exhibits“cross beta structure” – ribbon-like layers of large beta sheets whose strands run perpendicular to the fibril axis.[11-14]
The formation of amyloid fibrils is widely believed to be a nucleation-driven process that starts from unfolded free monomer peptide chains that form small, relatively
unstructured intermediates which then rearrange into the cross-β structure. These ordered intermediates grow until the aggregate becomes insoluble and condenses out of
2 were the toxic species inthe amyloid diseases; however current thinking in the literature suggests that the intermediate oligomers are much more toxic and that the fibril formation process is just nature’s way of sequestering dangerous entities.[23-28] Assuming that the intermediate oligomer as the toxic species hypothesis is correct, it becomes vitally
important to discover and analyze all of the steps along the aggregation pathway from unfolded monomers to the toxic species and beyond to the fully formed fibril.
Experimental studies in this area take a variety of approaches in order to elucidate the aggregation pathway. Several studies have been published that examine the effect of solution conditions on the rate of aggregation, including changing concentration, pH, salt content, or temperature.[17, 29-35] Other experimental studies utilize inhibitors or other molecules in an attempt to identify key steps in the fibril formation pathway and control the final aggregate structure.[19, 36-38] The difficulty in relying solely on experimental
techniques for information about the steps in the fibril formation pathway is that most of the data collected is based solely on measurements of either the initial conditions, such as monomer concentrations, or on the final conditions, such as fibril concentration and structure. Recent innovations in experimental techniques have allowed measurement of the concentrations of some of the intermediate structures but there is a distinct lack of detailabout specific intermediate sizes and conformations.[39-41]
3 aggregation. When using computer simulations two decisions must be made: how to model the protein and what simulation algorithm to use to calculate particle trajectories. Several types of models for representing proteins have been published in the literature, including all-atom and intermediate resolution models.[42-49] All-atom representations of peptide sequences have been used to study portions of the aggregation pathway, but the
computational costs of keeping track of that much detail is very high.[50-55] In fact, simulations of the entire aggregation process from start to finish at an atomistic level are not within current computer capabilities. Reduced representation models of proteins vary from using one, two or four spheres to represent each amino acid in the protein sequence to using some other type of geometry to represent the backbone altogether. These reduced representation models provide a large savings in computational cost, especially if the model uses an implicit solvent representation, because they limit the number of
particles in the simulation system.[56-60] Most reduced representation models are used in conjunction with molecular dynamics (MD) simulations. TraditionalMD simulations utilize continuous energy potentials for particles in the simulation, such as a Lennard-Jones potential, and use Newton’s laws of motion to numerically calculate changes in positions and velocities for each particle at regularly spaced timeintervals.[61-62] A fast alternative to traditional MD is the use of discontinuous molecular dynamics (DMD), which uses discontinuous expression for the interaction potentials. The use of discontinuous
4 calculate changes in position and velocity for each particle in the system when a
discontinuity is reached, which greatly speeds up the computation.[63-70]
This dissertation describes research aimed at using computer simulations to provide a more detailed understanding of protein aggregation and the kinetic pathway of amyloid fibril formation. We use a molecular level reduced representation protein model with implicitsolvent (PRIME) that has been found to capture accurate structural details for aggregated proteins.[71-77] DMD was chosen because the speed of the algorithm allows us to capture the entire self-assembly process of our model peptides.
1.2 Overview
In this section a summary of the rest of the dissertation is provided. All chapters provide their own literature review and references.
5 aggregate into small amorphous aggregates, (2) these small amorphous aggregates grow by monomer or oligomer addition into large amorphous aggregates, (3) the large amorphous aggregates undergo a structural rearrangement into a beta sheet, (4) beta sheets grow by monomer or oligomer addition into larger beta sheets, (5) the beta sheets stack into small fibril structures, and (6) the fibrils growby the addition of one or more sheets until the simulation contains one or two large fibrils. At the end of the simulations the final structure is composed of one or two large fibrils with more than six beta sheets stacked together; approximately 90% of the peptide chains are associated with the large fibrils. This pathway for fibril formation is in agreement with results published in the literature.
6 change with variations in temperature and concentration with respect to time are analyzed in detail in this chapter.
Chapter 4 describes our results from studying the formation of beta sheets and small fibrils by fragments of the Alzheimer’s peptide, Aβ. Simulations of 144 chains of either Aβ17
-40or Aβ17-42peptides were conducted starting from random coil configurations and ending in an apparent steady state configuration that includes amorphous aggregates, beta sheets, and small fibrils. Results from thirty replicate simulations at a concentration of c = 5mM and temperatures of T* = 0.10, 0.11, and 0.12 were averaged together to provide detailed population information and specific transitions between intermediates that form along the aggregation pathway. Our findings are in agreement with published literature indicating that the structure of the beta sheets is coiled at lower temperatures and more elongated at higher temperatures. As temperature increases the beta sheet conformation shifts from a structure that contains two turns within the peptide backbone to a structure that contains either no turn or one turn within a single peptide chain.
Chapter 5 provides suggestions for future work on the Aβ sequence as well as possible applications for the kinetic analysis.
Chapters 2, 3, and 4 are based on the following publications.
Chapter 2: E. M. Phelps and C. K. Hall, “Structural Transitions and Oligomerization along the Polyalanine Fibril Formation Pathway from Computer Simulations”, in
7 Chapter 3: E. M. Phelps and C. K. Hall, “Concentration and Temperature Effects on Polyalanine Aggregation Kinetics Using an Intermediate Resolution Model”, in preparation.
Chapter 4: E. M. Phelps and C. K. Hall, “Computer Simulation of Aβ Peptide
8 1.3 References
1. Carrell, R.W. and D.A. Lomas, Conformational disease.Lancet, 1997. 350(9071): p. 134-138.
2. Chiti, F. and C.M. Dobson, Protein misfolding, functional amyloid, and human
disease.Annual Review of Biochemistry, 2006. 75: p. 333-366.
3. Cohen, F.E., Protein misfolding and prion diseases.Journal of Molecular Biology, 1999. 293(2): p. 313-320.
4. Dobson, C.M., Protein misfolding, evolution and disease.Trends in Biochemical
Sciences, 1999. 24(9): p. 329-332.
5. Koo, E.H., P.T. Lansbury, and J.W. Kelly, Amyloid diseases: Abnormal protein
aggregation in neurodegeneration.Proceedings of the National Academy of Sciences of the United States of America, 1999. 96(18): p. 9989-9990.
6. Soto, C., Protein misfolding and disease; protein refolding and therapy.FEBS Letters, 2001. 498(2-3): p. 204-207.
7. Walsh, D.M. and D.J. Selkoe, A beta Oligomers - a decade of discovery.Journal of Neurochemistry, 2007. 101(5): p. 1172-1184.
8. Bratko, D., et al., Molecular simulation of protein aggregation.Biotechnology and Bioengineering, 2007. 96(1): p. 1-8.
9. Calloni, G.,et al., Investigating the effects of mutations on protein aggregation in the cell.Journal of Biological Chemistry, 2005. 280(11): p. 10607-10613.
10. Cellmer, T., et al., Thermodynamics of folding and association of lattice-model proteins.Journal of Chemical Physics, 2005. 122(17).
9 12. Serpell, L.C., et al., The protofilament substructure of amyloid fibrils.Journal of
Molecular Biology, 2000. 300(5): p. 1033-1039.
13. Sunde, M. and C. Blake, The structure of amyloid fibrils by electron microscopy and X-ray diffraction, in Advances in Protein Chemistry, Vol 50. 1997, Academic Press Inc: San Diego. p. 123-159.
14. Sunde, M., et al., Common core structure of amyloid fibrils by synchrotron X-ray diffraction.Journal of Molecular Biology, 1997. 273(3): p. 729-739.
15. Auer, S., C.M. Dobson, and M. Vendruscolo, Characterization of the nucleation
barriers for protein aggregation and amyloid formation.Hfsp Journal, 2007. 1(2): p. 137-146.
16. Auer, S., et al., A Generic Mechanism of Emergence of Amyloid Protofilaments from
Disordered Oligomeric Aggregates.Plos Computational Biology, 2008. 4(11). 17. Cellmer, T., et al., Kinetic studies of protein L aggregation and disaggregation.
Biophysical Chemistry, 2007. 125(2-3): p. 350-359.
18. Chiti, F. and C.M. Dobson, Amyloid formation by globular proteins under native conditions.Nature Chemical Biology, 2009. 5(1): p. 15-22.
19. Davis, T.J., et al., Comparative Study of Inhibition at Multiple Stages of Amyloid-beta Self-Assembly Provides Mechanistic Insight.Molecular Pharmacology, 2009. 76(2): p. 405-413.
20. Gustafsson, M., et al., Amyloid fibril formation by pulmonary surfactant protein C.
FEBS Letters, 1999. 464(3): p. 138-142.
21. Lee, C.C., et al., A three-stage kinetic model of amyloid fibrillation.Biophysical Journal, 2007. 92(10): p. 3448-3458.
22. Lee, S., E.J. Fernandez, and T.A. Good, Role of aggregation conditions in structure, stability, and toxicity of intermediates in the A beta fibril formation pathway.Protein Science, 2007. 16(4): p. 723-732.
10 24. Gonzalez-Velasquez, F.J., J.A. Kotarek, and M.A. Moss, Soluble aggregates of the
amyloid-beta protein selectively stimulate permeability in human brain
microvascular endothelial monolayers.Journal of Neurochemistry, 2008. 107(2): p. 466-477.
25. Gonzalez-Velasquez, F.J. and M.A. Moss, Soluble aggregates of the amyloid-beta protein activate endothelial monolayers for adhesion and subsequent transmigration of monocyte cells.Journal of Neurochemistry, 2008. 104(2): p. 500-513.
26. Kayed, R., et al., Annular Protofibrils Are a Structurally and Functionally Distinct Type of Amyloid Oligomer.Journal of Biological Chemistry, 2009. 284(7): p. 4230-4237. 27. Kelly, J.W., Amyloid fibril formation and protein misassembly: A structural quest for
insights into amyloid and prion diseases.Structure, 1997. 5(5): p. 595-600.
28. Ono, K., M.M. Condron, and D.B. Teplow, Structure-neurotoxicity relationships of amyloid beta-protein oligomers.Proceedings of the National Academy of Sciences of the United States of America, 2009. 106(35): p. 14745-14750.
29. Chen, S.M., F.A. Ferrone, and R. Wetzel, Huntington's disease age-of-onset linked to polyglutamine aggregation nucleation.Proceedings of the National Academy of Sciences of the United States of America, 2002. 99(18): p. 11884-11889.
30. Guo, M., et al., Charge substitution shows that repulsive electrostatic interactions impede the oligomerization of Alzheimer amyloid peptides.FEBS Letters, 2005. 579(17): p. 3574-3578.
31. Knowles, T.P.J., et al., Kinetics and thermodynamics of amyloid formation from direct measurements of fluctuations in fibril mass.Proceedings of the National Academy of Sciences of the United States of America, 2007. 104(24): p. 10016-10021.
32. Kotarek, J.A., K.C. Johnson, and M.A. Moss, Quartz crystal microbalance analysis of growth kinetics for aggregation intermediates of the amyloid-beta protein.Analytical Biochemistry, 2008. 378(1): p. 15-24.
11 34. Uversky, V.N., J. Li, and A.L. Fink, Metal-triggered structural transformations,
aggregation, and fibrillation of human alpha-synuclein - A possible molecular link between Parkinson's disease and heavy metal exposure.Journal of Biological Chemistry, 2001. 276(47): p. 44284-44296.
35. Wang, S.S.S., etal., A kinetic study on the aggregation behavior of beta-amyloid peptides in different initial solvent environments.Biochemical Engineering Journal, 2006. 29(1-2): p. 129-138.
36. Gibson, T.J. and R.M. Murphy, Inhibition of insulin fibrillogenesis with targeted peptides.Protein Science, 2006. 15(5): p. 1133-1141.
37. Necula, M., et al., Methylene blue inhibits amyloid A beta oligomerization by promoting fibrillization.Biochemistry, 2007. 46(30): p. 8850-8860.
38. Necula, M., et al., Small molecule inhibitors of aggregation indicate that amyloid beta oligomerization and fibrillization pathways are independent and distinct.
Journal of Biological Chemistry, 2007. 282(14): p. 10311-10324.
39. Ahmed, M., et al., Structural conversion of neurotoxic amyloid-beta(1-42) oligomers to fibrils.Nature Structural & Molecular Biology, 2010. 17(5): p. 561-U56.
40. Bitan, G., et al., Amyloid beta-protein (A beta) assembly: A beta 40 and A beta 42 oligomerize through distinct pathways.Proceedings of the National Academy of Sciences of the United States of America, 2003. 100(1): p. 330-335.
41. Glabe, C.G., Structural Classification of Toxic Amyloid Oligomers.Journal of Biological Chemistry, 2008. 283(44): p. 29639-29643.
42. Broglia, R.A., et al., Folding and aggregation of designed proteins.Proceedings of the National Academy of Sciences of the United States of America, 1998. 95(22): p. 12930-12933.
43. Dima, R.I. and D. Thirumalai, Exploring protein aggregation and self-propagation using lattice models: Phase diagram and kinetics.Protein Science, 2002. 11(5): p. 1036-1049.
44. Go, N. and H. Taketomi, RESPECTIVE ROLES OF SHORT-RANGE AND LONG-RANGE
12 45. Gupta, P., C.K. Hall, and A.C. Voegler, Effect of denaturant and protein
concentrations upon protein refolding and aggregation: A simple lattice model.
Protein Science, 1998. 7(12): p. 2642-2652.
46. Harrison, P.M., et al., Conformational propagation with prion-like characteristics in a simple model of protein folding.Protein Science, 2001. 10(4): p. 819-835.
47. Kolinski, A., J. Skolnick, and R. Yaris, MONTE-CARLO SIMULATIONS ON AN
EQUILIBRIUM GLOBULAR PROTEIN FOLDING MODEL.Proceedings of the National Academy of Sciences of the United States of America, 1986. 83(19): p. 7267-7271. 48. Rochet, J.C. and P.T. Lansbury, Amyloid fibrillogenesis: themes and variations.
Current Opinion in Structural Biology, 2000. 10(1): p.60-68.
49. Yang, S.C., H. Levine, and J.N. Onuchic, Protein oligomerization through domain swapping: Role of inter-molecular interactions and protein concentration.Journal of Molecular Biology, 2005. 352(1): p. 202-211.
50. Brooks, B.R., et al., CHARMM - A PROGRAM FOR MACROMOLECULAR ENERGY,
MINIMIZATION, AND DYNAMICS CALCULATIONS.Journal of Computational Chemistry, 1983. 4(2): p. 187-217.
51. Klimov, D.K. and D. Thirumalai, Dissecting the assembly of A beta(16-22) amyloid peptides into antiparallel beta sheets.Structure, 2003. 11(3): p. 295-307.
52. Liwo, A., et al., United-residue force field for off-lattice protein-structure simulations: III. Origin of backbone hydrogen-bonding cooperativity in united-residue potentials.
Journal of Computational Chemistry, 1998. 19(3): p. 259-276.
53. Ma, B.Y. and R. Nussinov, Stabilities and conformations of Alzheimer's beta-amyloid peptide oligomers (A beta(16-22 ') A beta(16-35 ') and A beta(10-35)): Sequence effects.Proceedings of the National Academy of Sciences of the United States of America, 2002. 99(22): p. 14126-14131.
54. Weiner, S.J., et al., A NEW FORCE-FIELD FOR MOLECULAR MECHANICAL SIMULATION
13
55. Weiner, S.J., et al., AN ALL ATOM FORCE-FIELD FOR SIMULATIONS OF PROTEINS AND
NUCLEIC-ACIDS.Journal of Computational Chemistry, 1986. 7(2): p. 230-252. 56. Clark, L.A., Protein aggregation determinants from a simplified model: Cooperative
folders resist aggregation.Protein Science, 2005. 14(3): p. 653-662.
57. Fawzi, N.L., et al., Influence of denatured and intermediate states of folding on protein aggregation.Protein Science, 2005. 14(4): p. 993-1003.
58. Honeycutt, J.D. and D. Thirumalai, METASTABILITY OF THE FOLDED STATES OF
GLOBULAR-PROTEINS.Proceedings of the National Academy of Sciences of the United States of America, 1990. 87(9): p. 3526-3529.
59. Wallqvist, A. and M. Ullner, A SIMPLIFIED AMINO-ACID POTENTIAL FOR USE IN
STRUCTURE PREDICTIONS OF PROTEINS.Proteins-Structure Function and Genetics, 1994. 18(3): p. 267-280.
60. Wilson, C. and S. Doniach, A COMPUTER-MODEL TO DYNAMICALLY SIMULATE
PROTEIN FOLDING - STUDIES WITH CRAMBIN.Proteins-Structure Function and Genetics, 1989. 6(2): p. 193-209.
61. Combe, N. and D. Frenkel, Simple off-lattice model to study the folding and aggregation of peptides.Molecular Physics, 2007. 105(4): p. 375-385.
62. Gsponer, J., U. Haberthur, and A. Caflisch, The role of side-chain interactions in the early steps of aggregation: Molecular dynamics simulations of an amyloid-forming peptide from the yeast prion Sup35.Proceedings of the National Academy of Sciences of the United States of America, 2003. 100(9): p. 5154-5159.
63. Ding, F., et al., Mechanism for the alpha-helix to beta-hairpin transition.Proteins -Structure Function and Genetics, 2003. 53(2): p. 220-228.
64. Ding, F., et al., Ab initio folding of proteins with all-atom discrete molecular dynamics.Structure, 2008. 16(7): p. 1010-1018.
14 66. Urbanc, B., et al., Elucidation of Amyloid beta-Protein Oligomerization Mechanisms:
Discrete Molecular Dynamics Study.Journal of the American Chemical Society, 2010. 132(12): p. 4266-4280.
67. Urbanc, B., et al., Ab initio discrete molecular dynamics approach to protein folding and aggregation, in Amyloid, Prions, and Other Protein Aggregates, Pt B. 2006. p. 314-338.
68. Urbanc, B., et al., Molecular dynamics simulation of amyloid beta dimer formation.
Biophysical Journal, 2004. 87(4): p. 2310-2321.
69. Urbanc, B., et al.,In silico study of amyloid beta-protein folding and oligomerization.
Proceedings of the National Academy of Sciences of the United States of America, 2004. 101(50): p. 17345-17350.
70. Zhou, Y.Q. and M. Karplus, Folding thermodynamics of a model three-helix-bundle
protein.Proceedings of the National Academy of Sciences of the United States of America, 1997. 94(26): p. 14429-14432.
71. Nguyen, H.D. and C.K. Hall, Molecular dynamics simulations of spontaneous fibril formation by random-coil peptides.Proceedings of the National Academy of Sciences of the United States of America, 2004. 101(46): p. 16180-16185.
72. Nguyen, H.D. and C.K. Hall, Phase diagrams describing fibrillization by polyalanine peptides.Biophysical Journal, 2004. 87(6): p. 4122-4134.
73. Nguyen, H.D. and C.K. Hall, Kinetics of fibril formation by polyalanine peptides.
Journal of Biological Chemistry, 2005. 280(10): p. 9074-9082.
74. Nguyen, H.D. and C.K. Hall, Spontaneous fibril formation by polyalanines;
Discontinuous molecular dynamics simulations.Journal of the American Chemical Society, 2006. 128(6): p. 1890-1901.
75. Nguyen, H.D., A.J. Marchut, and C.K. Hall, Solvent effects on the conformational transition of a model polyalanine peptide.Protein Science, 2004. 13(11): p. 2909 -2924.
15 77. Smith, A.V. and C.K. Hall, alpha-helix formation: Discontinuous molecular dynamics
16
CHAPTER TWO
Structural Transitions and Oligomerization along Polyalanine Fibril Formation
Pathway from Computer Simulations
2.1 Introduction
17 determine the pathway that a protein takes in going from a natively-folded or unfolded state to the toxic state and beyond in order to discover the best way to interfere with and/or inhibit the toxic events.
The general consensus in the protein aggregation community concerning the sequence of events along the fibril formation pathway is the following. Partially or totally unfolded monomer peptides aggregate into small intermediate oligomers that are unstable and transient in nature. These oligomers rearrange into an organized conformation
containing the cross beta structure and then associate into proto-filaments and finally into full fibrils.[5, 13, 19-23] Recent studies have suggested that toxic intermediate oligomers may form as a side reaction to fibril formation, which means that it might be possible to prevent the formation of the toxic intermediate species without disrupting the overall fibril formation process.[24-26]
The goal of this work is to provide insights into the pathway that proteins follow as they evolve from monomers through intermediates to proto-filaments. The method used is molecular-level computer simulations, which offers the opportunity to observe the
18 information about aggregation kinetics gleaned from analyses of experimental data is indirect or inferred; typically the only data recorded are the concentrations of free monomers and fully formed fibrils, i.e.the starting and ending points of the proposed pathways. There are many different hypotheses in the literature concerning the number and type of intermediates along the aggregation pathway, but these cannot be confirmed directly due to the difficulty ofmeasuring the populations of the various intermediates over time.[31-33] Most of the proposedaggregation pathways progress from free monomers to small unstable oligomeric species to protofilaments composed of elongated beta sheets to fully formed fibrils.[13]
One way to extract information on aggregation pathways from experimental kinetics data is to assume a reaction mechanism, derive the associated set of reaction equations and then fit the various rate constants to population data.[22-23, 34-36] The most popular reaction mechanism appearing in the literature is nucleated polymerization in which monomers slowly and reversibly come together to form small, energetically unstable intermediates that serve as a nucleus. Once the nucleusis formed monomers quickly and irreversibly attach themselves to the aggregate which continues to grow, eventually forming proto-filaments that then laterally associate into fibrils.[23,37-39] Another oft-assumed
reaction mechanism is monomer-directed conversion in which a monomer undergoes a
19 structure that eventually grows into a fibril.[40-41] A third proposed mechanism in the literature is templated assembly, in which a native state monomer binds to a pre-existing fibrillar structure and then undergoes a structural transition to a fibrillar conformation. [42-44] It is difficult to decide which of the proposed mechanisms is better or more accurate than the others since there is limited information available about the intermediate structures, as discussed indetail by Bernacki and Murphy.[45]
Another way to extract information on aggregation pathways from kinetics data is to prevent specific reactions from occurring by using targeted inhibitors or other constraints to block formation of the intermediates that are expected to occur along that pathway. Examples of the types of structures that might be inhibited include small pre-fibrillar structures, fully formed fibrils, and certain types of oligomers.[25-26, 41, 46] In this way, one determines which of the small intermediate aggregates that are formed during the fibrillization process are truly necessary steps in the kinetic pathway, and which are side reactions that could be minimized. Knowing whether the toxic intermediates are necessary on-path species, or competitive side-path species helps us to come up with specific targets for drugs or other treatment options.[15, 24-26]
20 intermediate, an intermediate that is a stepping stone to fibril formation, and an
intermediate that rearranges into a spherical oligomer which can but does not easily proceed to form fibrils. Spherical oligomers have been found to be much more toxic than either of the other two types of intermediates.[15, 25-26]
One part of the kinetic pathway that has received a fair amount of attention is the collapse of a single peptide into an amorphous globular state and its subsequent
rearrangement to form cross-beta structure. Pappu and coworkers used computer simulations to examine the initial steps of polyglutamine aggregation. They found that single polyglutamine peptides collapse into amorphous globules that associate with other collapsed peptides as a first step in the aggregation pathway.[47-49] Krishnan and Lindquist showed that long yeast prion sequences collapse into amorphous domains that have
hydrophobic (head) or hydrophilic (tail) content much like micelles. The conformations of
the peptides withinthe head region of the collapsed amorphous domainbecome more
21 quantified, it could lead to new insights into the aggregation pathway and the pathogenic processes underlying the amyloid these diseases.
In this paper we analyze the kinetics from computer simulations of the spontaneous aggregation of a large system of polyalanine (KA14K) chains in order to determine the types and quantities of intermediate species that appear during the fibril formation process. Polyalanine was chosen as the model peptide because it is known to form fibrilsin vitro
under slightly denatured concentrated conditions.[52] Previous simulations performed in our group on a system of 48 polyalanine chains using a combination of discontinuous molecular dynamics (DMD) simulations and our intermediate resolution protein model (PRIME) resulted in the spontaneous formation of fibrillar structures (protofilaments) whose physical characteristics were in reasonably good agreement with experimental results.[29, 53-55] In this paper we perform new simulations on a much larger system (192 chains) in order to get detailed information on the kineticsof protein aggregation with particular focus on the formation of intermediate structures, including amorphous aggregates, along the aggregation pathway. Each simulation was started in a random
configuration of random coils at a concentration of 5mM and areduced temperature of
T*=0.13, a temperature that was shown to produce a large population of well-ordered fibrils at this concentration in previous studies. The simulations were run until
22 recorded at regular time intervals, leading to the classification of each chain at each time as being in a particular “aggregation state”: free monomer, amorphous aggregate containing x chains, beta sheet containing y chains, or fibril (proto-filament) containing m sheets with z chains. The sequence of aggregation states occupied by each chain over the course of the simulations was used to analyze the aggregation process, and summarized in terms of population data (fraction of peptides in each state) and transitions from one state to another as a function of time.
Highlights of our results include the following. The general picture of the aggregation pathway for large systems of KA14K peptidesthat has emerged from these simulations is the following. Initially, individual free monomer chains associate together into small and intermediate-sized amorphous aggregates. Theseaggregates reconfigure themselves into small beta sheetswhich then associate into fibrils that grow and finally associate into one large fibrillar structure. The most common sizes of the intermediate amorphous aggregates and beta sheets are between two and seven chains, while the size of the fibrils grows from initially less than ten chains to around 150 chains in the final
structure. Few free monomers, amorphous aggregates, or independent beta sheets remain at the end of the simulation. The amorphous aggregates and small beta sheets that form during the simulation are all necessary steps along the aggregation pathway. The
23 about the same time as the peak in the beta sheet population. These observations indicate that there is a natural progression from free monomers to amorphous aggregates to beta sheets to fibrils.
Analysis of the transitions from one aggregation state to another shows that the amorphous aggregates reorganize into beta sheets twice as often as the beta sheets collapse into amorphous aggregates. This leads to the conclusion that the restructuring of amorphous aggregates into beta sheets plays a key role in the fibrillization mechanism; this is hypothesized to be the nucleation step in the literature.[23, 37, 50] The small
intermediate amorphous aggregates are unstable under these simulation conditions; at the end of the simulation we see a number of peptides that are classified as being in an
24 fibrillar structures is consistent with experimental results published in the literature.[11-12, 16, 44]
2.2 Materials and Methods
We performed computer simulations of a system of 192 chains comprised of the peptide KA14K, each starting from a different initial random configuration. The peptide geometry and force field were modeled using PRIME, an intermediate resolution protein model developed in the Hall group.[29, 53-57] Each peptide residue is represented by four spheres; one for the carbonyl carbon and its associated oxygen atom, one for the amide nitrogen and its associated hydrogen atom, one for the alpha carbon and its associated hydrogen atom, and one for the side chain atoms. Figure 2.1 shows a schematic of the PRIME protein geometry. Each united atom is attached to the next with a covalent bond of a realistic length taken from the literature. The geometry of the peptide chain is
maintained by imposing pseudo-bonds between the united atom spheres that restrict the backbone bond angles to realistic values, maintain the peptide bond in the trans
conformation and ensure the L-isomerization of the side chain.
25 sphere potential with a realistic diameter. The lengths of all covalent bonds and pseudo -bonds are allowed to fluctuate within a tolerance of 2.375% by setting up hard sphere repulsions any time the length of the bond attempts to move outside of the range of
𝑙(1− 𝛿)to 𝑙(1 +𝛿)where 𝑙is the ideal length of the bond and 𝛿is the tolerance. PRIME accounts for the two most basic types of inter- and intra- peptide interactions: hydrogen bonding and hydrophobic interactions. Hydrogen bonding is
modeled as a square well attraction potential of depth εHBbetween the carbonyl and amide
spheres on the same and neighboring chains when the following criteria are met: (1) the virtual amide hydrogen and carbonyl oxygen atoms are separated by 4.2Å, (2) the vectors associated with the nitrogen-hydrogen and carbon-oxygen bonds point towards each other within a generous tolerance, (3) neither united atom is involved in a hydrogen bond with a different partner, and (4) the united atoms are separated by at least three residues if they are on the same chain. The second criterion is implemented by introducing square shoulder repulsions between the surrounding auxiliary pairs NHi - CαH,j, NHi – NHj+1, COj –
COi-1, COj - CαH,ito maintain an ideal hydrogen bonding angle.[58] Hydrophobic interactions
are captured in this model by a square well attraction of depth εHPand width 1.5σRbetween
hydrophobic side chain united atoms (where σRis the side chain sphere diameter) provided that they are on separate chains or at least three residues apart on the same chain. The reduced simulation temperature is scaled with the hydrogen bond strength, 𝑇∗= 𝑘
𝐵𝑇 ϵ⁄ HB,
26 hydrophobic attraction and hydrogen bond,𝑅 =𝜀𝐻𝑃⁄ 𝜀𝐻𝐵 is set here to R = 0.10as in our
previous simulations of polyalanine.[29, 53-55, 59]
Thesimulations are performed using discontinuous molecular dynamics (DMD), an
27 All of the simulations are carried out in the canonical ensemble, where the number of particles, the temperature, and the volume of the simulation are held constant. The box length of the cubic simulation cell was set at 399.6Å in order to create the desired
concentration of 5mMfor the 192 KA14K peptides. Periodic boundary conditions were
implemented to eliminate any artifacts due to thesimulation box walls. The temperature is held constant using the Andersen thermostat, which utilizes ghost collisions with random particles in the system to maintain the Maxwell-Boltzmann velocity distribution about the desired system temperature.[64] The simulation time is measured in terms of a reduced
time units, 𝑡∗ = 𝑡 �𝜎�𝑘
𝐵𝑇 𝑚⁄ �
⁄ , where t is the simulation time and σand m are the
average sphere diameter and mass respectively. Since DMD is driven by collisions, not pre -determined time steps, and there are no solvent particles, it is difficult to relate the reduced time to a real time scale. All results will be given in terms of reduced simulation time.
Thirty simulation runs were performed starting from a different random initial configuration and the results were averaged together. Over the course of each simulation the
populations of different structures such as free monomer chains, beta sheets of specific sizes, amorphous aggregates of specific sizes, and fibrils were recorded as a function of time.
28 Figure 2.2 shows snapshots of each of the four classes of structures. A free monomer is defined to be any chain that has no interaction, either hydrophobic or hydrogen bonding, with another chain in the system. A beta sheet is defined to be a set of two or more peptide chains that have at least eight hydrogen bonds (half of the chain length) between each pair of neighboring chainsin the sheet. (Hydrophobic contacts are not considered when determining beta sheets.) Fibrils are defined to be beta sheets with at least three hydrophobic interactions between two different pairs of chains in the beta sheets, for a total of at least six hydrophobic contacts. A chain is defined as part of an amorphous aggregate if it has either hydrophobic interactions or hydrogen bonding interactions with another chain but does not fall under either the beta sheet or fibril classification.
Over the course of the simulation the populations for free monomers (M), beta sheets containing two (B2), three (B3), four (B4), five (B5), six (B6), seven (B7), and more than
seven chains (BS), fibrils containing two (F2), three (F3), four (F4), five (F5), six (F6), and more
than six beta sheets (FS), and amorphous aggregates containing two (A2), three (A3), four
(A4), five (A5), six (A6), seven (A7), and more than seven (AS) chains were recorded as a
function of simulation time. In order to prevent double counting, chains are classified according to the most ordered structure they belong to, so that for example a chain classified as being part of a fibril would not also be classified as being part of a beta sheet.
In addition to recording population data, each individual chain is given an
29 which it belongs. Free monomer chains are given an identification label that signifies that they are not interacting with any other chains at that specific simulation time. Chains in a beta sheet are given an identification label that indicates how many chains are in that specific beta sheet. Chains within a fibril are given an identification label that indicates how many sheets are in the fibril, how many total chains are in the fibril, and how many chains are in the individual beta sheet that contains that particular chain. Chains within an
amorphous aggregate are given an identification label that indicates how many chains are in that aggregate; this total number of chains for the aggregate can include both the chains classified as amorphous and the chains found in ordered structures such as beta sheets or fibrils with which the amorphous chains are interacting. All of this information allows us to track the progress of individual chains and make determinations as to how particular intermediate structures form and change throughout the simulation. By keeping track of the changes in chain identification labels as a function of time, it is possible to determine how certain intermediates form and dissociate or grow into larger structures.
2.3 Results
2.3.1 Overall Population Behavior
30 5mM were performed and the results were averaged together. Figure 2.3 displays the snapshotsat various times from one typical simulation to illustrate the fibrillization
pathway. At time t* = 0, the system is a configuration of random coils; the peptides are not interacting with each other. At time t* = 5 the system shows the formation of small
amorphous aggregates. As the simulation progresses, these amorphous aggregates rearrange into beta sheets, shown at t* = 16, which then associate into small fibrils consisting of two sheets and between eight to ten chains (see t* = 21). These fibrils then continue to grow (see t* = 32) and add beta sheets throughout the simulation until most of the peptide chains organize into a large structureconsisting of about 165 chains, shown at t* = 106. At this point in the simulation the peptides are rearranging within the large structure in order to minimize the free energy of the system. Since we are interested in the formation of the fibril and not in its restructuring, we stopped the simulation at t* = 106. At the end of this particular simulation, there is one large fibril with a total of 165 chains; the remaining peptides are either free monomers or are attached to the fibril amorphously and not included in a beta sheet.
Figure 2.4 contains population data averaged over the thirty simulationsas a
31 Figure 2.4d shows the number of fibrils containing a specific number of beta sheets.
Populations less than one in Figures 2.4b, 2.4c, and 2.4d are possible because these results are an average over thirty different simulations. That means that if fifteen of the
simulations exhibit a single five-chain beta sheet at a particular time and the other fifteen don’t, at that time the population of a five chain beta sheet (B5) will register as 0.5.
As Figure 2.4a indicates, the system starts with free monomerat time t* = 0 and rapidly forms amorphous aggregates, whose population peaks and then declines; this is accompanied by the slow formation of beta sheets, and then the appearance of fibrils once the beta sheet population peaks. The fibrils grow steadily as the populations of all other aggregation states diminish until the system reaches a point where approximately 90% of the chains are in a fibril and the system seems to stabilize. Throughout the simulation there are always more chains in amorphous aggregates than in individual beta sheets, which indicates that the single (isolated) beta sheet conformation is less favorable than the amorphously aggregated conformation. Instead of remaining isolated, the single beta sheets stack to form fibrils which are then stabilized by the hydrophobic interactions. This makes sense because amorphous aggregates can collapse and protect the hydrophobic side chains, while individual beta sheets leave all of the side chains exposed to solvent.
32 simulation are most likely to be small; over 20 amorphous aggregates contain two chains (A2). All of the amorphous aggregate populations exhibit a peak before t* = 25, and as the size of the amorphous aggregate increases, the population decreases. The aggregation state ASrefers toany amorphous aggregates with more than seven total chains and so its peak exceeds that of the intermediate size aggregates. As we saw in Figure 2.4a the beta sheet population begins to grow as the amorphous aggregate population begins to
diminish. Figure 2.4c shows that the dimer population (B2) peaks around t* = 20, followed quickly by trimers (B3) at t* = 25 and tetramers (B4) at t* = 30. Larger beta sheets containing
five or more chains (B5, B6, B7, and BS) do appear in the simulations, but they do not do so at
the same time in every simulation, so the population curves remain at or below one over the course of the simulation. At approximately t* = 25 the total beta sheet population goes through a peak (seen in Figure 2.4a), and thereafter individual beta sheets begin to
disappear (Figure 2.4c) as fibrils begin to form and grow. Figure 2.4d shows that multiple small fibrils of either two (F2) or three (F3) sheets appear first in the simulations. These
33
2.3.2 Structural Transitions
The information that we record on the aggregation state of each chain over the course of the simulations can be used to learn more about how the different types of aggregates form, grow and diminish as a function of time. The transitions from one type of aggregation state to another have been broken down into four categories, those that start from or result in a free monomer M (Figure 2.5), those that start from or result in an
amorphous aggregate A (Figure 2.6), those that start from or result in a beta sheet B (Figure 2.7), and those that start from or result in a fibril F (Figure 2.8). The y-axis in each figure, percentage of a particular type of transition, is the number of transitions of that particular type divided by the total number of peptide chains that are in the same starting (or ending) overall aggregation state. So for example at any one time, the percentages of transitions
that result in an amorphous aggregate from free monomers (M →A), from amorphous
aggregates (A → A), from beta sheets (B → A), and from fibrils (F → A) add up to 100%. This means that direct comparison of percentage values from one figure to another is not
34 such as a free monomer remaining a free monomer, are recorded and included in the normalization, but not shownfor clarity.
Figure 2.5 shows the percentage of transitions that start from and or end up in the free monomer state. Figure 2.5a shows the transitions from free monomer to aggregation states A2, Ai(i > 2), Bi(i ≥ 2), and Fi(i ≥ 2). It is apparent that free monomers associate almost exclusively to form amorphous aggregates. We do see free monomers adding onto existing beta sheets or fibrils, but these transitions do not occur often; those that do are hidden in the noise since the results are averaged over thirty simulations. Figure 2.5b shows transitions that result in free monomer starting from A2, Ai, B2, Bi(i > 2) and Fi(i >2). Most of the transitions that produce a free monomer result from an amorphous aggregate losing a chain, either through dissolution of an amorphous aggregate with two chains (A2), or loss of a single chain from a larger amorphous aggregate (Ai). Events in which a single chain breaks off from an existing beta sheet or a fibril do not occur with any regularity, so the fewtimes this happens become noise in the average. Since the individual simulations do show that peptides can release from amorphous aggregates, beta sheets, and fibrils, it indicates that the aggregation pathway is reversible. At this particular temperature
35 Figure 2.6 shows the percentage of transitions that start from or end up in an
amorphous aggregate including: the percentage of transitions that start from (a) free
monomer, (b) different amorphous aggregates, (c) beta sheets, and the percentage that end up as (d) free monomer or fibril, (e) different amorphous aggregates, and (f) beta sheet. Subscripts in the legends indicate how many chains there are in an aggregate where i > 1. The addition of a single chain to an amorphous aggregate could be either the transition Ai → Ai+1or Ai-1→ Ai. The addition to an amorphous aggregate of multiple chains at one time
could be either be the transition Ai→ Ai+jor Ai-j→ Aiwhere j > 1.
The important points to take away from the specific transitions involving amorphous aggregates shown in Figure 2.6 are the following. Figure 2.6a shows that at early times (before the amorphous aggregate population peak at t* = 15) transitions from free monomers to amorphous aggregates constitute a large percentage of the transitions that form amorphous aggregates; this of course is a result of the absence of any other types of structures with which the free monomers could interact. The percentage of transitions from amorphous aggregates to free monomers, seen in Figure 2.6d, is less than the
36 find each other or existing amorphous aggregates and second it is now possible for
monomers to add to beta sheets. At the end of the simulation there are few free
monomers and few amorphous aggregates, so the percentage of transitions involving a free monomer adding on to an amorphous aggregate goes to zero. Figures 2.6b and 2.6e show that after t* = 15 the probability that an amorphous aggregate will decrease in size is the same as the probability that it will increase in size, indicating that these transitions do not contribute significantly to the increase or decreasing in the overall amorphous aggregate population. Figures 2.6c and 2.6f show that before t* = 50 it is twice as likely for an amorphous aggregate to rearrange into a beta sheet (A →B) as it is for a beta sheet to collapse into an amorphous aggregate (B →A), but after t* = 50 the percentage of those transitions equalizes, indicating the simulations have reached a steady state. The inequality means that between t* = 15 and 50 the overall amorphous aggregate population decreases and the beta sheet population increases due to the rearrangement of amorphous
aggregates into beta sheets.
37 independent (not associated with a fibril) beta sheet that is smaller, the same size as, or larger than the original beta sheet.
The important points to take away from the various types of transitions involving beta sheets shown in Figure 2.7 are the following. At early times, before t* = 15,
38 These beta-sheet-to-fibril and fibril-to-beta-sheet transitions occur most frequently at the end of the simulation, which is expected since that is when the large fibrils are rearranging in order to minimize the total free energy of the system.
Figure 2.8 shows the percentage of transitions that start from or end up in a fibril including: the percentage of transitions that start from (a) less ordered structures, (b) a different size fibril, and the percentage of transitions that end up in (c) a beta sheet, and (d) an amorphous aggregate. In Figures 2.8c and 2.8d, as in Figure 2.7c, Xsmaller, Xequal, and Xlarger
refer to a chain within a beta sheet associated with a fibril that ends up within an independent aggregate (not associated with a fibril) that is smaller, the same size as, or larger than the original beta sheet.
The important points to take away from Figure 2.8 and specific transitions involving fibrils are the following. Two-sheet fibrils (F2) form initially from both amorphous
39 simulation progresses (t* > 40) and most of the chains are in the fibril state, (see Figure 2.4a), the dissociation of chains from a fibril decreases significantly and the fibrils begin to rearrange. After about t* = 60, the percentage of transitions indicating fibril growth by sheet addition (Fi-1→Fi) is matched by the percentage of transitions involving fibril shrinkage by sheet loss (Fi+1→Fi); this indicates that the large fibril is formed and that the
beta sheets within the fibril are rearranging to find the most stable and energetically favorable conformation.
40 2.4 Discussion
The behavior of the free monomers over the course of the simulation is not
unexpected; they associate into small amorphous aggregates at very early stages (t* < 15), add to these amorphous aggregates when the latterexist in substantial numbers (15 < t* < 30), add to beta sheets when those structures are present in the simulation (t* > 15), and add to fibrils once they appear in the simulation (t* > 30). The only method the system has of replenishing the population of free monomers is the dissociation of amorphous
aggregates since it is not energetically favorable at this simulation temperature for monomers to dissociate from existing beta sheets or fibrils.
41 monomers or rearrangement of existing beta sheets and amorphous aggregates until the final structure is formed.
Amorphous aggregates form from the association of two free monomers and then quickly grow (t* < 15). Once they are large enough (usually four or more chains), these amorphous aggregates then restructure into beta sheets (15 < t* < 50). Since the transitions involving the growth and shrinking of amorphous aggregates occur in large numbers throughout the simulation, this indicates that the amorphous aggregates are unstable and not energetically favorable since they break apart as easily as they form. At the end of the simulation, there is a relatively stable population of large amorphous
42 It is of interest to compare the percent of amorphous aggregates restructuring into beta sheets with the percent of beta sheets collapsing into amorphous aggregates since the most toxic species in the fibril formation pathway is known to be an intermediate oligomer that often has little or no cross-beta structure.[13-22] We have found that the amorphous aggregates restructure into beta sheets about twice as often as the beta sheets collapse into amorphous aggregates. The beta sheets that are formed are almost always the same size or smaller than the original amorphous aggregates, meaning that most times that a beta sheet is created along the fibril formation pathway, a small amorphous aggregate also remains in the system to grow and interact with other structures. There is no other way to create beta sheets in these simulations, leading to the conclusion that the amorphous aggregates are necessary intermediates in the fibril formation pathway and that the restructuring of amorphous aggregates into beta sheets plays a key role in the fibrillization mechanism as hypothesized in the literature.[23, 37, 50] The small beta sheets that are formed from the rearrangement of the amorphous aggregates are themselves unstable due to the exposed hydrophobic side chains, and therefore quickly associate into small fibril structures that continue to grow over the course of the simulations until the final structure resembles the protofilaments discussed in the literature.[11-12, 16, 44] The small
independent amorphous aggregates that form early in the simulation are energetically unfavorable at this simulation temperature, as evidenced by their depletion as the