DOI: 10.1534/genetics.104.036699
Quantitative Trait Loci Analysis Using the False Discovery Rate
Yoav Benjamini and Daniel Yekutieli
1Department of Statistics and Operations Research, Tel Aviv University, Tel Aviv, Israel 69978
Manuscript received September 23, 2004 Accepted for publication May 20, 2005
ABSTRACT
False discovery rate control has become an essential tool in any study that has a very large multiplicity problem. False discovery rate-controlling procedures have also been found to be very effective in QTL analysis, ensuring reproducible results with few falsely discovered linkages and offering increased power to discover QTL, although their acceptance has been slower than in microarray analysis, for example. The reason is partly because the methodological aspects of applying the false discovery rate to QTL mapping are not well developed. Our aim in this work is to lay a solid foundation for the use of the false discovery rate in QTL mapping. We review the false discovery rate criterion, the appropriate interpretation of the FDR, and alternative formulations of the FDR that appeared in the statistical and genetics literature. We discuss important features of the FDR approach, some stemming from new developments in FDR theory and methodology, which deem it especially useful in linkage analysis. We review false discovery rate-controlling procedures—the BH, the resampling procedure, and the adaptive two-stage procedure—and discuss the validity of these procedures in single- and multiple-trait QTL mapping. Finally we argue that the control of the false discovery rate has an important role in suggesting, indicating the significance of, and confirming QTL and present guidelines for its use.
O
VERLOOKING the multiplicity aspects in QTL studies with numerous markers and several quan-titative traits can lead to many false discoveries of link-ages. Landerand Kruglyak(1995, p. 241) were amongthe first to address the multiplicity problem in QTL mapping, arguing that ‘‘Adopting too lax a standard guarantees a burgeoning literature of false positive. . . Scientific disciplines erode their credibility when a sub-stantial proportion of claims cannot be replicated.’’ The procedure they offered was designed to control the probability of making even one type I error—of making even one false discovery—in a QTL study with a single quantitative trait. This probability is termed the family-wise error rate (FWE) or in this case the genome-family-wise error rate (GWER).
Concerned that controlling the FWE at conventional levels results in very little power to discover QTL, Landerand Kruglyak(1995) set the following widely
used terminology:suggestive linkage, statistical evidence that would be expected to occur one time at random in a genome scan;significant linkage, statistical evidence that would be expected to occur at random with probability 0.05; andconfirmed linkage, significant linkage confirmed by a further sample with a nominalP-value,0.01.
The FWE-controlling procedures employed are de-signed to control the probability of making one or more false discoveries for a single trait. In studies with
multiple traits FWE-controlling procedures have to be suitably adjusted by further raising the threshold for significant linkage according to the number of traits in the study. Consider, for example, a study with 12 quan-titative traits. For a linkage to be suggestive, it should pass a threshold that is equivalent to controlling the FWE at level 0.6 (using the Poisson approximation when the average is 1). Findings that would have been re-ported as significant linkages (FWE¼0.05) in a single-trait study should now be reported only as suggestive linkages (if a simple Bonferroni correction was used the single-trait threshold should be divided by the number of traits). Such a solution may be acceptable in QTL studies with only a few traits. In studies with many traits the control of the FWE leaves very little power to make discoveries. The problem becomes serious even well before reaching current large problems that combine microarrays with QTL analysis, as in Williams et al.
(2002) with 12,422 quantitative traits.
The conflict between the strict control of type I error, as a protection against false discoveries, and the need for increased power led Benjamini and Hochberg
(1995) to suggest a new criterion for type I error in multiple testing: letQbe the proportion of false linkage claims in a genome scan, setting it at zero if no dis-coveries are made; then the false discovery rate (FDR) is the expected value ofQ. It thus seems as if Benjamini and Hochberg have taken literally the warning of Lander and Kruglyak about the danger in allowing a substantial proportion of false claims and cast this danger into a well-defined statistical criterion.
1Corresponding author: Department of Statistics and Operations
Re-search, The Sackler Faculty of Exact Sciences, Tel Aviv University, Tel Aviv, Israel 69978. E-mail: [email protected]
Benjaminiand Hochberg(1995) also introduced a
FDR-controlling procedure [sometimes called linear step-up or the Benjamini-Hochberg (BH) procedure] and proved that it controls the FDR for independent test statistics. Benjaminiand Yekutieli(2001) proved that
the same holds for some types of positive dependence. Welleret al.(1998) were the first to apply the FDR
approach for QTL mapping. They explained the use of the BH procedure for single-marker analysis and dem-onstrated the increase in power. While commenting on this work, Zaykinet al.(2000) pointed out that the
con-ditional interpretation of the FDR criterion,i.e., that controlling the FDR at 0.05 means that 95% of the dis-coveries are true, does not always hold. Although Weller
(2000) eased their concern, the issue is still alive and has resurfaced in discussions of alternative formulations of the FDR criterion: positive FDR (Storeyet al.2004),
adjusted FDR (Mosiget al. 2001), and the proportion of
false positives (PFP) (Fernandoet al. 2004).
While the BH procedure received much attention in microarray analysis, the developments were slower in the context of QTL analysis. Sabattiet al. (2003)
veri-fied that the BH procedure controls the FDR for single-trait linkage (see also Yekutieli2001) and association
genome screens. Lee et al. (2002) addressed interval
mapping, discussed the use of the FDR in multiple quan-titative traits, and recommended the application of the BH procedure separately for each trait. Sabatti et al.
(2003) further suggested substituting the BH procedure with a resampling-based FDR procedure capable of cap-turing the dependency structure of the data to achieve additional power.
What is common to the above researchers, and to the few other users of FDR ideas in QTL analysis, is their enthusiasm about the important role that these ideas can play in QTL analysis. Since we share this enthusi-asm, it seems important to us to lay a solid foundation for the use of FDR in this area, as well as to expand our working methodologies. We present the FDR in precise terms, in conjunction with related formulations of the proportion of false discoveries. We make a clear distinc-tion between the FDR criterion and the BH procedure that controls it under independence. We explain the role that adaptive FDR-controlling procedures can have in increasing power while controlling the FDR. We clarify what is known about the performance of FDR-controlling procedures under dependency in the con-text of QTL analysis and offer more progress on this question. We analyze the performance of the resam-pling procedure of Yekutieliand Benjamini(1999) in
QTL analysis, and we address the important issue of multiple traits. In all of the above, we also make an effort to point at remaining gaps in our knowledge. Finally, we analyze FDR control in independently repeated experi-ments and make use of the results to offer a set of FDR guidelines for the significance of findings in QTL studies.
This article is structured as follows: with a slight dan-ger of repetition, we review the FDR in the next section. We present the various types of FDR-controlling proce-dures. We discuss what ‘‘FDR control’’ means, its re-lations to conditional FDR control and the suggestive linkage criterion, and the control of FDR in multitrait studies. And we present a new framework, based on the BH procedure, for FDR-confirmed QTL mapping with an independent study and compare our new approach to Lander and Kruglyak’s confirmed linkage. The sub-sequent section is dedicated to simulation studies. We compare the performance of the BH procedure to the performance of the FDR-resampling and FWE-resampling procedures. We examine the FDR control of the BH procedure in cases for which no analytical results are available. The final section summarizes our FDR guidelines for assessing the significance of the results of QTL experiments. Thus we hope to be able with this article to remove some of the hurdles placed before the use of FDR in QTL analysis and help with its wider and faster acceptance.
THE FALSE DISCOVERY RATE
The FDR was defined in Benjaminiand Hochberg
(1995) as the expected proportion of false discoveries. Formally, ifRis the total number of discoveries, andV of them are false discoveries, the proportion of false discoveries is Q¼V/R if R .0 and Q¼0 ifR ¼0. Although the value of Q is usually not known in a particular experiment, we can discuss and even control
its expectation, FDR¼E(Q).
Benjaminiand Hochberg(1995) considered several
alternative formulations for the FDR. Two such alter-native formulations, passed over by Benjamini and Hochberg, reappeared in the statistical and genetic literature: E(QjR . 0), the positive FDR (pFDR) in Storey(2002), andE(V)/E(R), the PFP in Fernando
et al. (2004). The pFDR and PFP have very desirable properties; however, they are not appropriate criteria for multiple testing: a statistical procedure offering pFDR or PFP control for all configurations of true and false null hypotheses cannot be constructed. Let us articulate this point, if all tested hypotheses are true, say studying a totally nonhereditary trait, any discovery made is a false discovery—no matter what statistical method is being used. The proportion of false discoveries among these discoveries is identically 1. With the exception of the useless ‘‘never-reject-anything’’ rule, the pFDR and the PFP of all procedures are by definition 1. Thus even the procedure suggested in Storey(2002), designed to
address the pFDR, is not a pFDR-controlling testing procedure. It is capable only of estimating the pFDR once a fixed rejection threshold is being used (seeThe fixed rejection region approach) and includes an estimate of
In contrast, if all tested hypotheses are true, the FDR equals the traditional FWE. Therefore it also makes sense to use the conventional levels such as 0.05 or 0.01 for FDR control, although in some applications higher values may be justifiable. In particular, for QTL analysis Mosiget al.(2001) recommend using 0.1, and Weller
et al.(1998) use 0.25.
FDR-controlling procedures: The BH procedure:
Benjamini and Hochberg (1995) provided a simple
stepwise procedure to control the FDR at a desired level
q. The procedure makes use of the P-values only, so the statistical test itself may be tailored to the problem at hand, be it a LOD score or a nonparametric test. The procedure runs as follows. The individualP-values are sorted from smallest to largest:P(1)#P(2) #P(m).
Starting from the largestP-valueP(m), compareP(i)with
qi/m. Continue as long asP(i).qi/m. Letkbe the first
timeP(i)#qi/mand then declare the hypotheses
cor-responding to the smallestk P-values as significant. An intuitive explanation of the connection between the BH procedure and FDR control was offered by Benjaminiand Hochberg(1995) and later recited by
Welleret al.(1998) and Mosiget al.(2001): if we reject
thekhypotheses withP-values less thanp(k)and treat this
p(k) as if it is fixed, then regardless of the joint
dis-tribution of theP-values the average number of false dis-coveries isp(k)m0, wherem0is the (unknown) number
of true null hypotheses. As an upper bound for the FDR we takep(k)m/k. For this to be less thanq,p(k)has to be
less thanqk/m. This argument by itself is inappropriate as a proof, mixing expectations with values in the ex-periment and ignoring the case when no discovery is made. Hence it cannot be used to imply that the BH procedure always controls the FDR regardless of the test statistic distribution, and in fact in some rare settings the FDR of the BH procedure may get as high asq(111
21 1
31 1=m). The correct statement, proven precisely in Benjaminiand Yekutieli(2001), is as follows:
Theorem 1.If the test statistics are positively regression
dependent on each hypothesis from the subset corresponding to true null hypotheses, the BH procedure controls the FDR at level qm0/m.
The definition of the positive regression dependent on a subset (PRDS) condition and a review of important examples where it is satisfied can be found in Benjamini
and Yekutieli(2001). The PRDS condition and FDR
control of the BH procedure in single-trait QTL analysis are discussed in Sabattiet al.(2003). InFDR control in
multitrait studies we discuss FDR control of the BH procedure in multiple-trait QTL analysis.
The fixed rejection region approach:Welleret al.(1998)
denote q ¼P(i) m/i as the false discovery rate when
rejecting atP(i). They note the erratic behavior of thisqas
a function ofiand demonstrate in simulations that the mean value of the above expression—for a fixed i—is
greater than the mean of the number of tests with P -values#P(i)not linked to a simulated QTL divided byi.
Such an attempt does not verify the FDR control of the BH procedure. Instead, it shows that if one decides beforehand to reject theihypotheses with the smallest
P-values, the correspondingP(i) m/iis a conservative
estimator of the FDR committed. A more natural choice in this direction is to use the fixed rejection region ap-proach. For example, reject any hypothesis with LOD.c
and study the FDR properties of such a rejection rule as
c varies. A detailed discussion of this topic, in general settings, can be found in Yekutieli and Benjamini
(1999) and Storey(2002).
In the BH procedure qis specified while the LOD threshold and the number of hypotheses rejected vary. If, for each P(i), instead of comparing P(i) m/i to q
we take the minimum of such terms over all P-values larger than or equal toP(i), we get the BH FDR-adjusted
P-values: PBH
ðiÞ ¼minj$iðPðjÞm=jÞ (Westfall 1997;
Yekutieli and Benjamini 1999). Obviously, rejecting
all hypotheses whose BH FDR-adjusted P-values are smaller than q is equivalent to applying the BH pro-cedure at level q. Thus reporting the FDR-adjusted
P-values PBH
ðiÞ , or plotting them as a function of i, is convenient. Compared to plots of q¼ P(i) m/i vs. i
(orvs. P(i)as in Leeet al.2002), they are monotonic and
exhibit less erratic behavior. Plotting the FDR-adjusted
P-values vs. their location on the chromosome is another informative way of displaying results.
Two-stage adaptive procedures: When some QTL exist, implying that the number of markers unlinked to QTL
m0is less thanm, the BH procedure controls the FDR at
too strict a level by a factor ofm0/m. If this factor were
known, using the BH procedure at levelq*¼qm/m0
instead of qwould be more powerful and still achieve FDR control at levelq. Sincem0is hardly ever known, it
seems attractive to first estimatem0and then useq* as
defined above, with the estimatedm/m0instead of the
true quantity. Theorem 1 by itself does not guarantee that two-stage procedures control the FDR at the desired level, and their properties need separate attention (see Benjaminiet al.2003).
Two-stage adaptive FDR-controlling procedures were introduced by Benjaminiand Hochberg(2000). The
study and development of adaptive FDR-controlling procedures is a very active area of research: Storey
(2002), Storeyet al.(2004), and Black(2004), to name
just a few. In the context of QTL analysis, Mosiget al.
(2001) discussed the role of the estimated m0 in the
control of FDR, their offering being an adaptive pro-cedure aimed at controlling the FDR (rather than a new criterion). Important modifications to the procedure were offered in Fernandoet al.(2004).
Benjaminiet al.(2003) introduced a two-stage
pro-cedure in which m0 is estimated by the number of
hypothesesnotrejected by the BH procedure at levelq,
the BH is used again with the modified q*. They analytically prove FDR control of their new procedure for an independent test statistic. Benjaminiet al.(2003)
further show that with the exception of their procedure, all other two-stage procedures (including the two-stage procedure of Mosiget al.2001) fail to control the FDR
for some positively regression-dependent tests. This does not mean yet that all other procedures are not appropriate for the particular dependency structure encountered in QTL mapping, but it raises doubt as to their appropriateness in their current form.
Resampling procedures:Resampling procedures, reshuf-fling, and randomization, being close variants, overcome the problem of specifying the marginal distributions of the test statistic at each marker under the null hypothesis of no linkage and even more importantly incorporate the dependency between the markers to increase the power of the analysis. It is done by imitating the way the data were generated by sampling, with or without replacement, under the assumption of no linkage. In QTL analysis resampled data can be generated by randomly drawing a with-replacement sample of the phenotype data and then correlating it with the original genotype data.
Yekutieliand Benjamini(1999) introduced a
gen-eral FDR-controlling resampling procedure designed to control the FDR: for i ¼ 1, 2,. . .,m compute the resampling-based FDR-adjustedP-valuePRes
ðiÞ ; reject the null hypotheses corresponding to PRes
ðiÞ ,q. This pro-cedure controls the FDR if the sets of test statistics corresponding to true and false hypotheses are in-dependent. This condition is satisfied in single-trait QTL analysis (seeFDR control in multitrait studies). For multiple traits we bring support for FDR control in the
simulation study.
Control of the FDR: Level q FDR means that the expected value ofQis less than or equal toq. The actual value ofQcan theoretically vary from 0 to 1; thus FDR control does not generally imply that 95% of the dis-coveries are true disdis-coveries. Genoveseand Wasserman
(2004) show that in very large problems with indepen-dently distributed test statistics if the data contain a proportion of true discoveries then applying the BH procedure does ensure that95% of the discoveries are true ones, and asQhardly varies, FDR¼pFDR¼PFP¼ 0.05m0/m. Note that while these assumptions might be
reasonable for microarray data, they do not necessarily apply to QTL mapping.
Conditional control of the FDR: Zaykin et al. (2000)
argue against control of the FDR as it does not control the expected proportion of false discoveries if interest is restricted to experiments in which some discoveries were made (which is the pFDR) and recommend adher-ing to control of the FWE. Storey (2002) has been
advancing the pFDR as the criterion of interest. Math-ematically, pFDR¼E(QjR. 0)¼FDR/P(R. 0). FDR; thus control of the FDR does not imply pFDR control. We agree with Zaykinet al.(2000) that control
of FWE offers more protection than FDR at the same level. However, as we argued before, FWE is not suitable for QTL analysis because at low levels such as 0.05, it leaves too little power to make discoveries of multiple QTL, and at higher levels, as allowed by suggestive linkage, it does not offer sufficient type I error control (details inReplacing the suggestive linkage criterion with FDR control). Moreover, in spite of its conservativeness, controlling the FWE still does not control the pFDR.
Actually, the control of the FDR strikes a balance between the usually too conservative control of the FWE and the sometimes impossible control of the pFDR, depending on the data at hand. Studying a totally nonhereditary trait with FDR ¼q is the same as with FWE¼q(both being smaller than the pFDR). On the other hand, when QTL are present, as true discoveries are more likely than false ones, Pr(R. 0). FWE. In particular, studies in which many hypotheses are re-jected reflect configurations where Pr(R.0)1. Thus FDRpFDR, and controlling the FDR in such cases is reasonably close to controlling the pFDR (both being smaller than the FWE) (Weller2000).
Replacing the suggestive linkage criterion with FDR control:
Let us carry the above discussion into the case of suggestive linkage. The threshold is chosen so that there will be one false linkage per genome scan on the average. Using the Poisson approximation, such a threshold is equivalent to controlling the FWE at 0.6. Now when Zaykinet al.(2000, p. 1918) claim that the
control of FWE is better than the FDR, they argue: ‘‘. . . using an FWER controlling method, one may claim that all significances obtained in the study are real, gambling upon the occurrence that the given study was not one of the 25% (or whatever FWE level that is used) that will produce a false positive.’’ Consider the above argument applied to the criterion for suggestive linkages: gam-bling that the given study is not one of the 12 out of 20 that will produce a false positive, is difficult to justify. It is therefore our view that controlling the FWE at 0.6 cannot by itself be trusted to indicate suggestive results. If one reads carefully Lander and Kruglyak (1995)
similar skepticism can be sensed, as, for example, they do not see a way to confirm suggestive linkages in a second study. We therefore suggest that this criterion be abandoned and be replaced by FDR control at lower level. A good choice is q ¼0.1, as done by Lee et al.
(2002). We certainly do not recommend going higher thanq¼0.2 in published reports.
but the false discoveries are expected to be a small proportion of the discoveries made.
FDR control in multitrait studies: Studying multiple traits, a question arises whether there is need to con-sider all traits jointly when controlling the FDR at levelq
or whether each trait can be considered separately. An intuitive reason for the second approach is that having a fixed proportion of errors in each trait implies the same fixed proportion of errors in the combined study. Lee
et al.(2002) considered both options and recommen-ded the latter. However, when each trait is considered separately the actual FDR over the entire study is determined by the type of data analyzed. For example, in a study withkindependent nonheritable traits, the FDR for all traits combined equals 1(1q)k. On the
other hand, in a study in which all traits are highly heritable, the combined FDR is approximatelyq.
Fernandoet al.(2004) show that if for each trait the
PFP is controlled at levelqthen the PFP of the entire study is less than or equal to q. Our ongoing work (Benjaminiand Yekutieli2002) indicates that
control-ling the FDR at each trait separately is legitimate as long as the number of markers discovered this way across all traits greatly exceeds the number of traits in the study (e.g., if the number of markers discovered is more than twice the number of traits the combined FDR is,2q). The connection between the two results is that in large studies with many discoveries PFPFDR. To be on the safe side, we recommend that the test statistics of all the traits in the study have to be tested simultaneously in a FDR-controlling procedure. Unlike in FWE-controlling approaches, the resulting decrease in power need not be large (see simulations in Use of resampling-based procedures in QTL analysis).
Yekutieli(2001) addressed the problem of
control-ling the FDR when simultaneously testing all test statistics in a multiple-trait study. For each trait locus and each quantitative trait the null hypothesis is that the allelic composition at the locus is unassociated with the quantitative trait. The alternative hypothesis depends on the design of the study and can be one sided, but for the most part is two sided: a nonzero additive effect for the back-cross design or nonzero additive or dominance effects for an intercross design. For each trait separately, Yekutieli(2001) proves the following:
a. PRDS dependency between the test statistics in a backcross experiment corresponding to the true null hypotheses. Due to genetic linkage, for each trait all the hypotheses on a chromosome are either true or false depending on the presence of a QTL on the chromosome.
Since test statistics on separate chromosomes are independent:
b. Independence between the set of test statistics corresponding to false null hypotheses and those corresponding to true ones.
Property b is a sufficient condition for the validity of the resampling-based FDR-controlling procedure. Properties a and b jointly imply the PRDS condition. Property b does not hold for multiple traits—a chromosome might contain QTL for only a subset of the traits in the study. Traits having negatively correlated environmental com-ponents rule out property a.
Confirming QTL mapping with an independent study:According to the guidelines suggested by Lander
and Kruglyak (1995) the most credible linkage is a
‘‘confirmed linkage’’—a significant linkage from one study found significant at the nominal 0.01 level in an independent study, preferably conducted by other investigators. They argue that each significant linkage can be tested by itself at the 0.05 level, since it was chosen in advance. Since typically one further considers a 20-cM neighborhood of markers around the signifi-cant linkage, their nominal threshold is lowered to 0.01. The above approach has two limitations: (1) using the FWE at level 0.05 to test the significance of the results in the initial study may leave little power to make any discoveries, and (2) if a number of linkages are discovered in the first stage, neglecting to control for multiplicity in the confirmatory stage compromises the strength of the evidence. The latter is especially serious when we consider multiple complex traits, with their many potential QTL.
We therefore suggest a new FDR-controlling testing strategy in which the BH procedure is used in both the initial and the confirmatory studies. (Similarly, if FWE is controlled at the second stage then so does the two-stage procedure.)
Definition2. A FDR procedure for confirming QTL
mapping in an independent study is as follows:
1. Test themnull hypotheses in study 1 using the BH procedure at levelq1.
2. Test ther1hypotheses rejected in study 1 using the
BH procedure at levelq2.
Proposition3.Under the conditions of Theorem1, and
for q1 and q2 fixed in advance, the FDR of procedure 2 is
#q1q2m0/m.
The proof of Proposition 3 is deferred to theappendix.
If we wish to adhere to the Lander and Kruglyak
(1995) choice of the ‘‘double 0.05’’ level,FDR-confirmed linkagesare significant linkages from the first study that were tested at the FDR level of 0.05 in the confirmation study and remained significant. Thus FDR-confirmed linkages enjoy an FDR level of 0.0025. This way we address the two limitations of the Lander and Kruglyak approach to confirming linkages.
sampling units (sample size times number of hypothe-ses), while the combined study still controls the FDR at level 0.05.
SIMULATION STUDY
Use of resampling-based procedures in QTL analysis: Sabattiet al.(2003) suggest using resampling-based
pro-cedures in QTL analysis. To test their suggestion we com-pared the power of the BH procedure to the power of the resampling FDR procedure and the Churchilland
Doerge(1994) FWE-controlling resampling procedure.
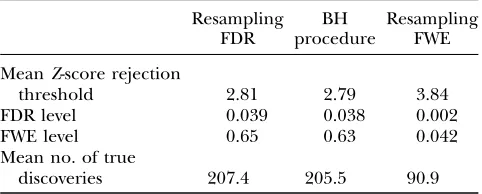
Single-trait power comparison: This simulated experi-ment consisted of 550 backcross progeny. The genome of each individual consisted of 20 100-cM chromosomes. Markers were situated at 1-cM intervals—the dense marker map is meant to work in favor of the resampling-based procedures. Quantitative trait values were com-puted by summing the allelic effect at QTL and noise. Six QTL with effect sizes of 0.3, 0.2, 0.4, 0.1, 0.4, and 0.3 were planted on 4 chromosomes. Each simulation consisted of 500 repetitions. For each outcome variable and marker, the absolute valued Z-score and P-values were computed, and the two FDR procedures and the FWE procedure were applied at level 0.05. In all the simulations, the rejection of the null hypothesis of no association between a marker and a quantitative trait was considered a true discovery for markers on chromo-somes with a QTL for the quantitative trait and a false discovery for markers on chromosomes with no QTL for the quantitative trait. To conduct the two resampling-based methods the data were resampled 3000 times under the complete null hypothesis of no QTL.
A summary of the results of this study is presented in Table 1. The two FDR-controlling procedures yield very similar results. Their FDR levels are 0.03860.004 and 0.03960.004, significantly ,0:04¼0:05316
20(the ex-pected FDR level for independently distributed test statistics). The two FDR procedures enjoy similar power and are superior to the FWE-controlling procedure. The FDR procedures have lower mean rejection thresh-olds (expressed in terms of Z-scores) and more true discoveries (.200 for the FDR procedures; 91 for the FWE procedure). The price for the increased power is a few more erroneous linkages and FWE levels of 0.63 and 0.64.
Multitrait power comparison: In this set of simulations we altered the simulation of the phenotypes. We simulated one, two, four, and eight traits. QTL were placed at random. The number of chromosomes having QTL was sampled from a Poisson distribution with mean 3. The number of QTL per chromosome was either one or two. Effect sizes were sampled from
U[0.25, 0.4]. In this set of simulations an independent random error term was added to each trait.
In Table 2 we present the average threshold for rejecting null hypotheses for the three procedures at level 0.05 (expressed in terms ofZ-scores andP-values). The two FDR procedures retain, and even increase, their power as the number of traits increases. This property is characteristic of FDR procedures when QTL are present. On the other hand, if no QTL are present FDR procedures control the FWE and the FDR thresh-old increases as the number of hypotheses increases. This type of behavior is evident in the performance of the FWE-controlling procedure. As the number of traits increases twofold the criticalP-value is multiplied by 0.5. FDR control of the BH procedure:According to the simulation results inUse of resampling-based procedures in QTL analysis the BH and the FDR resampling proce-dures are practically identical. In this set of simulations we verify whether the BH procedure controls the FDR in situations for which no analytical results are available.
FDR control in an intercross experiment:The setting is as in the single-trait power comparison, but we altered the design of the experiment from a backcross to an inter-cross. We therefore added the following six domi-nance effects to the six QTL: 0.15, 0.15, 0.3, 0.06,
TABLE 1
Comparison of FDR and FWE procedures—single trait
Resampling FDR
BH procedure
Resampling FWE
MeanZ-score rejection
threshold 2.81 2.79 3.84
FDR level 0.039 0.038 0.002
FWE level 0.65 0.63 0.042
Mean no. of true
discoveries 207.4 205.5 90.9
TABLE 2
MeanZ-score (andP-value) rejection thresholds—multiple traits
Resampling FDR BH procedure Resampling FWE
Single trait 3.06 (2.23103) 3.08 (2.13103) 3.81 (1.43104)
2 traits 2.95 (3.23103) 2.92 (3.53103) 4.01 (6.03105)
4 traits 2.96 (3.13103) 2.92 (3.53103) 4.15 (3.33105)
0.01, and0.25. The simulation included 1000 repli-cations. The simulated FDR of the BH procedure was 0.039660.001, indicating that it also controls the FDR at levelqm0/min single-trait intercross experiments.
FDR control for negatively correlated multiple traits:The set-ting is as in the multitrait power comparison with the num-ber of traits set to eight, only this time correlated (rather than independent) errors are added to the traits. This set of simulations consisted of two runs of 1000 replications.
In the first simulation the random error terms added to the phenotypes were a sample from a multivariate normal distribution with 0 mean, unit variance, and 0.36 correlation. The FDR value for the BH procedure was 0.04260.001.
In the second simulation the eight traits were divided into two blocks of four traits (traits 1–4 and traits 5–8). The correlation of the error terms within each block re-mained 0.36, and the correlation of the error terms be-tween traits belonging to different blocks was changed to0.36. The FDR value was now 0.04460.001.
While the number of true null hypotheses varied, the expected value ofqm0/mwas 0.0425. This reveals that
the introduction of negatively correlated error terms may result in FDR exceedingqm0/m. But the striking
feature, evident in all the simulations conducted, is that the FDR level of the BH procedure is practically un-affected by correlation: in all simulations the FDR varied fromqm0/mby,0.002.
SUMMARY
The two advantages of the FDR approach, which make it particularly suitable for QTL analysis, are its adaptivity to the amount of information in the data and its scalability—controlling the FDR for multiple traits may come with no loss of power. By comparison, the thresholds set by Lander and Kruglyak (1995) are
valid only for a single trait. If these thresholds are fur-ther modified to achieve FWE control when many traits are studied, the required size of the experiment that is needed to achieve significance may not be feasible.
We establish, via simulations, that the BH procedures can effectively be used to control the FDR in multiple-trait studies. Controlling the FDR at the 0.10 level can take the place of the suggestive linkage criterion of Lander and Kruglyak. At the 0.05 level it can assume the role of identifying significant QTL. Such FDR signif-icant linkages can further be confirmed in an indepen-dent study by controlling the FDR again at the 0.05 level, thereby giving rise to FDR-confirmed linkages.
We are especially thankful to two reviewers whose suggestions contributed much to the presentation of this article. This research was supported by a Focal Initiatives for Research in Science and Technology grant of the Israeli Academy of Sciences and Humanities. Yoav Benjamini was also partly supported by a National Institutes of Health grant.
LITERATURE CITED
Benjamini, Y., and Y. Hochberg, 1995 Controlling the false
discov-ery rate: a practical and powerful approach to multiple testing. J. R. Stat. Soc. Ser. B57(1): 289–300.
Benjamini, Y., and Y. Hochberg, 2000 The adaptive control of the
false discovery rate in multiple comparison problems. J. Educ. Behav. Stat.25(1): 60–83.
Benjamini, Y., and D. Yekutieli, 2001 The control of the false
discovery rate in multiple testing under dependency. Ann. Stat. 29(4): 1165–1188.
Benjamini, Y., and D. Yekutieli, 2002 Hierarchical FDR testing of
trees of hypotheses. Research paper 02–02. Department of Statis-tics and OR, Tel Aviv University, Tel Aviv, Israel.
Benjamini, Y., A. M. Krieger and D. Yekutieli, 2003 Adaptive
linear step-up procedures that control the false discovery rate. Research paper 01-03. Department of Statistics and OR, Tel Aviv University, Tel Aviv, Israel.
Black, M. A., 2004 A note on the adaptive control of false discovery
rates. J. R. Stat. Soc. Ser. B66(2): 297–304.
Churchill, G. A., and R. W. Doerge, 1994 Empirical threshold
values for quantitative trait mapping. Genetics138:963–971. Fernando, R. L., D. Nettleton, B. R. Southey, J. C. M. Dekkers,
M. F. Rothschild et al., 2004 Controlling the proportion of
false positives in multiple dependent tests. Genetics166:611–619. Genovese, C., and L. Wasserman, 2004 A stochastic process
ap-proach to false discovery control. Ann. Stat.32(3): 1035–1061. Lander, E. S., and L. Kruglyak, 1995 Genetic dissection of
com-plex traits: guidelines for interpreting and reporting linkage results. Nat. Genet.11:241–247.
Lee, H., J. C. M. Dekkers, M. Soller, M. Malek, R. L. Fernando et al., 2002 Application of the false discovery rate to quantitative trait loci interval mapping with multiple traits. Genetics 161: 905–914.
Mosig, M. O., E. Lipkin, G. Khutoreskaya, E. Tchourzyna,
M. Solleret al., 2001 Whole genome scan for quantitative trait
loci affecting milk protein percentage in Israeli-Holstein cattle, by means of selective milk DNA pooling in a daughter design, using an adjusted false discovery rate criterion. Genetics 157: 1683–1698.
Sabatti, C., S. Serviceand N. Freimer, 2003 False discovery rate in
linkage and association genome screens for complex disorders. Genetics164:829–833.
Storey, J. D., 2002 A direct approach to false discovery rates. J. R.
Stat. Soc. Ser. B64:479–498.
Storey, J. D., J. E. Taylorand D. Siegmund, 2004 Strong control,
conservative point estimation, and simultaneous conservative consistency of false discovery rates: a unified approach. J. R. Stat. Soc. Ser. B66(19): 187–205.
Weller, J. I., 2000 Using the false discovery rate approach in the
genetic dissection of complex traits: a response to Zaykinet al.
Genetics154:1919.
Weller, J. I., J. Z. Song, D. W. Heyen, H. A. Lewinand M. Ron,
1998 A new approach to the problem of multiple comparisons in the genetic dissection of complex traits. Genetics 150: 1699–1706.
Westfall, P. H., 1997 Multiple testing of general contrasts using
logical constraints and correlations. J. Am. Stat. Assoc. 92 (437): 299–306.
Williams, R. W., S. Shou, L. Lu, Y. Qu, J. Wanget al., 2002 Genomic
analysis of transcriptional networks: combining microarrays with complex trait analysis. Abstract of the First Annual CTC Meeting, May 2002 Memphis (http://www.complextrait.org/).
Yekutieli, D., 2001 Theoretical results needed for applying the false
discovery rate in statistical problems. Ph.D. Thesis, Department of Statistics and O.R., Tel Aviv University, Tel Aviv, Israel.
Yekutieli, D., and Y. Benjamini, 1999 Resampling-based false
dis-covery rate controlling procedure for dependent test statistics. J. Stat. Plan. Inference82(1–2): 171–196.
Zaykin, D. V., S. S. Youngand P. H. Westfall, 2000 Using the false
discovery rate in the genetic dissection of complex traits: a re-sponse to Welleret al.Genetics154:1917–1918.
APPENDIX: PROOF OF PROPOSITION 3
Let R1, V1, R2, and V2 denote the number of
dis-coveries and false disdis-coveries in the initial and confir-matory studies when applying procedure 2. Let
Q1¼ V1=R1 if R1.0
0 if R1 ¼0; Q2¼
V2=R2 if R2.0 0 if R2¼0;
therefore, the FDR of procedure 2 isE(Q2).
Conditioning on the number of discoveries and the number of false discoveries at the initial study,R1¼r1
andV1¼v1, and using Theorem 1 withv1andr1taking
the role ofm0andm, we getER1¼r1;V1¼v1ðQ2Þ#v1q2=r1
forr1.0 andQ2[0 ifr1¼0. To complete the proof we
use the independence of the two studies and express the FDR of procedure 2,
EðQ2Þ#q2 Xm
r1¼1
Xr1
v1¼0
PrðR1¼r1;V1¼v1Þ v1 r1
1PrðR1¼0Þ 0
( )
¼q2EðQ1Þ
#q2 m0q1
m ;