DOI: 10.1534/genetics.108.099127
The Evolution of Epistasis and Its Links With Genetic Robustness,
Complexity and Drift in a Phenotypic Model of Adaptation
Pierre-Alexis Gros,*
,†,1Herve´ Le Nagard*
,†,‡,§,1and Olivier Tenaillon*
,†,2*Universite´ Paris 7, Faculte´ de Me´decine Denis Diderot 75018 Paris, France and†INSERM U722, ‡INSERM U738 and§INSERM IFR02, 75018 Paris, France
Manuscript received December 1, 2008 Accepted for publication March 5, 2009
ABSTRACT
The epistatic interactions among mutations have a large effect on the evolution of populations. In this article we provide a formalism under which epistatic interactions among pairs of mutations have a distribution whose mean can be modulated. We find that the mean epistasis is correlated to the effect of mutations or genetic robustness, which suggests that such formalism is in good agreement with most
in silicomodels of evolution where the same pattern is observed. We further show that the evolution of epistasis is highly dependant on the intensity of drift and of how complex the organisms are, and that either positive or negative epistasis could be selected for, depending on the balance between the efficiency of selection and the intensity of drift.
T
HE long-term evolutionary fate of a population relies on the shape of its adaptive landscape. The adaptive landscape is the precise map that associates a fitness value to any possible genotype or phenotype. While a perfect knowledge of the adaptive landscape is out of reach, even for the simplest organisms, un-derstanding its statistical properties can be very valu-able to decipher the different selective pressures acting on an organism and its genetic system (e.g., its mutation rate or its recombination rate). Among such statistical properties, the mean epistasis among mutations is one that has been broadly studied in population genetics (Wolfet al. 2000). Epistasis refers to the existence of interactions between mutations: the effect of a mutation depends on the genetic background in which it appears. The spread of a mutation in a population depends on its effect on fitness and as epistasis affects fitness it can potentially influence the evolution of a population. This is why we focus here on the effect of mutations and their interactions on fitness.Epistasis has been studied widely because it was demonstrated that depending on its sign selection could favor or not the evolution of recombination (Kondrashov 1993). Since that study was published, much more convincing models have been developed on the evolution of sex (Ottoand Barton2001; Poonand Chao 2004; Barton and Otto 2005; de Visser and Elena2007). Nevertheless, the early model generated a strong interest for the experimental study of epistasis
among the population genetics community (deVisser et al.1996, 1997; Elenaand Lenski1997; Bonhoeffer et al.2004; Burchand Chao2004; Sanjuanet al.2005; Beerenwinkelet al.2007; Jasnosand Korona2007)
There are several closely related ways to calculate epistasis (Wolf et al. 2000); in this article epistasis between two mutations is defined as
e¼log fðx12Þ fðx0Þ
log fðx1Þ fðx0Þ
log fðx2Þ fðx0Þ
ð1Þ
(Martinet al.2007).
In this definitionemeasures the deviation of the log-fitness for a double mutant, log(f(x12)/f(x0)), from that expected if the fitness effects of each individual muta-tion were multiplicative. (x0is the ancestral genotype,x1 andx2are the genotypes having mutation 1 or mutation 2, and x12is the double mutant). With this definition epistasis is a relative deviation from single-mutant effects and is therefore not directly connected to the amplitude of the effect of single mutations on fitness. A positive epistasis refers to the case in which a combina-tion of mutacombina-tions has a higher fitness than the one expected from independent mutations. Negative epis-tasis refers to the opposite: double mutants have lower fitness than expected.
Epistasis is a key component of genomic architecture. Two main approaches, which can be traced back to the Wright vs. Fisher debate, have been used to study epistasis. In a Wrightian approach epistasis dominates the adaptive landscape such that the landscape is defined only by the epistatic interactions among muta-tions. Depending on the amount of epistasis and its (a priori imposed) distribution, smooth or rugged fitness 1These two authors contributed equally to this work.
2Corresponding author:INSERM, Universite´ Paris 7, Faculte´ de Me´decine
Denis Diderot, Site Xavier Bichat, 16 rue Henri Huchard, 75018 Paris, France. E-mail: [email protected]
landscapes can emerge (Goodnight1988; Kauffman 1993; Hansenand Wagner2001). The epistasis of the genotypes present in the population evolves then as the population wanders in such genetic space. In a Fish-erian view (Fisher1930), the adaptive landscape has a single peak, and epistasis either is included to modulate how fitness decays with the distance to the optimum (usually in terms of Hamming distance) or emerges as a consequence of the phenotype to fitness map (Wolf et al.2000) (see later). In this article we focus on the Fisherian view of epistasis. It corresponds to the case in which a population is well adapted and evolves close to an optimum of fitness, staying in a region far from other local optima.
Because epistasis has a large effect on the spread of mutations, both deleterious and beneficial, within populations, it has recently been suggested that epistasis could be under selection itself as it has been shown for the mutation rate (Tenaillonet al.1999; Denamurand Matic2006) and the recombination rate (de Visser and Elena 2007). Lines of evidence supporting these ideas come (among others) from the recent studies of epistasis in artificial systems. For instance, it was shown in a model of regulatory networks that epistasis could evolve and even change sign in the presence of genetic exchange (Azevedoet al.2006). In several systems, such as RNA folding or artificial life (Wilke and Adami 2001), it was found that epistasis was correlated with the mean effect of mutations. On the basis of these observations, analytical models have been developed in which a locus affects the epistatic interactions be-tween mutations at other loci (Libermanand Feldman 2005, 2006, 2008; Desai et al. 2007; Liberman et al. 2007). Our present work extends these theoretical works on modifiers of epistasis to the case of a con-tinuum of mutations effects. For the sake of simplicity we focus here exclusively on asexual populations, in which it was predicted that epistasis was neutral (Desai et al.2007).
These recent models studying the evolution of a modifier of epistasis considered loci in which some deleterious mutations of fixed effect could appear; moreover, all interactions among mutations presented the same epistasis value (the discrete value imposed by the modifier). Although such assumptions allow one to develop simplified models, they suffer some limitations. For example, considering mutations of a single type of mutational effect on fitness can substantially affect some of the conclusions on the accumulation of deleterious mutations such as Muller’s ratchet: while in small populations, the accumulation of deleterious mutations is stopped in the presence of synergistic epistasis when the effects of mutations are discrete (Kondrashov 1994), such an accumulation is endless if mutations have a continuous distribution of effects (Butcher 1995). Moreover, many experiments have demonstrated that both the fitness effect of mutations on fitness and
their epistatic interactions have a large variability (Elena and Lenski1997; Sanjuan et al.2005; Jasnos and Korona2007), so assuming they are not variable is an important limitation.
It has been suggested for a long time (Fisher 1958; Wolfet al.2000) that epistasis could emerge from the phenotype to fitness relation in an integrated model of phenotypic adaptation with continuous effects, referred to as the Fisher geometric model. Fisher’s geometric model of adaptation, a quite old model (Fisher1930), has received a lot of attention recently (Fisher 1930; Kimura1962; Orr1998, 1999, 2000, 2006; Welchand Meselson 2001; Waxman and Welch 2005; Martin and Lenormand 2006) as it provides an interesting integrated model of adaptation that appears to be in agreement with experimental data, both qualitatively and quantitatively (Burchand Chao1999; Orr 1999; Martin and Lenormand2006; Silander et al. 2007; Tenaillonet al.2007). Recently, the properties of the distribution of epistasis were characterized in this framework (Martin et al. 2007) and the emerging distribution appeared to be in good agreement with experimental observations (Martin et al.2007). Fish-er’s model stipulates that organisms are characterized by a number of independent trait values. Each trait is under stabilizing selection, which means that a unique optimal value of the trait exists. This results in the existence of an optimal combination of traits that provides the best possible fitness (Figure 1A). This simplified model is also interesting because it has only a few parameters as follows:
i. The number of independent traits, which in geo-metric terms is the number of dimensions of the space: We mention this parameter later as ‘‘the phenotypic complexity.’’
ii. The way fitness declines for each trait given the distance to the optimal trait value: In this article, we use the same fitness decay function for all traits, which produces circular fitness isoclines. We de-cided to use a fitness function in which epistasis could be affected by a single parameter, Q. In agreement with previous studies, the function we use isf(x)¼exp(xQ) (Wilke2001; Tenaillon
et al. 2007), withxbeing the distance to the optimum and Qan epistasis parameter (see later).
iii. The way mutations affect traits: In such a model a mutation is a vector that moves one organism defined by its position in the phenotypic space to a new position. In the present analysis the direction of the vector is drawn from a uniform distribution and its norm is drawn from a centered normal distribution with standard deviations.
effect of the distance to the optimum on fitness, the further away the bigger the effect on fitness, and the opposite (diminishing return, or antagonistic effect) is seen ifQ,1. It is, however, unclear howQinfluences epistasis in multiple dimensions and with continuous mutations; for example, ifQ¼2 no average epistasis is found (Martinet al.2007).
In this article, we further extend the study of epistasis in Fisher’s model by studying, first, the distribution of epistasis whenQ6¼2 and, second, the selective pressures acting onQ.
MODEL AND RESULTS
Impact ofQ on the mean epistasis: Along the same line as Martinet al.(2007), we study the mean epistasis among pairs of mutations. For an individual at position
x¼(x1,x2,. . .,xn) in the space of phenotypic complex-ityn, its Wright–Fisher fitness is defined as
fð~xÞ ¼e Pni¼1x 2
i
ð ÞQ=2
(Figure 1).
It is worth noting that the relation between fitness and distance in the phenotypic space is arbitrary and could be modulated by the addition of a parameter without loss of generality by defining instead fð~xÞ ¼
eA P n i¼1x
2
i
ð ÞQ=2
. The parameterA can scale the average effect of mutations on fitness; however, A can be absorbed in a change of units for thexi, so we setA¼
1 in the rest of the article.
For mutations, all traits are treated in the same way: each phenotype is changed by a centered normal deviate of standard deviations.
Before we proceed to our calculations, we can in-tuitively guess the effect of Q on epistasis: since phenotype mutations are normally distributed with mean 0 and standard deviations, each mutation entails a move in the phenotypic space of the order ofssuch that fitness is modified by a factor of the order of Exp(sQ
) so log-fitness changes are of order sQ
. Epistasis measures the difference between the effect on log-fitness of a double mutation and the sum of the effects of two single mutations. A double mutation is the sum of two independent random variables with stan-dard deviationssuch that its standard deviation ispffiffiffi2s. Thus the effect on log-fitness of a double mutation is of the order of 2Q=2sQ. Thus epistasis is of the order of
e ð22Q=2ÞsQ. Thus epistasis should be on average
positive ifQ,2, negative ifQ.2, and null ifQ¼2. We also see thate, which is homogeneous to a log-fitness effect, is approximately proportional tosQ
,i.e., approx-imately proportional to the average log-fitness effect of single mutations.
We now describe more rigorously the precise form of epistasis.
At the optimum:Let us first consider that the organism is at the optimum (~x¼~0). Epistasis among two muta-tions originating from the optimum is
e¼logðfð~x11~x2ÞÞ logðfð~x1ÞÞ logðfð~x2ÞÞ as fð~0Þ ¼1
in which~x1 and~x2 are two random mutations having each of their components drawn from a normal distri-bution with mean 0 and standard deviations. We can rewrite epistasis as
e¼ X
n
i¼1
ðx1i1x2iÞ2
!Q=2
1 X
n
i¼1
x2 1i
!Q=2
1 X
n
i¼1
x2 2i
!Q=2
and then
e¼ sQ32Q=2 X
n
i¼1
x1i1x2i
ffiffiffi 2 p
3s
2!Q=2
1sQ3 X
n
i¼1
x12i
s2 !Q=2
1sQ3 X
n
i¼1
x22i
s2 !Q=2
;
which makes appear in parentheses the sum of squared centered, reduced normal deviates (the sum of two independent Gaussians being a Gaussian).
Hence the mean epistasis at the optimum is
e¼ ð22Q=2Þ3sQE
ffiffiffiffiffiffiffiffiffiffiffiffiffiffiffiffiffiffiffiffiffi Xn
i¼1
x1i
s
2
s !Q!
e ¼ ð22Q=2Þ
S ð2Þ
with
S¼ sQE
ffiffiffiffiffiffiffiffiffiffiffiffiffiffiffiffiffiffiffiffiffi Xn
i¼1
x1i
s
2
s !Q!
¼ sQ2Q=2Gððn1QÞ=2Þ
Gðn=2Þ : ð3Þ
Note that the mean effect of mutations on the logarithm of fitness is proportional tosQ
as expected. For this last derivation we used the fact that the term in paren-theses is the (generalized) Qth moment of a chi distribution withndegrees of freedom.
Hence, in our model, epistasis at the fitness optimum has a mean directly linked to the parameterQ(Figure 2, A and B). As expected, whenQ¼2,E(e)¼0. IfQ.2, the mean epistasis at the optimum is negative. Since all mutations are deleterious, this means that they act synergistically, a double mutation being worse less than expected from the single effects. The opposite is true (positive or antagonistic epistasis) whenQ,2.
Away from the optimum:Let us now consider that we are away from the optimal fitness, at position ~z having fitnessf0and at a distancez0from the optimum.
Figure1.—(A) Representation of Fisher’s model in two dimensions. Here an organism is defined by a combination of its traits’ xandyvalues; its fitness is a function of the distance of its phenotype (x1,x2) to the optimum genotype (0, 0), and therefore fitness isoclines are circular. Mutations move an organism from one point of the phenotypic space to another. (B) Impact of parameterQ
Sðz0;sÞ ¼E sQ3 Xn
i¼1
zi1xi
s
2!Q=2
1 X
n
i¼1 ðziÞ2
!Q=2! :
The first term is sQ times the (generalized) raw
moment of order Q of a reduced, noncentered chi distribution with n degrees of freedom, which can be written as
2Q=2 Q 2 !L
n=21 Q=2
z02 2s2
with z0¼
ffiffiffiffiffiffiffiffiffiffiffiffi Xn
i¼1
zi2
s ;
withLbeing a generalized Laguerre function. Thus
Sðz0;sÞ ¼z
Q
0 1
s z0
Q 2Q=2 Q
2 !L n=21
Q=2
z20 2s2
#zQ0:
ð4Þ
The mean effect of mutations on log-fitness at a distance z0 from the optimum is thus the sum of a positive term zQ0, the maximal beneficial log-fitness effect (i.e., that of a mutation that moves the genotype exactly to the optimum), and a negative term (‘‘delete-rious contribution’’). If this delete(‘‘delete-rious contribution is large (s=z0 ?1) such that mutations become mostly deleterious as is the case at the optimum, we find again the mean log-fitness effect at the optimum:
Sðz0;sÞ
s=z0/‘
sQ2Q=2 Gððn1QÞ=2Þ
Gðn=2Þ :
The behavior ofSðz0;sÞasz0increases is depicted in Figure 2A. For Q ¼ 2, since L1n=21ðxÞ ¼ x1n=2, we have Sðz
0;sÞ ¼Q
¼2ns
2, which is independent of z0. For Q . 2, on average, mutations are also deleterious (Sðz0;sÞ, nsQ,0) and whenz0increases, the
abso-Figure2.—(A) Mean log-fitness effect of mutations as a function of the distance to the optimum. From up to down:Q¼0.5, 1,
1.5, 2, 2.5, 3. (B) The distribution of epistasis among pairs of mutations for several values ofQand of the number of dimensions. The mean effect of mutation on logarithm of fitness was normalized to be equal to0.2 in all conditions. (C) Impact of parameter
lute value of Sðz0;sÞ increases: mutations are more deleterious when one is far from the optimum than close to it.
IfQ$2, since mutations are deleterious on average, a first mutation tends to increase the distance from the optimum, where mutations are more deleterious (Q. 2) or as deleterious (Q¼2) as in the previous position. Thus, we again observe a negative mean epistasis ifQ. 2, but a null mean epistasis if Q ¼ 2. When Q . 2,
Sðz0;sÞ,0 decreases more rapidly (mutations becom-ing on average more deleterious) as z0 increases if
s is large than if s is small (not shown); thus, when mutational effect increases, the absolute value of epistasis should also increase (epistasis becoming more negative).
ForQ,2, the behavior ofSðz0;sÞis more complicated and can be positive (i.e., mutations can be advantageous on average) or negative. However, it seems that for 1#Q,2, as the log-fitness is still a concave function of the distance to the optimum (Figure 1, B and C), the mean effect of advantageous mutations (decreasing the distance to the optimum) is smaller than the mean effect of deleterious mutations (increasing the distance to the optimum). Since the proportion of deleterious muta-tions is higher than the proportion of beneficial ones (Fisher 1930), mutations stay deleterious on average. Nevertheless in contrast to what happens whenQ . 2, mutations are on average less deleterious far from the optimum than close to it, so that we can expect epistasis among pairwise mutations to be positive on average. For Q,1, the log-fitness function is convex (Figure 1, B and C) and, depending on the distance to the optimum and the standard deviations, mutations can be either deleterious (close to the optimum) or beneficial (far from the optimum) on average (Figure 2A).
We can also see in Figure 2A that the curvature of the mean log-fitness effect of mutations decreases when the distance to the optimum increases: epistasis should be more pronounced close to the optimum than far from the optimum.
The epistasis between two random mutations can be written as
e¼ X
n
i¼1
ðzi1x1i1x2iÞ2
!Q=2
1 X
n
i¼1
ðzi1x1iÞ2
!Q=2
1 X
n
i¼1
ðzi1x2iÞ2
!Q=2
X
n
i¼1 ðziÞ2
!Q=2
e¼ sQ32Q=2 X
n
i¼1
zi1x1i1x2i
ffiffiffi 2 p
3s
2!Q=2
1sQ
3 X
n
i¼1
zi1x1i
s
2!Q=2
1sQ3 X
n
i¼1
zi1x2i
s
2!Q=2
X
n
i¼1 ðziÞ2
!Q=2
and the mean epistasis among pairs of mutations as
eðz0;sÞ ¼ 2Q=2sQE Xn
i¼1
zi1yi
ffiffiffi 2 p
3s
2!Q=2!
12sQE X
n
i¼1
zi1xi
s
2!Q=2!
X
n
i¼1 ðziÞ2
!Q=2
withyi¼x1,i1x2,i. And
eðz0;sÞ
¼sQ2Q Q
2 ! L
n=21
Q=2
z2 0
4s2
121Q=2Ln=21
Q=2
z2 0
2s2
zQ0:
ð5Þ
Note that forQ¼2, sinceL1n=21ðxÞ ¼ x1n=2,E(e)¼0. To make appear more clearly the dependency of the mean epistasis ons, we can write
eðz0;sÞ ¼ 2
2QLn=21
Q=2 ððz 2
0=4s2ÞÞ z
Q
0=sQ
2Q=2Ln=21
Q=2 ððz20=2s2ÞÞ z
Q
0=sQ !
Sðz0;sÞ
or
eðz0;sÞ ¼ 22Q=2
sðz0=
ffiffiffi
2 p
sÞ
sðz0=sÞ
Sðz0;sÞ;
where the reduced variable sðz0=sÞ ¼Sðz0;sÞ=sQ
de-pends only on the ratioz0/s.
This last expression shows that, as expected, the mean epistasis is homogeneous to a mutational effect on log-fitness,i.e., homogeneous tosQ.
We also see that whenz0=sconverges to 0, the mean epistasis increases linearly with the mean effect of mu-tation on log-fitness as found around the optimum value as
sðz0=sÞ /
z0=s/0
sð0Þ ¼ 2Q=2Gððn1QÞ=2Þ Gðn=2Þ
and sðz0=
ffiffiffi
2 p
sÞ
sðz0=sÞ
/
z0=s/0 1:
Finally, by writing
eðz0;sÞ ¼sQð2Q=2sðz0= ffiffiffi
2 p
sÞ 2sðz0=sÞÞ
we clearly see the contribution of each factor on epistasis: the difference in parentheses is the difference between the effect of the double mutation (pffiffiffi2sis the standard deviation of the distribution of the double mutation, which makes a factor 2Q=2sQ appear because
of the form of the log-fitness with aQexponent) and the sum of each single mutational effect.
the mean effect of mutations, it has no impact on its relationship with the average epistasis; i.e., for any phenotypic complexity the relationship between the average effect of mutations on the logarithm of fitness and the average epistasis between pairs of mutations is unchanged (data not shown). As expected, aroundQ¼ 2, the mean pairwise epistasis is negative ifQ. 2 and positive ifQ,2.
We can further see that, as expected in this model, around the optimum, the more distant an organism is from the optimum, the smaller the mean epistasis is among its mutations (Figure 2D).
Evolution of the parameter Q: Now that we have shown how epistasis is related to the parameterQ, we can study the selective pressure acting on Q. We now assume that in addition to their position in the phenotypic space, organisms have a genetically encoded value of Q that is itself subject to mutations. We are therefore in the theories of modifiers, in which we study how a trait controlling the parameterQevolves. We once again concentrate on Fisher’s model and therefore consider haploid asexual organisms.
Mutation–selection–fixed-drift equilibrium theory: We re-cently studied Fisher’s model at mutation–selection– fixed-drift equilibrium (MSFDE) with low mutation rate and showed that the equilibrium fitness depends only on the population size, the number of dimensions, and the parameterQ(Tenaillonet al.2007). We can use a similar formalism to study the evolution ofQ and its distribution at equilibrium. In such formalism,nis the phenotypic complexity,fthe fitness, andva population size parameter such thatv¼2N2 in the haploid case with N being the population size in a Wright–Fisher model.
It is important to note that the framework considers only transiently dimorphic populations: a resident popu-lation, fully homogeneous, in which a single mutant oc-curs, either affecting the phenotypes or affecting the modifier allele, appears and gets either fixed or lost ac-cording to its fitness relative to that of the first resident. In such a process, the probability that a mutation gets fixed depends on both the fitness of the resident and the fitness of the mutant (and the intensity of drift). If it gets fixed, the mutant then becomes the new resident. However, as this process goes on and mutations get successively fixed, this probability converges to a stable distribution that does not depend on the fitness of the first resident (i.e., the beginning of the process) anymore. Thus after several fixations of mutations, the probability that the current resident has a given fitness becomes constant: this is the fitness distribution at MSFDE.
If the mutations affecting the modifierQof epistasis are rare, the population will reach the MSFDE beforeQ mutates. We can then compute the fitness distribution at MSFDE given a fixed value ofQ (Sellaand Hirsh 2005; Tenaillonet al.2007),
pMSFDEðf jQÞ ¼
fnðLogðfÞÞðn=QÞ1 Ð1
0 f
nðLogð
fÞÞðn=QÞ1df ;
or, translated into the distance zto the optimum (the probability distribution of distance to the optimum),
pMSFDEðz jQÞ ¼
enzQ zn1
Б
0 e nzQ
zn1dz;
which gives for the mean fitness and the mean log-fitness (a ‘‘*’’ in the following formula indicates a mean taken with respect to the equilibrium distribution)
fðQÞ*¼ n
n11
n=Q
and
LogðfðQÞÞ*¼ n
Qn ¼ Kðn;Q;NÞ
and a mean distance to the optimum
zðQÞ*¼Gððn11Þ=QÞ
Gðn=QÞ 3 1
v1=Q Kðn;Q;NÞ
1=Q:
The parameter K reflects the mean log-fitness at equilibrium and reflects therefore an intensity of drift; the higherKis, the lower the fitness. Note that it allows for the definition of an effective population sizeNethat sums up the intensity of drift in this model. Taking as a reference a fitness landscape with no epistasis (Q ¼2) and the smallest complexity (n¼1), we define
Neðn;Q;NÞ ¼
1
4Kðn;Q;NÞ N3 Q 2n
such that
Neðn¼1;Q ¼2;NÞ N:
Nequantifies the intensity of drift since
LogðfðQÞÞ*¼ 1 4Ne
fðQÞ*eð1=4NeÞ;
i.e., the smallerNeis, the higher the intensity of drift and the higher the fixed-drift load.
We note that these results are strictly valid when the mutation rate is very small such that the effect on fitness of the recurrent production of the deleterious mutant is neglected. For only small mutation rates these values have to be modified by a factor eU
, withU being the mutation rate [e.g.,fðQÞ*eð1=4NeÞU].
sQ/Q9 Log
fðz;Q9Þ fðz;QÞ
¼zQ zQ9¼zQð1zQ9QÞ:
Thus ifz,1,z(Q9Q),1 ifQ9 .Q: a mutation increasing Q should be selected for. On the contrary ifz . 1, Q should decrease upon selection.
The effect of drift is to impede the population from approaching the optimum. When drift is intense, z should be on average .1. Whereas when selection is efficient, z , 1 and the population is closer to the optimum. The further evolution of Q will therefore depend on this balance between drift and selection. The effect of a mutation that changesQ, taking into account this balance, can be measured by computing the mean selective effect of a mutation ofQat MSFDE,i.e., taking into account the probability that the distance from the optimum of the resident isz:
sQ/Q9*¼
ð‘
0
ðzQ zQ9ÞpMSFDEðzjQÞdz
sQ/Q9*¼ n
vQ
1 vQ9=Q
Gðn=Q1Q9=QÞ
Gðn=QÞ :
Ifn?Q(e.g.,n/Q.5 or 10, and in the following we assume this condition holds true), then asQ9should be of the order ofQ,n/Q?Q9/Qand
Gðn=Q1Q9=QÞ
Gðn=QÞ ðn=QÞ Q9=Q;
thus
sQ/Q9*Kð1KðQ9QÞ=QÞ ¼Kð1eððQ9QÞ=QÞLogðKÞÞ ð6Þ
and
sQ/Q9*.0ðQ Q9ÞLogðKÞ.0:
IfK.1 (intense drift), thenQ9 ,Qis selected for. The inverse is true forK,1 (strong selection). Selection will favor high or low values ofQdepending on the intensity of drift. Note that usuallyQis of the order of 1, such that Kis of ordern/Nand the direction of selection onQis generally set byn/N: when selection is strong,i.e., when n/Nis small, selection will favor an increase ofQ, while when drift dominates the process, selection will favor a smallQ(Figure 3).
Is this selection efficient? In other words do we have jN sQ/Q9*j.1? If K ? 1 and Q9 , Q, then
N sQ/Q9*n=2Q.1 whereas if Q9 . Q, then
N sQ/Q9* ðn=2QÞQ
9=Q,
1; in other words, whenK?1,Q9 ,Qis selected for, whereasQ9 .Q is selected against. The opposite is true whenK>1. In the intermediate case, when K is of the order of 1, N sQ/Q9* ððQ9QÞ=QÞNðK1Þ, which can be small ifK11=N. ForNnot too small, around the threshold valueK¼1, a slight change (i.e.,.1/N) of the
value ofKcan result in a sharp change in the mean di-rection of evolution of epistasis (i.e.,Q¼2 is ‘‘unstable’’). Hence we see that a change ofQcan be selected for in populations and that depending on the intensity of drift (parameter K, or 1/4Ne, in our model) selection will either favor high or low values ofQ. It is important to note that an intense drift does not mean here that there is no selection at all. When drift is intense (K?1), the population tends, on average, to be delocalized from the optimum and is in a region where a mutation that changesQcan have a substantial effect on fitness and therefore selection for or against this change can be strong. Interestingly, the intensity of drift depends onQ: K ¼1=4Ne}1=Q. Thus a high value of Q (e.g., large negative epistasis) tends to increase selection for still higher values ofQ(more negative epistasis) ifn/N>1 and to reduce selection for small values ofQifn/N?1, whereas a small value ofQ(e.g., positive epistasis) tends to increase selection for still smaller Q(more positive epistasis) ifn/N?1 and to decrease selection for high values ofQifn/N>1. The precise value ofQcould also be decisive in the special situation wheren/N1.
On a longer term the equilibrium will be reached both by the phenotypes and by the modifier of epistasis. Figure3.—(A) Impact of population size on the average
Importantly, if mutations of the modifierQare not rare (i.e., as frequent as those affecting the classical traits), this equilibrium does not need a longer time to be reached. The evolutionary tendency of Q at this new equilibrium will reflect the one at the first equilibrium. Especially in cases where selection for increasing Q (strong selection) or decreasing Q (intense drift) is efficient,Qwill rapidly reach its maximal valueQmaxor its minimal valueQminand stay for a long time at this value. However, when selection for either large or small values of Q is not very strong, the evolution of Q will mostly depend on the dynamics of the system,i.e., on the mutational spectrum, the mutation rate, and the initial conditions.
At a long timescale, the probability density ofQcan be written as
pðQÞ ¼ ðnÞ
n=QðGðn=QÞ=QÞ
ÐQmax QminðnÞ
n=qðGðn=qÞ=qÞdq ð7Þ
such that the unconditioned mean fitness is
f*¼
ÐQmax Qminðn11Þ
n=qðGðn=qÞ=qÞdq
ÐQmax QminðnÞ
n=qðGðn=qÞ=qÞdq
and the meanQis
Q*¼
ÐQmax QminðnÞ
n=qGðn=qÞdq
ÐQmax QminðnÞ
n=qðGðn=qÞ=qÞdq: ð8Þ
These functions cannot be integrated but can never-theless be explored numerically. First of all it appears, as expected, that when drift is strong (i.e., small popula-tion size, large phenotypic complexity),Qevolves to its minimal value, favoring positive epistasis. On the opposite, when selection is stronger than drift (large population size, small phenotypic complexity), Q evolves to its maximum value, hence favoring negative epistatic interactions among pairs of mutations. This is illustrated in Figure 3, A and B, in which we can see that for a given population size as phenotypic complexity increases Q evolves from the maximum value to the minimum, and similarly at a given phenotypic complex-ity, as population size increases, Q evolves from the minimum value to the maximum. Hence depending on the interplay between population size and the pheno-typic complexity, selection should favor either strong negative epistasis or strong positive epistasis among pairs of mutations.
It is interesting to note that if we assume that the modifier ofQaffects only a fractionmof the dimensions, such that fitness can be written asfð~xÞ ¼e P
m i¼1x
2
i ð ÞQ1=2
Pn i¼m11x
2
i
ð ÞQ=2
, the modifier affecting only Q1, then the equilibrium value ofQ1is the same as in the previ-ous model with a phenotypic complexity ofm. As noted before (Tenaillon et al. 2007), at equilibrium each
dimension behaves as if it were independent from the others (independent traits).
Simulations: The derivations we used assume that populations have converged to the MSFDE and are therefore to be used in the limit of infinite time. They are also based upon the hypothesis of a small mutation rate. We therefore decided to implement some simu-lations to see how valid they are. An individual-based model of evolution was developed [as previously de-scribed (Silanderet al.2007)] in which the parameter Q was encoded for each individual. Along the evolu-tionary process the mean Q of the population was monitored to find its equilibrium value after 100 million generations. We chose different initial values ofQ, the mutation rate, and the mean mutation size in the phenotypic space to determine the impact of those parameters on the final equilibrium. The parameterQ evolved through mutations 1000 times less frequently than mutations affecting the phenotypes and was then drawn from a uniform distribution between its minimal and maximal value.
From such simulations it appeared that the theoret-ical model was qualitatively very accurate for various mutation rates and mean effects of mutations, but that the switching point, whereQmoves from maximal value to minimal, is not precisely estimated (Figure 4C). Indeed, we could find three regimes, two in which both theories and simulations agree fully and one in which they do not.
When population sizes are big and phenotypic complexity is small (K>1), even at the smallest value ofQthe population at MSFDE is at a distance from the optimum,1 [Kmax¼n/(2N2)Qmin,,1; Figure 4A, second panel]. Hence, whatever the initial value ofQor the initial fitness of the population is, selection will bring the population toward a smaller than unity distance from the optimum. For an organism whose distance to the optimum is,1, a mutation increasingQ is always beneficial as it directly increases its fitness (see Figure 1). Hence for all populationsQwill evolve to its maximal value as predicted by theory (Figure 4A).
Similarly when populations are small and/or pheno-typic complexity is large (K?1), even at the highest value ofQ, the distance to the optimum is.1 [Kmin¼n/ (2N 2)Qmax,.1; Figure 4A, bottom panel]. Hence, whatever the initial conditions are on the initial fitness or the initial value ofQof the population, drift will bring the population to a bigger than unity distance to the optimum. For an organism whose distance to the optimum is .1, a mutation decreasing Q is always beneficial as it directly increases it fitness (see Figure 1). Hence for all populations Q will evolve to the minimal value ofQas predicted by theory (Figure 4A). In between these two cases [forQmin,n/(2N2),
ofQ is larger than unity. In this range, there are two attractors, and depending on the initial conditions, on the frequency of mutations acting onQ and, on their effect onQ, a population will either evolve to a distance smaller than unity and therefore evolve toward the maximal Q or evolve to bigger than unity distance favoring minimal values ofQ(Figure 4A, third panel). We confirmed this by initiating different populations at their equilibrium distance from the optimum with different values ofQ, and, as expected depending on their positions, they favored either the minimal or the maximal value ofQ(Figure 4C).
The study of the averageQat MSFDE does not predict clearly this instability (since at equilibrium—when time goes to infinity—the initial values do not matter); however, with a closer look at the distribution ofQ at MSFDE, we can see that high probabilities are observed at both high and low values of Q in the region of
instability we described previously (Figure 4B). Hence the discrepancy between simulations and theory lies in the fact that MSFDE reflects very long-term equilibrium while simulations might get trapped in some local optimum and infinite time would be required for the theoretical limit to be reached.
In the simulations presented previously, no clear effect of the average size of mutations was observed on the patterns described; whether the average mutation size was 0.01 or 100, the transition ofQbetween extreme values was observed at the same ratio of phenotypic complexity to population sizes (data not shown).
Impact of the mutation rate: In the simulations pre-sented before, the genomic mutation rate was assumed to be quite low,i.e., 0.001 per generation, which ensured that the simulation was fast and in conditions compat-ible with the formalism used for MSFDE. However, we wanted to know how robust such results are in the face of Figure4.—(A) Fitness as a function of the distance to the optimum and parameterQ, and distance distributions at MSFDE. Top
panel: log-fitness as a function of the distance to the optimum forQmax¼2.5 (solid line) andQmin¼0.8 (shaded line). Second,
third, and fourth panels: density distribution of the distance to the optimum at MSFDE (‘‘short-term equilibrium’’) for a givenQ:
increased mutation rate. To do so we increased the mutation rate to 0.1 and followed in a population size of 100 the evolution of Q. Similarly to what has been observed before, a shift occurred as a function of phenotypic complexity, arising at different phenotypic complexities for various initial conditions of Q. The value at which the shift occurred was, however, affected by the mutation rate. It arose at lower values of phenotypic complexity compared to simulations with a lower mutation rate (Figure 5).
This shift is somehow expected as we know that an increased mutation rate will have two consequences. First, it will allow the population to explore more the genotypic space and therefore enhance the chances to find the best solution, either low or highQpredicted by theory. Hence increased mutation rate should favor a transition in Q closer to the one predicted by theory. Second, an increase in mutation rate reduces the average fitness as many deleterious mutants are present within the population (Haigh1978) and is also equiv-alent to a reduction in effective population size (Charlesworth et al.1993). This effect results in an increased distance to the optimum and therefore a faster transition to low values ofQas phenotypic com-plexity increases. The first and second effects described act synergistically when the transition of Q occurs at higher than expected phenotypic complexity and result in a transition occurring much closer to the theoretical value (Figure 5). However, when the transition occurs at a lower than expected value of phenotypic complexity, the effects are antagonistic and result in a moderate displacement of the transition point (Figure 5).
DISCUSSION
Since the ‘‘omic’’ era (genomic, transcriptomic, pro-teomic, metabolomic), the study of interactions be-tween an organism and its environment or interactions
within an organism’s genome is becoming more feasible experimentally, generating a renewed interest for the theories aiming at understanding how selection should shape the genomic architecture of organisms. While it is clear that all kinds of interactions could exist within a genome, one of the goals of population genetics is to see whether such interactions could be captured by some summary statistics that would on the one hand describe the genomic architecture of the organism and on the other hand be predictive of the various selective pres-sures acting on such an organism. In genetics, epistasis refers to the existence of some genetic interactions between some loci; in population genetics it refers more precisely to how such interactions affect phenotypes and fitness (Wolf et al. 2000). Generally two kind of epistasis are opposed: antagonistic epistasis in which the combination of mutations has a fitness closer to the ancestral fitness than what is expected from their in-dividual effects and synergistic epistasis in which the combination of mutations has an increased fitness effect (more distant from the ancestral fitness) compared to that expected. The other formalism that we use here refers to positive or negative epistasis. Positive epistasis refers to the fact that combinations of mutations that are beneficial, deleterious, or a mixture of both have fitness values higher than the ones expected from the product of the fitness effects of single mutants. Negative epistasis refers to the opposite situation in which mu-tations in combination have a lower than expected fitness effect.
To study how epistasis influences population evolu-tion and how it can evolve, one can study a locus controlling epistasis, its impact on the population, and the selective pressures acting on it. One classical framework to do so is to assume a single peak fitness landscape in which epistasis can modulate how fitness will decay as organisms accumulate deleterious muta-tions. Epistasis is then chosen to be homogenous among loci, being either positive or negative. With this frame-work it was shown that epistasis could largely influence the way populations would respond to selection (Kimuraand Maruyama1966; Charlesworth 1990; Kauffman1993; Hansenand Wagner2001;deVisser and Elena2007), and some recent studies have shown how natural selection shapes epistasis (Libermanand Feldman2005, 2006, 2008; Desaiet al.2007; Liberman et al. 2007). However, all experimental data, to date, have found that both kinds of epistasis were present simultaneously (Elenaand Lenski1997; Sanjuanet al. 2005; Jasnos and Korona 2007), and therefore such theories should be revisited to see how robust they are to the presence of both kinds of epistasis (Kouyos et al. 2006, 2007). To go further in such a direction, one needs a proper framework in which epistasis can be distributed with both positive and negative interactions, with positive or negative averages ( Jasnosand Korona 2007), and with a distribution that has potentially some Figure5.—Impact of the mutation rate on the evolution of
biological meaning. In this article, we present a theo-retical framework that on the one hand provides a distributed epistasis with nonzero mean and on the other hand allows us to study how epistasis evolves.
The framework we use is the one first briefly in-troduced by Fisher (1930) and presented briefly in Figure 1A. In the last decade a large number of theoretical studies and experimental works have used such a framework and showed its interest and validity to study evolution (Burch and Chao 1999; Orr 1999; Martin and Lenormand 2006; Silander et al. 2007; Tenaillonet al.2007). Two lines of investigations have been studied mainly: the study of the effect of mutations (Fisher 1930; Kimura 1962; Orr 1998, 1999, 2000, 2006; Welchand Meselson2001; Waxmanand Welch 2005; Martinand Lenormand2006) and the study of MSFDE (Wagner and Gabriel 1990; Hartl and Taubes1996, 1998; Poonand Otto2000; Tenaillon et al.2007). For our purposes, we use both aspects.
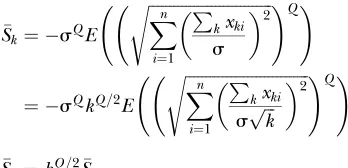
A direct link between mutation effects on fitness and epistasis: Using mutation models, we study here the epistatic interactions among pairs of mutations. First, as shown before (Martin et al. 2007), we find that the model provides a whole distribution of possible epistatic interactions among pairs of mutations (Figure 2B). Such a distribution can have both positive and negative epistatic interactions as it has been observed in bi-ological organisms. Moreover we show that the average epistasis is nonzero as long as Q is different from 2 (Figure 2C). Interestingly we find a tight link between epistasis and the mean effect of mutations on fitness logarithm. This observation is very interesting, as it agrees with the analysis of various in silico models in which a correlation between the effect of mutations and epistasis was found, and therefore suggests that such a model could be analyzed under Fisher’s model frame-work. Hence, we show that while the parameter Q is directly related to epistasis, it is also directly related to the effect of mutations on fitness, something that we could refer to as genetic robustness,i.e., how stable the fitness of an organism is in the face of mutations. Hence, as suggested before in a simple discrete model (Wilke and Adami2001), our formalism suggests that epistasis and genetic robustness might be intimately linked, without involving any selection mechanism: the corre-lation between the two appears as an emerging muta-tional property of the adaptive landscape and not a property resulting from the action of natural selection. The parallel with previous definitions of epistasis in discrete models can be pushed further. In genotypic models fitness is often defined as f kð Þ ¼eakb
, or Logðf kð ÞÞ ¼ akb
, with k being the number of muta-tions [f(0) being the optimal fitness],athe mean effect of the first mutation on logarithm of fitness, andbthe epistasis parameter. Using our formalism, ifSkdenotes
the average log-fitness of individuals withkmutations, we have, for allk,
Sk¼ sQE
ffiffiffiffiffiffiffiffiffiffiffiffiffiffiffiffiffiffiffiffiffiffiffiffiffiffiffiffiffiffi Xn
i¼1 P
kxki
s
2
s !Q!
¼ sQkQ=2E
ffiffiffiffiffiffiffiffiffiffiffiffiffiffiffiffiffiffiffiffiffiffiffiffiffiffiffiffiffiffi Xn
i¼1 P
kxki
spffiffiffik
2
s !Q!
Sk¼kQ=2S
such that we can writeSk¼ akb for allkwitha¼ S
andb¼Q=2. So a direct parallel betweenband Q/2 can be made. Interestingly, Wilke and Adami (Wilke 2001) predicted thataandbshould be negatively cor-related. In our framework, we haveS
n[1A ns 2
ð ÞQ=2if fitness is defined as fð~xÞ ¼eA P
n i¼1x
2
i
ð ÞQ=2
. Thus Q=2¼Log ðS=AÞ=Logðns2Þorb¼Logða=AÞ= Logðns2Þ. Asb. 0 (mutations are deleterious on average), ifa,A, then Logðns2Þ,0 andaandbare negatively correlated,b being approximately a log function ofaas seems to be the case in Wilkeand Adami’s (2001) study. It would be interesting to compare this result to their data, as the complexity of their system could then be estimated.
Finally, we show here that even with a definition of epistasis that should be independent of the effect of mutations (Equation 1) as it measures a relative change in effect, in our model, epistasis is directly linked to the average effect of mutations on log-fitness. Hence com-parative studies on the intensity of epistasis (Sanjuan and Elena 2006) should take this parameter into account.
Evolution of the parameter Q depends on drift:
Previous studies have analyzed the evolution of epistasis (Libermanand Feldman2005, 2006, 2008; Desaiet al. 2007; Libermanet al.2007). However, they focused on modifiers of epistasis acting on two loci or on modifiers of epistasis acting on many loci having mutations of similar effects on fitness. Our framework allows the study of a modifier that has an impact on a whole distribution of epistatic interactions, which is somehow more realistic. However, as there are many different effects of mutations, an unavoidable consequence is that the modifier affects not only epistasis but also the average fitness effects of mutations. Hence our analysis unravels, at least in this model, a mixed effect of the selection acting on a mod-ifier affecting epistasis. What we may lose in theoretical clarity, we gain in realism as we know that mutations in nature do not have a single effect and that epistasis appears to be distributed. Hence any global modifier of epistasis should be submitted to a selective pressure sim-ilar to the ones acting onQ.
in such large asexual populations deleterious mutants having a single or even more deleterious mutations are doomed to disappear and do not contribute to the long-term fate of the population. Hence, any modifier affecting the effect of single [modifier of genetic robustness (Gardnerand Kalinka 2006)] or double mutations [modifier of epistasis (Desaiet al.2007)] will be neutral. However, in sexual populations through recombination, individual having deleterious muta-tions can contribute to the production of mutation-free individuals and therefore epistasis is under selection. Therefore, previous studies have focused on the impact of recombination on the evolution of epistasis.
In contrast with those theoretical predictions, in asexual populations, evolution of genetic robustness has been observed (vanNimwegenet al.1999). This has been mainly studied theoretically through the framework of neutral networks, in which fitness of an organism is either maximal or null (corresponding to an infinite value ofQ in our model). In such a framework, the genotypes having the highest fraction of neutral neighbors are selected for because the fitness of the populations is linked not only to mutation rate as Haldane proposed in the absence of neutral mutations, but also to the fraction of neutral neighbors, the so-called neutrality. Indeed, as soon as the population is not doomed to stay at a single genotype of maximal fitness, selection can act on modifiers affecting the fitness of the explored genotypes. This was illustrated on the evolution of robustness by Krakauerand Plotkin (2002), who showed that a high mutation rate coupled with drift could lead to selection for genetic robustness. It is worth noting that they kept the assumption of high mutation rate, but that such an assumption is not necessary (Grosand Tenaillon2009). For a model like Fisher’s model, in which mutations can have arbitrarily small effects, some deleterious mutations will be fixed regardless of the population size. A modifier of epistasis that affects the fitness of those fixed mutations can therefore be under selection even if the mutation rate is almost null. Hence to study this selection we can first assume a near vanishing mutation rate to see how epistasis would evolve: this is the main reason why we choose to study epistasis in the MSFDE framework.
We have applied the MSFDE theory to Fisher’s model to study how the parameter Q would evolve (if evolv-able). In MSFDE theory, a population is always mono-morphic unless a single mutant appears. Depending on its effect, either on the phenotypes or on Q, such a mutant will either invade and become the new resident genotype or disappear. The interesting feature of Fish-er’s model on the MSFDE side is twofold. First, the results concerning the evolution ofQare independent of the mutational effects (cf.Equations 6 and 7) and therefore robust to the different distributions of muta-tion effects and to their mean; these parameters in-fluence only the speed of convergence to the equilibrium. Second, the theory combines phenotypic
complexity, epistasis, and population size in a global parameter to measure the efficiency of selection vs. drift. It can be shown that at MSFDE the mean logarithm of fitness isÆLogðfÞæ¼ ðn=Qð2N 2ÞÞ. Hence fitness at MSFDE decreases with phenotypic complexity (as it is harder to optimize simultaneously many traits); it is also affected, as expected, by the population size, and finally by the epistasis parameterQ(the higherQis, the higher the fitness at MSFDE): when mutations are mostly deleterious, increasing Q makes mutations more dele-terious on average and they are more easily selected against. However, this property makes the evolution of a modifier of epistasis different from that of a noncostly modifier of genetic robustness [for instance, the pa-rameter sor a parameter A modulating the selection intensity if fitness is defined as fð~xÞ ¼eA P
n i¼1x
2
i
ð ÞQ=2
]. The latter has no effect on mean fitness at equilibrium while a modifier of Q does. It appears therefore in-teresting to study the evolution ofQin Fisher’s model. Using MSFDE theory we find that the evolution of parameterQis influenced by the ratio of complexity to population size (Figure 3). When selection is strong,i.e., whenn/Nis small, selection will favor an increase ofQ, while when drift dominates the process, selection will favor a small Q. This was suggested by the theory and confirmed by simulations. Interestingly while our the-ory is based on the assumption of low mutation rate, simulations show that its range of validity includes large mutation rates (Figure 5). However, it is worth noting that while the model predicts very well the behavior of the population in the strong drift or strong selection regimes, it is better to use local selective pressure acting onQrather than long-term equilibrium predictions in the intermediate regime. A precise estimate of the time needed to reach equilibrium is not available here. However, this timeframe should depend mainly on the mutation rate of the modifier ofQas well as on the mean effect of a mutation acting on Q. Increasing the mutation rate of the modifier should shorten this relaxation time as it increases the probability to escape the local optimum. The effect of the size of mutations on this modifier is more complex: a reduction in this size can increase the probability to escape a local optimum (since mutations are less deleterious) while more mutations may then be needed to fully escape this optimum. An increase in the size may also increase the probability that a mutation passes through the valley between the two local optima.
(2007) for the vesicular stomatite virus (VSV) and the bacteriophage PhiX174. They found, respectively,n/Q 10 and45 for these two viruses coding, respectively, 5 and 11 genes. Intuitively the number of genes, the number of genetic interactions, and the diversity of environmental conditions may be parts of the determi-nants of this complexity. We have therefore no precise estimate of phenotypic complexity for other organisms but it is likely that it spans several orders of magnitude among life diversity, as the viruses studied previously are among the simplest life forms. Hence it is highly likely that some species may be subjected to selection for negative epistasis whereas others may be subjected to selection for positive epistasis.
Why should drift favor the evolution of antagonistic epistasis? When drift is strong, populations will not be clustered around the optimum but at some distance, natural selection failing to improve all phenotypic traits simultaneously. As positive epistasis improves the fitness of distant organisms (Figure 1B), it is hence favored under such conditions. In our model drift is just a pressure that pushes the populations away from the optimum.
Link with previous models: In large populations, other models have shown that positive epistasis was selected for in the presence of recombination; here, positive epistasis is selected for when drift is strong. In infinite sexual populations, populations are polymor-phic and recombination ‘‘moves’’ alleles in different genotypes, both optimal and nonoptimal, even if the populations keep some optimal genotypes present in the populations. Our analysis somehow suggests that this situation has some similarity with the evolution of finite asexual populations in which the best genotype is strongly drifting around the optimal genotype. A parallel can be made between the fraction of time spent by beneficial alleles in genotypes loaded with deleteri-ous mutations in the presence of recombination and the time spent by the asexual monomorphic population with a fixed deleterious mutation.
Some more interplay between our result and the existence of selection for recombination can be sug-gested. First, our model shows that when selection is efficient compared to drift, negative epistasis is favored. This could be interesting for the evolution of sex as the existence of negative epistasis is one of the conditions that favor selection for recombination (deVisserand Elena2007). Second, in the simulations we performed, we saw that under some ranges of parameters, the system can transiently (compared with infinite time) evolve to the maximal or the minimal value ofQ. In such a regime, any additional parameter that favors the efficiency of selection could lead to a switch toward a negative epistasis. This could be one of the bases of the evolution of the epistasis observed in regulatory net-works in which the addition of sexual exchanges leads to a more efficient selection and concomitantly to a
change of sign of epistasis toward negative epistasis (Azevedoet al.2006). It would therefore be interesting to see how the presence of genetic exchange in poly-morphic populations could affect MSFDE and affect the evolution of epistasis.
Impact of the evolution of Q on the mean fitness effect of mutations:In the analysis presented before, we showed independently how Q influences the mean epistasis and how Q should evolve. If we assume that mutations affecting Q are very rare, then populations will reach MSFDE and then mutateQstep by step (in a process similar to the process used in adaptive dynam-ics). If we assume that the population is exactly at the equilibrium distance from the optimum, we can then see how epistasis evolves as the parameterQevolves. As stated previously, the evolution ofQdoes not depend on the size of mutations in the phenotypic space, but the mean epistasis and the mean mutational effect on fitness do. We can therefore study the impact of the evolution of Q on both epistasis and fitness effects of mutations for several values of the mean distance that a mutation travels in the phenotypic space (parameters
in our formalism). When drift dominates the process, whatever the ‘‘size’’ of mutations, Q decreases and so does the mean effect of mutations (Figure 6A). Hence selection for lower values of Q is consistent with selection for robustness under a strong drift regime. It is, however, worth noting that in such conditions fitness at MSFDE decreases withQ, something similar to ‘‘the paradox of robustness’’ suggested in the evolution of robustness (Frank 2007) but involving in addition a fitness decline (Grosand Tenaillon2009).
When selection is efficient and favors a high value of Q, we can see that the mean mutational effect on fitness either increases or decreases depending on the size of mutations (Figure 6B). If mutations are ‘‘small,’’ their effect on fitness will decrease with increasing Q, while when they are big the opposite is true. This is not expected if selection for epistasis is strictly equivalent to selection acting on the mean effect of mutation or genetic robustness. In fact, in such a long-term process, it is not the average effect of mutations on fitness that matters, but rather the fraction of mutations that could contribute to the population evolutionary fate, i.e., mutations that could be fixed. In this sense the evolution of the parameterQalways favors a decreasing effect on fitness of small size mutations.
Hence our analysis suggests that care should be taken in analyzing experimental data, as the mean effect of mutations that will be often used as the measure of robustness and used for epistasis might be a bad indicator of what has been selected for in populations.
and on position in the phenotypic space. Similarly to what was done in the previous paragraph we can study how the intensity of epistasis evolves asQmoves toward its maximal or minimal value. When low values ofQare selected for, depending on the minimal value of Q, either strong positive epistasis will emerge or almost null epistasis for very low values ofQ (Figure 7A). When selection favors high values ofQ, it appears that strong negative epistasis is selected upon when mutations have large effects and almost no detectable epistasis is observed for small-effect mutations (Figure 7B).
Interestingly, in a very large range of conditions, the model predicts that the intensity of epistasis should evolve to be significantly different from zero. Hence, under this asexual model of evolution, strong interac-tions among mutainterac-tions should emerge in either di-rection depending on the intensity of drift. With such
an increase in the interactions between mutations, our model suggests that the evolution of modularity, which would favor the lack of interactions between mutations, is unlikely in asexual populations. This observation is in good agreement with in silicomodels of evolution that showed that populations tend not to favor the evolution of modularity unless genetic exchanges (Misevicet al. 2006) or fluctuating environments (Kashtanand Alon 2005) are present.
Multiple modifiers of epistasis:We previously focused our analysis on a global modifier of epistasis that would affect all traits simultaneously. Our formalism, however, allows us to study many independent modifiers of epis-tasis that would each affect independently m different subgroups ofnktraits such that fitness would be defined
as fð~xÞ ¼eP m k¼1
Pnk
i¼1x 2
i ð ÞQk=2
. In such a system, each group of traits and its modifier evolve independently, according to its number of traits or phenotypic complex-ity. Small subgroups of traits will tend to evolve toward the maximal value ofQ, as the effective drift is reduced for such parameters while a modifier of a large number of traits will tend to favor minimal values of Q. Hence a complex composite epistasis could emerge, depending on the range of action of modifiers (parameternk).
Interestingly for a protein, it was shown that an increased stability results in a decreased effect of Figure6.—(A) Impact ofQon the mean effect of mutation
on log-fitness at MSFDE when selection favors low values ofQ. Populations are assumed to be at the mean distance for their value ofQat MSFDE. For all sizes of mutations in phenotypic space, the average effect of mutation on fitness decreases with decreasingQ. n¼10,N¼100, and the standard deviations of the mutation size in phenotypic space are s ¼ 0.05 (solid line),s¼0.1,s¼0.2,s¼0.3, and s¼0.5 (dotted line). (B) Impact ofQon the mean effect of mutation on log-fitness at MSFDE when selection favors high values ofQ. Depending on the size of mutations in phenotypic space, the average ef-fect of mutation on fitness increases or decreases with increas-ing Q. n ¼ 100, N ¼ 30, and the standard deviations of mutation size in phenotypic space ares¼0.05 (solid line), s¼0.1,s¼0.2,s¼0.3, ands¼0.5 (dotted line).
Figure7.—(A) Impact ofQon the mean epistasis among
mutations at MSFDE when selection favors low values of Q
mutations and an increased negative epistasis as the first mutation is less likely to disrupt the protein function while pairs of mutations could still do it (Bloomet al. 2005; Bershteinet al.2006). Hence it appears first that a local control of epistasis can be achieved by acting on protein stability and second that the observed stability of proteins suggests the existence of negative epistasis. A global control of epistasis could occur through the induction of chaperones. Once a badly folded protein is present, chaperones are induced to allow its proper refolding. This results in a strong positive epistasis (Maisnier-Patin et al. 2005), as once a deleterious mutation induces an increased level of chaperones, these helper proteins can also buffer the deleterious effects of additional mutations in other proteins. Hence, as suggested in our model, it appears that single-trait modifiers of epistasis favor negative epistasis while global regulators favor positive epistasis.
Concluding remarks: The model we present here provides an interesting framework to study the distribu-tion of epistasis, its influence on populadistribu-tion evoludistribu-tion, and the selective pressure acting on epistasis. We have shown the existence of a strong link between epistasis and the mean effect of mutations on the logarithm of fitness and shown that at MSFDE, drift would largely influence the evolution of epistasis. More should be done to study how robustness, recombination, and mutation rates would be affected by the form of epistasis present in this model and reciprocally how they in-fluence the evolution of epistasis.
We thank Erick Denamur, Guillaume Martin, Olivier Martin, and Olin Silander for helpful discussions. Simulations were performed at the ‘‘Centre de Calcul’’ of Institut Fe´de´ratif de Recherche (IFR) 02 in the Paris 7 Denis Diderot Medical School. This work was funded by the Agence Nationale de la Recherche (ANR-05-JCJC-0136-01). P.-A.G. was funded by the De´le´gation Ge´ne´rale a` l’Armement.
LITERATURE CITED
Azevedo, R. B., R. Lohaus, S. Srinivasan, K. K. Dangand C. L.
Burch, 2006 Sexual reproduction selects for robustness and
negative epistasis in artificial gene networks. Nature440:87–90. Barton, N. H., and S. P. Otto, 2005 Evolution of recombination
due to random drift. Genetics169:2353–2370.
Beerenwinkel, N., L. Pachter, B. Sturmfels, S. F. Elenaand R. E.
Lenski, 2007 Analysis of epistatic interactions and fitness
land-scapes using a new geometric approach. BMC Evol. Biol.7:60. Bershtein, S., M. Segal, R. Bekerman, N. Tokuriki and D. S.
Tawfik, 2006 Robustness-epistasis link shapes the fitness
landscape of a randomly drifting protein. Nature444:929–932. Bloom, J. D., J. J. Silberg, C. O. Wilke, D. A. Drummond, C. Adami
et al., 2005 Thermodynamic prediction of protein neutrality. Proc. Natl. Acad. Sci. USA102:606–611.
Bonhoeffer, S., C. Chappey, N. T. Parkin, J. M. Whitcomband C. J.
Petropoulos, 2004 Evidence for positive epistasis in HIV-1.
Sci-ence306:1547–1550.
Burch, C. L., and L. Chao, 1999 Evolution by small steps and
rug-ged landscapes in the RNA virus phi6. Genetics151:921–927. Burch, C. L., and L. Chao, 2004 Epistasis and its relationship to
canalization in the RNA virus phi 6. Genetics167:559–567. Butcher, D., 1995 Muller’s ratchet, epistasis and mutation effects.
Genetics141:431–437.
Charlesworth, B., 1990 Mutation-selection balance and the
evolu-tionary advantage of sex and recombination. Genet. Res.55:199– 221.
Charlesworth, B., M. T. Morgan and D. Charlesworth,
1993 The effect of deleterious mutations on neutral molecular variation. Genetics134:1289–1303.
deVisser, J. A., and S. F. Elena, 2007 The evolution of sex:
empir-ical insights into the roles of epistasis and drift. Nat. Rev. Genet.
8:139–149.
de Visser, J. A. G. M., R. F. Hoekstra and H. van den Ende,
1996 The effect of sex and deleterious mutations on fitness in Chlamydomonas. Proc. R. Soc. Lond. Ser. B Biol. Sci.263:
193–200.
de Visser, J. A. G. M., R. F. Hoekstra and H. van den Ende,
1997 An experimental test for synergistic epistasis and its appli-cation in Chlamydomonas. Genetics145:815–819.
Denamur, E., and I. Matic, 2006 Evolution of mutation rates in
bac-teria. Mol. Microbiol.60:820–827.
Desai, M. M., D. Weissmanand M. W. Feldman, 2007 Evolution can
favor antagonistic epistasis. Genetics177:1001–1010.
Elena, S. F., and R. E. Lenski, 1997 Test of synergistic interactions
among deleterious mutations in bacteria. Nature390:395–398. Fisher, R. A., 1930 The Genetical Theory of Natural Selection.Oxford
University Press, Oxford.
Fisher, R. A. (Editor), 1958 The Genetical Theory of Natural Selection.
Dover, New York.
Frank, S. A., 2007 Maladaptation and the paradox of robustness in
evolution. PLoS ONE2:e1021.
Gardner, A., and A. T. Kalinka, 2006 Recombination and the
evo-lution of mutational robustness. J. Theor. Biol.241:707–715. Goodnight, C. J., 1988 Epistasis and the effect of founder events on
the additive genetic variance. Evolution42:441–454.
Gros, P. -A. and O. Tenaillon, 2009 Selection for chaperone-like
mediated genetic robustness at low mutation rate: impact of drift, epistasis and complexity. Genetics (in press).
Haigh, J., 1978 The accumulation of deleterious genes in a
popu-lation–Muller’s ratchet. Theor. Popul. Biol.14:251–267. Hansen, T. F., and G. P. Wagner, 2001 Epistasis and the mutation
load: a measurement-theoretical approach. Genetics158:477–485. Hartl, D. L., and C. H. Taubes, 1996 Compensatory nearly neutral
mu-tations: selection without adaptation. J. Theor. Biol.182:303–309. Hartl, D. L., and C. H. Taubes, 1998 Towards a theory of
evolution-ary adaptation. Genetica102–103:525–533.
Jasnos, L., and R. Korona, 2007 Epistatic buffering of fitness loss in
yeast double deletion strains. Nat. Genet.39:550–554. Kashtan, N., and U. Alon, 2005 Spontaneous evolution of modularity
and network motifs. Proc. Natl. Acad. Sci. USA102:13773–13778. Kauffman, S., 1993 The Origin of Order. Oxford University Press,
New York.
Kimura, M., 1962 On the probability of fixation of mutant genes in
a population. Genetics47:713–719.
Kimura, M., and T. Maruyama, 1966 The mutation load with
epi-static gene interactions in fitness. Genetics54:1337–1351. Kondrashov, A. S., 1993 Classification of hypotheses on the
advan-tage of amphimixis. J. Hered.84:372–387.
Kondrashov, A. S., 1994 Muller’s ratchet under epistatic selection.
Genetics136:1469–1473.
Kouyos, R. D., S. P. Ottoand S. Bonhoeffer, 2006 Effect of varying
epistasis on the evolution of recombination. Genetics173:589–597. Kouyos, R. D., O. K. Silanderand S. Bonhoeffer, 2007 Epistasis
between deleterious mutations and the evolution of recombina-tion. Trends Ecol. Evol.22:308–315.
Krakauer, D. C., and J. B. Plotkin, 2002 Redundancy,
antiredund-ancy, and the robustness of genomes. Proc. Natl. Acad. Sci. USA
99:1405–1409.
Liberman, U., and M. W. Feldman, 2005 On the evolution of
epis-tasis I: diploids under selection. Theor. Popul. Biol.67:141–160. Liberman, U., and M. W. Feldman, 2006 Evolutionary theory for
modifiers of epistasis using a general symmetric model. Proc. Natl. Acad. Sci. USA103:19402–19406.
Liberman, U., and M. Feldman, 2008 On the evolution of epistasis III:
the haploid case with mutation. Theor. Popul. Biol.73:307–316. Liberman, U., A. Puniyaniand M. W. Feldman, 2007 On the
evo-lution of epistasis II: a generalized Wright-Kimura framework. Theor. Popul. Biol.71:230–238.
Maisnier-Patin, S., J. R. Roth, A. Fredriksson, T. Nystrom, O. G.
Berget al., 2005 Genomic buffering mitigates the effects of