Available online: https://edupediapublications.org/journals/index.php/IJR/ P a g e | 1886
A Study of Merchandise Trade Pattern among BRICS Nations
*PROF. SANJIV KUMAR2
*AMBIKA SANGWAN1
1 Research Scholar, Department of Commerce, M.D.University, Rohtak-124001, Haryana, India [email protected], +919729485642 (M)
2Professor, Department of Commerce, M.D.University, Rohtak-124001, Haryana, India,
[email protected] + 9255459062 (M)
Abstract:
The term "BRIC" was coined in 2001 by then-chairman of Goldman Sachs Asset Management, Jim O’Neill. The BRICS members are all developing or newly industrialised countries, but they are distinguished by their large, fast-growing economies and significant influence on regional and global affairs. The BRICS member countries together have largely taken the form of a political organiza tio n with periodic summits and declarations on issues concerning the global economy and foreign policy. The purpose of this paper is to study the merchandise trade pattern within the BRICS member countries. The paper includes a conceptual discussion of the economic indicators of BRICS nations. To achieve the objective of the study secondary data were collected from UN COMTRADE, UNCTAD and World Bank databases for the period 2005-2015. The study found that the major share of exports
of BRIS (Brazil, Russia, India and South Africa) goes to china that clearly shows the dominance of China in Intra-BRICS exports. But only a small percentage of China’s total merchandise exports went to Brazil, Russia, India and South Africa. It was also found that major share of intra-BRICS imports of BRIS (Brazil, Russia, India and South Africa) comes from China during the study period that clearly shows the dominance of China in Intra-BRICS imports. But in case of China, it imports more from Russia than Brazil, Russia, India and South Africa.
KEY WORDS: BRICS, Intra-BRICS
Exports and Imports, FDI Flows, GDP.
Introduction
Available online: https://edupediapublications.org/journals/index.php/IJR/ P a g e | 1887 India, China and South Africa. The
grouping was originally known as "BRIC" before the inclusion of South Africa in 2010. The BRICS members are all
developing or newly
industrialised countries, but they are distinguished by their large, fast-growing economies and significant influence on regional and global affairs; all five are G-20 members.
Thus far, however, the BRICS have largely taken the form of a political organiza tio n with periodic summits and declarations on issues concerning the global economy and foreign policy. The group cannot be termed an economic or trade bloc. Since 2009, the BRICS nations have met annually at formal summits. Russia hosted the group’s seventh summit in July 2015.
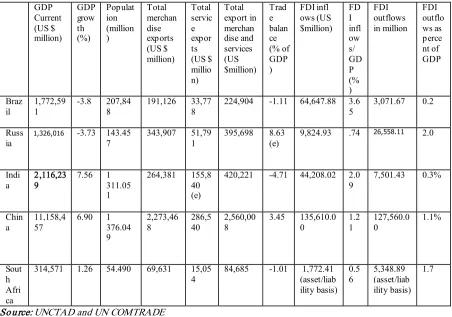
Table 1: Economic and Other Important Indicators For The BRICS Nations, 2010 GDP Current (US $ million) GDP grow th (%) Populat ion (million ) Total merchan dise exports (US $ million) Total servic e expor ts (US $ millio n) Total export in merchan dise and services (US $million) Trad e balan ce (% of GDP ) FDI infl ows (US $million) FD I infl ow s/ GD P (% ) FDI outflows in million FDI outflo ws as perce nt of GDP Braz il 1,772,59 1
-3.8 207,84 8
191,126 33,77 8
224,904 -1.11 64,647.88 3.6 5
3,071.67 0.2
Russ ia
1,326,016 1,326,016 -3.73 143.45 7
343,907 51,79 1
395,698 8.63 (e)
9,824.93 .74 26,558.11 2.0
Indi a
2,116,23 9
7.56 1 311.05 1
264,381 155,8 40 (e)
420,221 -4.71 44,208.02 2.0 9
7,501.43 0.3%
Chin a
11,158,4 57
6.90 1 376.04 9 2,273,46 8 286,5 40 2,560,00 8
3.45 135,610.0 0 1.2 1 127,560.0 0 1.1% Sout h Afri ca
314,571 1.26 54.490 69,631 15,05 4
84,685 -1.01 1,772.41 (asset/liab ility basis) 0.5 6 5,348.89 (asset/liab ility basis) 1.7
Source: UNCTAD and UN COMTRADE
Note: Value of India’s total service exports is based on estimation of UNCTAD. FDI inflows and outflows of South Africa are based on asset/liability basis.
Table 1 exhibits the main economic indicators for the BRICS economies for the year 2015. It indicates the scale of their
Available online: https://edupediapublications.org/journals/index.php/IJR/ P a g e | 1887 respects. India recorded the highest GDP
growth rate in the group, while Brazil and Russia experienced negative GDP growth rate in year 2015. On Population front, China and India have large population base in BRICS group while South Africa has the lowest population base. Russia had the highest Trade balance (as a percentage of GDP) in year 2015. When FDI Inflows were compared with their respective GDP, it was found that Brazil’s FDI Inflows were 3.65% of its GDP which was highest recorded percentage of GDP within the group and South Africa FDI inflows contributes only 0.56% of GDP in 2015 which constitutes the lowest percentage of FDI inflows to the GDP of country. In case of FDI Outflows, Russia outflows were 2% percent of its GDP which is the highest in the group, while the FDI outflows of Brazil were lowest i.e., only 0.2% of its GDP.
Economists Dominic Wilson and Roopa Purushothaman predicted that BRICS would become the world’s principal “engine of new demand growth and spending power,” which could “offset the impact of greying populations and slower growth in the advanced economies”.
Literature Review
1. Orgaz, L., Molina, L., & Carrasco, C. (2011) examined the relevance of
emerging and developing
economies for the global economy, paying special attention to the BRIC (Brazil, Russia, India and China). The paper also reviewed the participation of these countries in some key multilateral institutio ns for global governance, and compared it to its actual economic weight. The authors elaborated the role of BRIC nations in issues like
international reserves
accumulation, international trade and climate change negotiations in which their collective interests are vested.
Available online: https://edupediapublications.org/journals/index.php/IJR/ P a g e | 1888 of global economic activities. The
paper identified and recommended key economic roadblocks that BRIC countries should overcome so as to sustain their economic growth over future.
3. Pant, M. (2013) examined the nature and sustainability of the increase in BRICS trade. The study also focused upon the complementarity and substitutability in the commodity trade of the members of BRICS and on the possible methods of technica l
collaboration between BRICS
countries in case of FDI. The author collected the required data from UNCOMTRADE data base using the
SITC, Rev.3 definitions of
commodities for the study period 1995-2007. The results showed that the trade had become increasingly asymmetric for almost half of the set of bilateral pairs of BRICS countries. The study also suggested that asymmetry has apparently declined in 2007 relative to 1995. The study used measures of Revealed Comparative Advantage (RCA) to address the issues of complementarity and substitutability among products exported by the BRICS countries. There were very few set of
commodity groups where intra-BRICS trade was important or had become increasingly important between 2000 and 2007. In fact, those few commodities largely belong to the set of resource based commoditie s like iron ores and pellets (Brazil, India and South Africa), manganese ores (South Africa), cotton (India), non-coniferous wood (Russia), and soya and soya oil (Brazil). To address the issues of technology and cooperation in case of FDI, data were taken from the World Investme nt Reports of the UNCTAD and other studies on these issues. The analysis indicated that with the exception of China and Brazil, the pattern of FDI from BRICS countries was not conducive to promote intra-BRICS trade but promoted regional trade. For India, FDI was oriented towards the developed countries.
Available online: https://edupediapublications.org/journals/index.php/IJR/ P a g e | 1889 complementarity in export and
import of products with low levels of competition, which could provide opportunities for enhanced intra-BRICS trade. The study indicated that greater openness between the BRICS countries would yield gains for all five of the member countries. The authors suggested that India which enjoyed a comparative advantage in certain products, should re-oriented its Focused Market and Focused Product initiatives in light of its “new trade policy”, which aimed to achieve greater and closer trade with its fellow BRICS members.
Objective of the study
Through this study the merchandise trade pattern within the BRICS member countries are analysed. An attempt is made to compare the intra-BRICS merchandise trade with the total trade of BRICS countries with the rest of the world.
Research Methodology
To achieve the research objective, secondary data related to important economic indicators and merchandise trade of BRICS member countries were collected from UN COMTRADE, UNCTAD and World Bank databases for the year 2005, 2010 and 2015. Percentage method was used for the analysis of the data.
Analysis
Table: 2 Merchandise Trade of BRICS Nations, 2014
Export Import
Countries Rank Share Countries Rank Share
China 1 12.3% China 2 10.3%
Russia 11 2.6% India 12 2.4%
India 19 1.7% Russia 17 1.6%
Brazil 25 1.2% Brazil 22 1.3%
South Africa 40 0.5% South Africa 33 0.6%
Available online: https://edupediapublications.org/journals/index.php/IJR/ P a g e | 1890 The above table shows the share of BRICS
nations in world merchandise trade for the financial year 2014. Global export and import of merchandise amounted to 19002 billion dollars and 19091 billion dollars for
the year 2014. From the above table it was found that BRICS economies share in total merchandise exports and imports of world was 18.3% and 16.2% respectively.
Table: 3 Merchandise exports of BRICS nations to other member counties of BRICS in percentage of total exports to other member countries of BRICS)
Exporting
Country Year Total Merchandise Exports to other
member countries of BRICS( in $)
Merchandise Exports to Partner Country (in percentage of total exports to other member
countries of BRICS)
Brazil Russia India China Africa South
Brazil 2005 14,04,10,01,366 - 20.78 20.7
8 48.68 9.77 2010 39,74,02,71,949 - 10.45 8.79 77.47 3.30 2015 43,04,31,74,512 - 5.73 8.40 82.73 3.15
Russia
2005 15,99,26,24,293 3.79 - 14.47 81.59 0.16
2010 26,95,80,55,505 6.39 - 20.05 73.38 0.17
2015 35,08,21,28,458 5.48 - 12.97 80.77 0.78
India
2005 10,26,33,89,904 9.45 6.88 - 69.99 13.68 2010 26,15,28,31,072 14.03 5.33 - 66.68 13.96 2015 18,10,19,84,789 17.12 8.90 - 52.90 21.07
China
2005 30,79,87,34,852 15.67 42.90 29.01 - 12.42
2010 1,05,78,65,45,907 23.12 27.99 38.68 - 10.21
2015 1,36,25,50,51,714 20.12 25.51 42.73 - 11.64
South Africa
2005 2,92,69,51,241 10.86 2.40 39.98 46.76 -
2010 12,11,60,60,029 5.86 2.29 25.03 66.81 -
2015 9,69,70,70,961 5.10 2.60 32.45 59.84 -
Available online: https://edupediapublications.org/journals/index.php/IJR/ P a g e | 1891 The above table shows the percentage share
of merchandise exports of member counties of BRICS to other BRICS countries. Major share of exports of BRIS (Brazil, Russia, India and South Africa) goes to China that
clearly shows the dominance of China in Intra-BRICS exports. But in case of China’s exports, major exporting destination of its goods was Russia.
Table: 4Percentage Shares of Intra-BRICS Exports to Total Country Exports, 2005 -2015
Exporting
Country Year Total Exports to World (in $)
Exports to Partner Country (in % age of total exports to World)
Brazil
Russia India China South Africa
Brazil
200
5 1,18,52,86,88,118 - 2.46 2.46 5.77 1.16 201
0 2,01,91,51,03,285 - 2.06 1.73 15.25 0.65 201
5 1,91,12,68,85,834 - 1.29 1.89 18.63 0.71
Russia
200
5 2,41,45,16,56,882 0.25 - 0.96 5.40 0.01 201
0 3,97,06,75,20,996 0.43 - 1.36 4.98 0.01 201
5 3,43,90,76,51,828 0.56 - 1.32 8.24 0.08
India
200
5 1,00,35,26,36,503 0.97 0.70 - 7.16 1.40 201
0 2,20,40,84,95,991 1.66 0.63 - 7.91 1.66 201
5
2,64,38,10,03,631 1.17
0.61 -
3.62
1.44
China
200
5 761,953,409,531 0.63 1.73 1.17 - 0.50 201
0 15,77,763,750,888 1.55 1.88 2.59 - 0.68 201
5 22,73,468,224,113
1.21
1.53
2.56 -
0.70
South Africa 200
5 46,99,10,46,533 0.68 0.15 2.49 2.91 - 201
0 82,62,55,56,546 0.86 0.34 3.67 9.80 - 201
5 69,63,10,82,608 0.71 0.36 4.52 8.33 -
Available online: https://edupediapublications.org/journals/index.php/IJR/ P a g e | 1892 The above table shows the exports of
member countries of BRICS to other BRICS countries as a percentage of their respective total exports to the world. 5.77 percent of total Merchandise exports of Brazil exported to China in year 2005 which significantly increased to 18.63% in year 2015. In case of Russia’s merchandise exports, 5.40% of total exports of country went to China in 2005 which increased to 8.24% in year 2015. India’s merchandise exports to other BRICS nations increased in 2010 in comparison to year 2005, but reversed trend was experienced in year 2015. In year 2005, India’s merchandise exports to China were 7.16 percent of its total merchandise exports but in year 2015, it was only 3.62% of total merchandise
exports of India. The table also shows that only a small percentage of China’s total merchandise exports went to Brazil, Russia, India and South Africa. But merchandise exports of China to other BRICS nations in year 2015 increased in comparison to year 2005. Merchandise exports of South Africa to other BRICS nations witnessed a progressive trend between 2005, 2015 and 2015, except in case of South Africa’s exports to Brazil and China in Year 2015. In context of Intra- BRICS exports, China and India were the major destinations of South Africa’s merchandise trade. In year 2005, South Africa exported 2.91% of its total merchandise exports to china and it increased to 8.33% in year 2015.
Table: 5 Merchandise Imports of BRICS nations to other member counties of BRICS in percentage of total imports from other member countries of BRICS)
Importing
Country Year members of BRICS (In $ ) Total Imports from other
Partner Country
Brazil Russia India China Africa South
Brazil
2005 7,62,11,11,867.00 - 9.48 15.78 70.26 4.48
2010 32,50,16,65,039.00 - 5.88 13.05 78.75 2.32
2015 37,87,44,65,450.00 - 5.86 11.33 81.11 1.70
Russia
2005 10,54,14,78,273.00 22.25 - 7.44 68.91 1.39 2010 45,64,48,50,776.00 8.91 - 4.70 85.36 1.037 2015 40,97,57,43,008.00 7.15 - 5.52 85.90 1.43
Available online: https://edupediapublications.org/journals/index.php/IJR/ P a g e | 1893
2010 99,75,61,76,677 38.19 25.98 20.90 - 14.93 2015 1,20,86,79,84,835 36.48 27.52 11.06 - 24.95
South Africa
2005 7,45,65,93,233.00 17.57 1.323 14.79 66.33 - 2010 15,79,54,62,028.00 8.67 0.667 17.99 72.68 - 2015 20,20,02,79,586.00 6.34 1.860 19.51 72.29 -
Source: UN COMTRADE and Researchers’ Calculation
The above table shows the trend of Intra-BRICS imports of merchandise. It shows the percentage share of imports of member counties of BRICS from other BRICS countries. Major share of intra-BRICS imports of BRIS (Brazil, Russia, India and
South Africa) comes from China that clearly shows the dominance of China in Intra-BRICS imports. But in case of China, it imports more from Russia than Brazil, Russia, India and South Africa.
Table: 6 Percentage Shares of Intra-BRICS Imports to Total Country Imports, 2005 -2015
Importing
Country Year Total Imports from World (in $) Imports from Partner Country (in % age of total imports from World) Brazil Russia India China Africa South Brazil 2005 73,60,03,75,464.00 -
0.98 1.63 7.28 0.46 2010 1,81,76,84,24,090.00 - 1.05 2.33 14.08 0.42
2015 1,71,44,62,11,662.00 - 1.30 2.50 17.92 0.38 Russia 2005 98,70,72,55,772.00 2.38 - 0.79 7.36 0.15
2010 2,28,91,16,58,149.00 1.78 - 0.94 17.02 0.21 2015
1,82,78,19,64,814.00 1.60 - 1.24 19.26 0.32 Importing
Country Year Total Imports from World (in $) Imports from Partner Country (in % age of total imports from World) Brazil Russia India China Africa South India 2005 1,40,86,16,66,918 0.63 1.45 - 7.22 1.91
2010 3,50,02,93,86,927 0.92 1.03 - 11.78 1.97 2015 3,90,74,47,31,405 1.05 1.16 - 15.77 1.61 China 2005 6,59,95,27,62,119 1.51 2.41 1.48 - 0.52 2010 13,96,00,15,65,258 2.73 1.86 1.49 - 1.07 2015 16,79,56,43,24,560 2.63 1.98 0.80 - 1.80 South
Africa 2005 55,03,26,38,723.00 2.38 0.179 2.00 8.99 - 2010 82,94,87,18,452.00 1.65 0.127 3.43 13.84 - 2015 79,59,09,45,314.00 1.61 0.472 4.95 18.35 -
Available online: https://edupediapublications.org/journals/index.php/IJR/ P a g e | 1894 The above table shows the merchandise
imports of member countries of BRICS from other BRICS countries as a percentage of their respective total imports from the world. 7.28 percent of total Merchandise imports of Brazil came from China in year 2005 which significantly increased to 17.92% in year 2015. In case of Russia’s merchandise imports, 7.36% of total imports of country came from China in 2005 which increased to 19.26% in year 2015. In year 2005, India’s merchandise imports from China were 7.22 percent of its total merchandise imports but in year 2015, it increased to 15.77% of total merchandise imports of India. The table also shows that only a small percentage of China’s total merchandise imports came from Brazil, Russia, India and South Africa. But merchandise imports of China from South Africa increased and imports from Russia and India decreased between year 2005 and 2015. Merchandise imports of South Africa from other BRICS nations witnessed a progressive trend between 2005 and 2015, except in case of South Africa’s imports from Brazil. In context of Intra- BRICS imports, China was the major source of South Africa’s merchandise imports. In year 2005, South Africa imported 8.99% of its total merchandise imports from china and it increased to 18.35% in year 2015.
Conclusion:
The BRICS members are all developing or newly industrialised countries, but they are distinguished by their large, fast-growing economies and significant influence on regional and global affairs; all five are G-20 members. The purpose of the paper is to study the merchandise trade pattern within the BRICS member countries. It was found that major share of exports of BRIS (Brazil, Russia, India and South Africa) goes to China that clearly shows the dominance of
China in Intra-BRICS exports.
Merchandise exports of South Africa to
other BRICS nations witnessed a
Available online: https://edupediapublications.org/journals/index.php/IJR/ P a g e | 1895 Russia, India and South Africa. The study
depicts that merchandise trade between BRICS nations considerably experienced progressive trends but some exceptions were also witnessed during the period under study. . The possibilities for greater economic engagement between BRICS nations are many and member countries should make favourable trade policies and agreements to harness these possibilities especially in case of merchandise trade.
References:
1. Goldman Sachs. 2005. How Solid are the BRICS? Global Economics Paper No. 134. December 2005.
2. Goldman Sachs. 2007. The N-11: More Than an Acronym. Global Economics Paper No. 153. March 28, 2007
Available at:
http://www.chicagobooth.edu/alum ni/clubs/pakistan/docs/next11drea m-march%20ʼ
07-goldmansachs.pdf//(accessed on July 18, 2016).
3. Orgaz, L., Molina, L., & Carrasco, C. (2011). The Growing Weight of the Emerging Economies in the
World Economy and Governance: The Case of the BRICs.
4. Atale, N. (2012). A Decade of BRICS: Prospects and Challenges for Next Decade. Indian Journal of
Management, Forthcoming.
Available at
SSRN:https://ssrn.com/abstract=22 08920
5. Pant, M. (2013). India and the BRIC’s countries: Issues of Trade and Technology. BRICS Trade Policies, Institutions and Areas of deepening Cooperation. Centre for WTO Studies. Pg, 163-191.
6. Chatterjee, B., Jena, P. C., & Singh, S. (2014). Intra-BRICS Trade & Its Implications for India.
7. International Trade Centre;
Investment Map,
http://www.investmentmap.org/
(accessed on February 6, 2016).
WEBSITES AND DATABASES
8. UNCTAD database: Foreign direct investment report (Accessed: July
25, 2016)
http://unctadstat.unctad.org/
Available online: https://edupediapublications.org/journals/index.php/IJR/ P a g e | 1896 report (Accessed: 15 March, 2016)
http://unctadstat.unctad.org/
10.UNCTAD database: Internatio na l trade in services report (Accessed:
12 June, 2016)
http://unctadstat.unctad.org/
11. UNCTAD database: Population and labour force report (Accessed: 3
February, 2016)
http://unctadstat.unctad.org/
12. https://www.cia.gov/
13.UN statistics. (Accessed: 20 March, 2016) http://unstats.un.org/
14. World Bank database (Accessed: 5
June, 2016).
Available online: https://edupediapublications.org/journals/index.php/IJR/ P a g e | 1897 APPENDICES:
Appendix: 1
Exports to Partner Country (in$) Exportin
g Countr-y
Year Brazil Russia India China South Africa Total BRICS World
Brazil 2005 0
2,91,74,34,6 47 2,91,74,34,64 7 6,83,49,96,98 0 1,37,11,35,0
92 14,04,10,01,366
1,18,52,86,88,11 8
2010 0
4,15,20,40,8 77 3,49,23,50,60 4 30,78,59,06,4 42 1,30,99,74,0 26 39,74,02,71,949 2,01,91,51,03,28 5
2015 0
2,46,44,30,3 26 3,61,74,49,35 4 35,60,75,23,6 12 1,35,37,71,2 20 43,04,31,74,512 1,91,12,68,85,83 4
Russia 2005 60,56,33,97 8 0 2,31,40,04,30 6 13,04,77,44,8 51 2,52,41,158 15,99,26,24,293 2,41,45,16,56,88 2 2010 1,72,29,40,9 72 0 5,40,62,99,07 9 19,78,30,43,4 93 4,57,71,961 26,95,80,55,505 3,97,06,75,20,99 6 2015 1,92,29,22,6 79 0 4,54,99,40,90 2 28,33,49,54,5 70 27,43,10,30 7 35,08,21,28,458 3,43,90,76,51,82 8
India 2005 96,98,11,75 4 70,56,85,22 4 0 7,18,37,92,30 8 1,40,41,00,6 18 10,26,33,89,904 1,00,35,26,36,50 3 2010 3,66,95,58,1 11 1,39,32,23,3 49 0 17,43,99,91,2 78 3,65,00,58,3 34 26,15,28,31,072 2,20,40,84,95,99 1 2015 3,09,91,48,0 15 1,61,18,93,2 66 0 9,57,65,78,79 8 3,81,43,64,7 10 18,10,19,84,789 2,64,38,10,03,63 1
China 2005
4,82,72,09,3 96 13,21,12,83, 269 8,93,42,77,10 8 0 3,82,59,65,0 79
30,79,87,34,852 761,953,409,531
2010 24,46,06,51, 866 29,61,20,73, 703 40,91,39,58,2 97 0 10,79,98,62, 041 1,05,78,65,45,90 7 15,77,763,750,88 8 2015 27,41,22,25, 426 34,75,68,77, 250 58,22,80,27,0 86 0 15,85,79,21, 952 1,36,25,50,51,71 4 22,73,468,224,11 3 South
Africa 2005 31,77,26,53 1 7,01,65,287 1,17,03,35,20 3 1,36,87,24,22 0 0
2,92,69,51,241 46,99,10,46,533
2010 $71,02,09,1 56 27,80,61,25 7 3,03,24,60,79 6 8,09,53,28,82 0 0
12,11,60,60,029 82,62,55,56,546
2015 49,48,80,29 8 25,25,74,34 0 3,14,67,68,78 3 5,80,28,47,54 0 0 9,69,70,70,961 69,63,10,82,60 8
Available online: https://edupediapublications.org/journals/index.php/IJR/ P a g e | 1898 Appendix: 2
Imports from Partner Country (in $) Import
ing Countr y
Year Brazil Russia India China South Africa BRICS World
Brazil 2005
0 72,21,31,034. 00 1,20,29,14,20 0.00 5,35,45,19,15 8.00 34,15,47,475. 00 7,62,11,11,86
7.00 73,60,03,75,464.00 2010 0 1,91,03,46,83 2.00 4,24,24,65,82 2.00 25,59,54,19,0 05.00 75,34,33,380. 00 32,50,16,65,0
39.00 1,81,76,84,24,090.00
2015 0
2,22,08,90,48 2.00 4,28,95,80,02 5.00 30,71,94,05,0 22.00 64,45,89,921. 00 37,87,44,65,4
50.00 1,71,44,62,11,662.00 Russia 2005
2,34,57,35, 089.00 0 78,43,94,105. 00 7,26,45,82,91 2.00 14,67,66,167. 00 10,54,14,78,2
73.00 98,70,72,55,772.00 2010 4,06,72,39, 395.00 0 2,14,33,34,81 3.00 38,96,09,30,0 34.00 47,33,46,534. 00 45,64,48,50,7
76.00 2,28,91,16,58,149.00
2015 2,92,82,93, 772.00 0 2,26,30,52,81 5.00 35,19,92,63,9 48.00 58,51,32,473. 00 40,97,57,43,0
08.00 1,82,78,19,64,814.00
India 2005 88,31,62,5 65.00 2,03,69,52,42 6.00 0 10,16,70,61,1 41.00 2,68,34,75,72 5.00 15,77,06,51,8
57.00 1,40,86,16,66,918
2010 3,22,09,88, 263.00 3,59,15,53,18 8.00 0 41,24,91,15,7 86.00 6,91,21,86,41 4.00 54,97,38,43,6
51.00 3,50,02,93,86,927
2015 4,10,77,96, 561.00 4,52,70,90,53 8.00 0 61,60,44,26,7 47.00 6,27,58,39,16 8.00 76,51,51,53,0
14.00 3,90,74,47,31,405
China 2005 9,99,25,24, 117.00 15,88,99,42,9 26.00 9,76,62,16,26 9.00 0 3,44,30,51,90 8.00 39,09,17,35,2
20 6,59,95,27,62,119 2010 38,09,94,4 7,351.00 25,91,39,93,6 44.00 20,84,63,13,4 21.00 0 14,89,64,22,2 61.00 99,75,61,76,6
77 13,96,00,15,65,258 2015 44,08,93,5 8,062.00 33,25,86,62,8 57.00 13,36,85,53,4 64.00 0 30,15,14,10,4 52.00 1,20,86,79,84
,835 16,79,56,43,24,560
South Africa 2005 1,30,98,05, 709.00 9,86,28,289.0 0 1,10,25,47,76 1.00 4,94,56,11,47 4.00 0 7,45,65,93,23
3.00 55,03,26,38,723.00
2010 1,36,88,30, 033.00 10,53,73,796. 00 2,84,11,06,81 5.00 11,48,01,51,3 84.00 0 15,79,54,62,0
28.00 82,94,87,18,452.00
2015 1,28,08,64, 380.00 37,57,56,490. 00 3,94,04,60,67 0.00 14,60,31,98,0 46.00 0 20,20,02,79,5
86.00 79,59,09,45,314.00