Efficient method of Power safe test pattern refinement
for transition fault coverage for at Speed Scan based
Testing
Gundapu SrivalliM.Tech Student Scholar
Department of Electronics & Communication Engineering, St.Mary’s Women’s Engineering College, Budampadu, Guntur
district, A.P, India. [email protected]
N.Ramesh Babu,
Asst.professor,
Department of Electronics & Communication Engineering, St.Mary’s Women’s Engineering College, Budampadu, Guntur
district, A.P, India. [email protected]
Abstract: - Nowadays, at-speed scan based testing is used for testing the performance of the given circuit. In the case of At-speed scan based test, excessive capture power due to power risky pattern may cause significant current demand, resulting in the IR-drop problem .In proposed method, all power risky patterns are discarded and considering power safe patterns and refining them.WSA switching activity is used to estimate whether the given pattern is power risky or power safe pattern.LOC clocking scheme, which is widely used to detect transition faults in scan-based designs and the capture power problem.. Our test generation procedure includes two processes, namely, test pattern refinement and low-power test pattern regeneration. The first process is used to refine the power-safe patterns to detect faults originally detected only by power-risky patterns. If some faults are still undetected after this process, the second process is applied to generate new power-safe patterns to detect these faults. The patterns obtained using the proposed procedure are guaranteed to be power-safe for the given power constraints. Experimental results on ISCAS’89 andITC’99 benchmark circuits show that an average of 75% of faults originally detected only by risky patterns can be detected by refining power-safe patterns and the remaining undetected faults can be detected by the low-power test generation process.
Index terms – at speed scan based testing, WSA, LOC clocking scheme, Transition fault, automatic test pattern generation (ATPG), fan-out.
1. INTRODUCTION:
Scan-based ATPG solutions for at-speed testing ensure high test coverage, simple structure, strong diagnostic support and reasonable development effort. This article explores applying at-speed scan testing. We introduce new strategies to optimize ATPG to apply specific clock sequences that are valid with the circuit operation. We also use these strategies to have ATPG generate tests that use internal clocking logic.
The test power required to load or unload test data with shift clock control is called shift power, and the power required to capture test responses with an at-speed clock rate is called capture power. Excessive shift power can lead to high temperatures that can damage the circuit under test (CUT) and may reduce the circuit’s reliability. Excessive capture power induced by test patterns may lead to large current demand and induce a supply voltage drop, known as the IR-drop problem. This would cause a normal circuit to slow down and eventually fail the test, thereby inducing unnecessary yield loss.
To estimate shift power and capture power, several metrics have been proposed. Among these metrics, the one employing the circuit level simulation may be the most accurate one . However, this method is time consuming and memory intensive. The toggle count metric considers the state changes of nodes (FFs or gates) and the weighted switching activity (WSA) metric considers both node state changes and fanouts of nodes. Metrics that consider paths are also proposed. The critical capture transition (CCT) metric assesses launch switching activities around critical paths and the critical area targeted (CAT) metric estimates launch switching activities caused by test patterns around the longest sensitized path . In this paper, we will employ the WSA metric as it is highly correlated to the real capture power and has been used in most related work to determine power-safe test patterns.
test power. However, they may increase circuit area and degrade circuit performance, and may be incompatible with existing design flows. The software-based methods attempt to generate power safe test patterns that will not consume excess power during testing by modifying the traditional automatic test pattern generation (ATPG) procedure or by modifying predetermined test sets. These methods are generally based on the X-filling technique to assign fixed logic values to don’t care bits (X-bits) in test patterns to minimize test power dissipation.
Low-capture power (LCP) X-filling method is proposed and incorporated into the dynamic compaction process of the test generation flow to reduce the capture power. Although these methods can achieve a large reduction in capture power, they often increase the test data volume in comparison with that produced by conventional at-speed scan test methods due to the fact that during the dynamic compaction process, many X-bits that can be assigned to detect more faults are reserved to reduce capture power. Instead of modifying the ATPG procedure, some post-ATPG methods modify a given test set by using X-filling to reduce as much test power as possible or to satisfy the power constraints. A propose method, named adjacency fill, which assigns deterministic values to the X-bits in line with the adjacent bit values to reduce shift power.
For example, given the test pattern (1, X, X, 1, 0), the X-bits in this pattern are filled as (1, 1, 1, 1, 0). Proposes preferred fill to reduce the capture power. This method fills X-bits according to the signal probability of pseudo primary outputs (PPOs). In this approach, the X-bits in primary inputs (PIs) and pseudo primary inputs (PPIs) are first randomly filled with the one probability of 0.5. The output signal probability of each gate is then calculated and propagated to the PPOs.
2. RELATED WORK:
Unlike previous methods that reduce the capture power by modifying power-risky patterns, this paper proposes modifying only power-safe patterns to address this issue. It can be seen that the patterns that can detect more faults normally have larger switching activity and lower X-bit ratios, and the number of detected faults decreases drastically with increasing X-bit ratio.
Hence, filling X-bits in power-risky patterns may not be efficient as they tend to have lower X-bit ratios. In contrast, power-safe patterns usually have higher X-bit ratios and many
unused X-bits. Therefore, using the X-bits in power safe patterns to detect faults within the power constraints may be more efficient than using those in power-risky patterns. Based on the above observation, this paper proposes a novel test pattern determination procedure to determine a power safe test set with the LOC clocking scheme.
The proposed procedure contains two processes, namely, test pattern refinement and low-power test pattern regeneration. Given a pre-generated compacted partially-specified test set without any power constraints, the power-risky patterns are all dropped. This will make faults that were detected only by the power risky patterns become undetected. The test pattern refinement process then tries to properly fill the X-bits in the power safe patterns such that the power-risky faults can be detected with the power constraint still being satisfied. If some power risky faults remain undetected after this process, the low-power test pattern regeneration process is employed to generate more power-safe test patterns for these faults.
3. PRELIMINARIES:
This section first describes the LOC clocking scheme, which is widely used to detect transition faults in scan-based designs and the capture power problem. Then, it introduces the power metrics employed to verify the effectiveness of the proposed procedure.
3.1. LOC clocking scheme:
The architecture of the scan-based design and the LOC clocking scheme are shown in Fig.1 .At-speed scan testing with LOC scheme. Depending on the scan enable signal, the circuit operates in either shift mode or capture mode during testing.
In shift mode, where SE is one, the test pattern is shifted into scan cells by a series of low-speed test clock pulses to initialize the circuit state. Once the pattern is shifted in, the circuit operates in capture mode, where SE is 0. One clock pulse is then applied to the circuit to create the transition for the target faults, and another clock pulse is then used to capture the test response from the combinational logic of the circuit using the at-speed functional clock.
with SE asserted, and the next test pattern is shifted into the scan cells at the same time.
Fig.1: At-speed Scan testing with LOC scheme
During the LOC tests, the test pattern may cause excessive switching activity at the launch cycle, leading to large current demand and increased IR-drop. Increased IR-drop may increase the gate delay and lead to an incorrect test response being captured at the capture cycle. An incorrect response will cause the circuit to be identified as defective, which results in test-induced yield loss and increased cost. Therefore, to prevent such test-induced yield loss, it is important to ensure capture power safety during the launch cycle.
3.2 Calculation of capture power for the given circuit:
As mentioned before, in this paper the WSA metric is used to calculate the circuit’s switching activity. The WSA of a gate is the number of capture transitions (ti) at the gate multiplied by (gate’s fanout + 1). If a transition (0 to 1 or 1 to 0) occurs at gate i, ti is set to 1; otherwise ti is set to 0.
If the gate is connected directly to a primary output, then its fanout is set to 0. The WSA of whole circuit for one test pattern is the sum of the WSA for each gate in the circuit, shown as follows:
WSA =
This WSA is called the maximum WSA, since all of the gates in the circuit transit in the launch.
when calculating the capture power of partially specified test patterns, it is necessary to estimate the number of transitions caused by the X-bits at the internal gates.
A simple method is to assign a weight to the transition (ti) of each X-bit to calculate the switching activity with the previously mentioned power metrics. However, it is difficult to determine a proper weight for an bit. If the weight of X-bits is too large, then a power-safe pattern may be incorrectly regarded as a power-risky pattern, and vice versa. Another method is to fill the X-bits with 0 or 1 and then to calculate the
capture power of patterns. There has been extensive research on X-filling techniques.
In this paper, the ACF X-filling technique is used to temporarily fill the X-bits and calculate the capture power of partially-specified test patterns. The reason to choose the ACF X-filling technic obtained capture power is lower than most other X-filling techniques, and thus, is a good candidate to calculate the capture power of partially specified patterns before using our proposed technique.
4. POWER-SAFE TEST PATTERN DETERMINATION:
This section first uses a simple example to illustrate the main idea of the proposed procedure. Then, it describes the overall flow and its details.
4.1Main Idea:
The main idea of this paper is to utilize the X-bits in power-safe patterns to detect as many faults that are previously detected only by power-risky patterns as possible. If there are still undetected faults, then a low-power pattern generation process is used to generate patterns to detect the remaining faults. The following is an example to illustrate the main idea.
Considering the circuit in Fig2, three transition faults, f 1, f
2, and f 3, are detected by two pattern pairs P1= <v1,v2 > = < (X, X, 1, 0, 1, 0), (X, X, 1, 1, 0, 0) > andP2= <v3, v4 > = < (0, X, 1, X, X, X), (1, X, 1, X, X, X) > . When pattern P1 is applied to the circuit, the output values of gates N2, N4, N6, and N7 will switch and faults f 2 and f 3 can be detected by P1. When pattern P2 is applied to the circuit, the output values of gate N5 will switch and fault f1 can be detected by P2. The capture powers of P1 and P2 calculated using WSA are 6 (=2+2+1+1) and 1 (because gate N5, N6, and N7 are each connected to an output directly, and their fanouts are set to 0), respectively.
Fig2. Example of two partially-specified pattern pairs in the original ATPG test set to detect the faults f 1 (N5 slow-to-rise), f 2 (N7 slow-to-fall) and f 3 (N2 slow-to-rise). (a) Partially-specified pattern pair P1 detects f 2 and f 3. (b)
Partially-specified pattern pair P2 detects f 1.
If the refined P2 < (0, X, 1, X, 1, 0), (1, X, 1, X, 0, 1) > can detect f 2, as shown in Fig.3, the WSA of the refined P2 becomes 4 (=1+2+1). Now, the refined P2 can detect both f 1 and f 2 without violating the power threshold. It should be noted that the capture power of the refined power-safe pattern also increases because the power-safe pattern detects more faults (the WSA of P2 is 1 in Fig. 3(b), but the WSA of the refined P2 in Fig. 4(a) is 4. Therefore, to ensure that the WSA of the refined pattern does not exceed the power threshold, it must be calculated and checked again. Since f 3 remains undetected, the fault coverage is still less than the original. In order to recover the fault coverage loss, another power-safe pattern, P3= <v5, v6 > = < (X, X, 1, 0, X,X), (X, X, 1, 1, X, X) > , can be generated to detect f 3, as shown in Fig. 4(b). By using the two power-safe pattern pairs, refined P2 (WSA = 4) and P3 (WSA = 3), all three faults can be detected without test data inflation, loss of fault coverage, and capture power issues.
4.2 Overall Flow of Proposed Procedure:
Based on the main idea, a technique is proposed to determine a test set such that the power constraint is satisfied and the test data inflation is minimized. Fig. 5 shows an overview of the proposed capture-power-safe test pattern determination procedure. The inputs to this procedure include a pre-generated partially specified test set T for the LOC test, a list F of transition faults that are detected by T, and a predefined power threshold Pthto determine whether a pattern
is power-risky
.
In order to obtain the power-safe patterns Ts and the power risky fault list Fr , at step , the capture power of each pattern in
T is calculated and compared with Pth. The power-risky fault list Fr is the list of faults that are only detected by power-risky patterns. To get a deterministic capture power of the partially
specified pattern, the X-bits must be temporarily filled with zero or one. In the proposed procedure, the ACF technique is used to fill these X-bits temporarily to calculate capture power. If the pattern’s capture power is less than Pth, the pattern is added into Ts; otherwise, the pattern is dropped. The faults that are only detected by the power-risky patterns are identified by fault simulation using Ts and F. These power risky faults are added into Fr.
Fig:3. Two new pattern pairs detect the faults f 1 (N5 slow-to-rise), f 2 (N7slow-to-fall), and f 3 (N2 slow-to-rise). (a) Refined P2 that detects f 1 and
f 2. (b) New pattern pair P3 that detects f 3.
There may exist some power-safe patterns that can detect power-risky faults in Frbut are not part of the original test set.
Thus it can only be said that these faults are detected only by power-risky patterns in the original test set. The obtained power-safe test set Ts and power-risky fault list Fr will then
Fig.4. Overview of proposed capture-power-safe test pattern determination procedure.
In the test pattern refinement process, values are assigned to X-bits of power-safe patterns in Ts under the Pthlimitation
to detect as many power-risky faults in Fr as possible. After
this step, a fully specified power-safe test set Tms and an
undetected fault list Fu are determined. If the refined power
safe test set (Tms) detects all of the power-risky faults, the
pattern determination procedure is complete. Otherwise, the low-power test pattern generation (step) is conducted to generate new power-safe test patterns to detect these faults.
The newly generated power-safe test patterns are stored in
Tns. The power-risky faults that still cannot be handled by the
proposed procedure are considered as unresolved and are put into an unresolved fault list Fur. With the above processes, a
power-safe test set, including the refined power-safe test set
Tms and newly generated test set Tns, can be determined.
5. ALGORITHM FOR TEST PATTERN REFINEMENT PROCESS:
The goal of the test pattern refinement process is to utilize the X-bits in power-safe patterns to detect as many power risky faults as possible. This process ends when there are no remaining faults in Fr or all the power-safe patterns in Ts have been refined. The pseudo code is shown in Fig. 6.
In each iteration, an unrefined power-safe pattern is selected as sel−pt (line 2). Then, the X-filling is applied to
sel−pt for detecting power-risky faults (line 3). In this step, a commercial ATPG tool is configured to keep the specified bits of sel−pt, and the ATPG tool generates a partially specified test set called candidate test set Tc for power-risky faults. For example, if sel−pt is (1, 0, X, X, 1), the candidate test set Tc
may include P1 = (1, 0, 0, 0, 1) and P2 = (1, 0, X, 0, 1), but not P3 = (0, 0, X, X, 0) because the values of some specified bits of P3 are different from those of sel−pt. The capture power of each test pattern in Tcis then calculated by using the
power metrics of WSA.
After the capture power of each candidate pattern is obtained, the patterns with capture power higher than Pth are removed from Tc (line 5). If Tc is not empty, a fully specified pattern that detects the most faults in Fr is chosen as max−pt, and the faults detected by max−pt are dropped from Fr (line 7–8). The pattern max−pt is then copied to sel−pt, and sel−pt
becomes fully specified and is marked as refined (line 9– 11). The fault list Fr is checked if it has any power-risky faults. If
Fr is empty, the remaining unrefined power-safe patterns in Ts
are replaced with the corresponding prefilled patterns in Step 1 these patterns are added to Tms. Then, the refinement process is terminated. Otherwise, the next pattern will be selected for modification (line 12–14). If some power-risky faults still remain undetected after the while loop, these faults will be put in the undetected fault list Fu (line 17–19), which will be processed by the low-power test pattern generation process, which is discussed in the next section. In summary, after the test pattern refinement process, a refined fully specified power-safe test set Tms is obtained.
5.1 Algorithm for Test pattern refinement:
Input: a partially specified power safetest set Ts,apower risky fault list Fu and a user defined power thershold Pth.
Output: a refined fully specified power safe test set Tms and undetected fault list Fu.
1.While an unrefined pattern exists in Ts then
2.Sel pt select an unrefined pattern from Ts
3.Perfrom ATPG constrained by yhe partially specified pattern sel-pt to detect faults in fr and generate a partially specified candidate test set Tc
4.Perform low-power x-filling on Tc .Each pattern in Tc becomes fully specified,and its capture power is calculated
5.Remove the pattern that have capture power > Pth from Tc 6.if Tc is not empty then
7.max-pt select a fully specified pattern from Tc that can detect the largest no. of faults in Fr
8.drop the faults detected by max-pt from Fr 9.Copy max-pt to sei-pt
10.end if
11.mark the pattern sel-pt as refined and add it to Tms 12.if Fr is empty then
13.replace the remaining undefined pattern in Ts with the corresponding prefilled patterns from step 1 and these patterns to Tms
14.break the while loop 15.end if
16.endwhile
17.if Fr is not empty then
18.put the remaining power risky faults in Fu 19.end
Algorithm for Low Power Test Generation Process:
achieve this goal, this process uses a dynamic data compression.
In this process, a commercial ATPG tool is first used to generate a compact partially specified test set Ttmpfor Fu (line
2). After the capture power of each pattern in Ttmp is
calculated, the patterns with capture power greater than Pth are
removed from Ttmp (line 3–4). Similar to the refinement
process, the pattern which detects most faults is selected as
max−pt if Ttmpis not empty (line 5–6). Then max−pt is refined
by the test pattern refinement process in an attempt to increase its detected faults (line 7). These detected faults are dropped from Fu and max−pt is added to the test set Tns(line 8–9).Note
that at this moment the generated power-safe patterns may be unable to detect all faults in Fu(line 10) because the generated
patterns may only have a small number of X-bits due to dynamic data compression in ATPG. Therefore, the following steps consider only a small fraction of undetected faults for pattern generation based on the observation that the patterns generated for a smaller number of faults tend to have a larger number of X-bits and hence a higher chance to be power-safe. In the experiment, 10% of undetected faults are randomly selected from Fu as Ftmp (line 11–12). The ATPG tool then
generates a partially specified test set Ttmp and the capture
power of each patterns in Ttmpis calculated. The patterns with
capture power higher than Pth are removed.
If ATPG cannot generate any power-safe pattern for the current Ftmp, the faults in Ftmpwill be added to an unresolved
fault list Fur and removed from Fu (line 16–18); otherwise, this process goes to line 6 to process the power-safe patterns generated for Ftmp (line 15). This procedure is repeated until
there are no faults in Fu. Then, a newly generated power-safe
test set Tnsand unresolved faults Furare obtained.
5.2 Algorithm for Low-Power Test Pattern Generation Input:an undetected fault list Fu and a user defined power threshold Pth Output:a newly generated power safe test set Tns and an
unresolved fault list Fu
1.While Fu is not empty then
2.Generate apartially specified test set Ttmp for Fu 3.Caluclate the capture power of each pattern in Ttmp
4.Remove the patterns that have capture power greater than Pth from Ttmp
5.If Ttmp is not empty then
6.Max pt select the pattern with largest fault detection
7.Perform test pattern refinement process with max pt to detect faults 8.Remove all faults detected by max pt from Fu
9.Add max pt to Tns 10.Else then
11.Generate Ftmp by randomly selecting asub set of Fu 12.Generate a partially specified test set Ttmp for Ftmp 13.Caluclate the capture power of each pazttern in T tmp
14.Remove the patterns that have capture powers gerater thanPth from Ttmp
15.If Ttmp is not empty then goto line6 16.Else then
17.Add the faults in Ftmp to Fur 18.Remove the faults in Ftmp from fu 19.end//else
20.end//else 21.endwhile
6.EXPERIMENTAL RESULTS:
The proposed procedure was implemented in the C language and a commercial ATPG tool was used in the procedure to generate test patterns. In order to quickly calculate the WSAs of patterns, an event-driven power calculator was implemented. The experiments were conducted on ISCAS’89 and ITC’99 benchmark circuits using a 2.5-GHz Intel Xeon CPU with 16 GB of memory on a Linux platform. These circuits were synthesized using a commercial DFT compiler. The statistics of these circuits are listed in Table I, where the columns |sc| and |F| list the number of scan cells and uncollapsed testable transition faults, respectively. The columns |Tatpg| and X-bits% show the number of partially specified test patterns and the average percentage of X-bits in the initial test set Tatpg, respectively. The column max WSA
lists the circuit’s theoretical maximum WSA, which is obtained by assuming that all gates in the circuit are switched simultaneously. The fault list F and the initial test set Tatpg
were generated by a commercial ATPG tool.
6.1. Test pattern refinement:
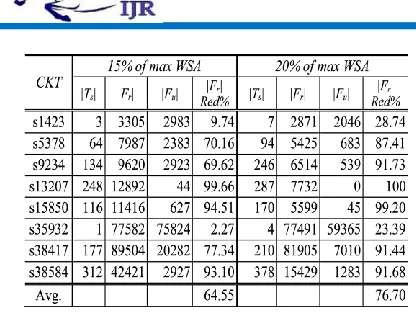
The effectiveness of the test pattern refinement process was investigated for power thresholds of 15% and 20% of max WSA. The results for reducing the number of powerrisky faults by the test pattern refinement process are listed in Tables I and II. The columns |Ts| and |Fr| provide the initial number of power-safe patterns and the number of power-risky faults which are only detected by the power-risky patterns. The number of remaining power-risky faults after the process is shown in column |Fu|. The reduction ratio of the number of power-risky faults in column |Fr| Red (%) is calculated by (|Fr| – |Fu|) / |Fr|*100.
TABLE I
From Table I, it can be seen that the number of powerrisky faults was reduced by 64.55% and 76.7% on average with the test pattern refinement process for power thresholds of 15% and 20% of max WSA, respectively. This means that refining the power-safe patterns can significantly increase the detection of power-risky faults given the power constraints. In Table I, the power-risky fault reduction ratios of many circuits are even higher than 90%. In particular, the reduction ratio fors13207 is 100% when the threshold is 20%, which means that refined power-safe patterns can detect all power-risky faults, and thus there is no need to generate new low-power patterns for this circuit. However, it can also be seen that for some cases the method is inefficient. For example, test cases s1423 and s35932 have very low reduction ratios (only 9.74% and 2.27% for 15% threshold, respectively). This is due to the initial numbers of power-safe patterns in s1423 and s35932 being extremely small; fewer than ten power-safe patterns can be used in these cases. Therefore, the refined power-safe test patterns cannot detect many power-risky faults. From Table I, it can also be seen that when the power threshold is increased, the number of power-safe patterns increases and thus more power-risky faults can be detected by refining power-safe patterns.
The results for the ITC’99 benchmark are similar to those for ISCAS’89 benchmark, as shown in Table II. The average reduction ratios of power-risky faults are 67.04% and 79.83% for 15% and 20% of max WSA, respectively. In cases b17 to b19, it can be seen that power-risky fault reduction ratios are higher than 97%. The ratio reaches 100% when Pth is 20% of WSA. In cases b20 to b22, the power-risky fault reduction ratios are 26.9% to 39.6% when Pth is 15%, and 56.7% to 62.5% when Pth is 20%. This is also due to these cases having fewer power-safe patterns under the same power threshold.
6.2 Low-Power Test Pattern Regeneration:
The effectiveness of the low-power test pattern regeneration process was examined next. This process is used to generate
patterns to detect the undetected power-risky faults, Fu. The newly detected faults are removed from Fu and the patterns detecting these faults are added into Tns. The remaining faults are unresolved faults. Table III shows the experimental results. The column |Fur| lists the number of unresolved faults that
cannot be solved using the proposed low-power test pattern regeneration for a given Pth. The column |Tns| lists the
number of newly generated power-safe patterns and the
column |Tall| lists the number of final power-safe patterns
which is the sum of |Ts| and |Tns|. The column _ # of PT
(%) shows the ratio of the pattern number difference between Tall and Tatpg over |Tatpg|, i.e., (|Tall|-|Tatpg|)/|Tatpg|*100%.
TABLE II
Power-Risky Faults Reduction With Test Pattern Refinement Only on ITC’99 Benchmark
When Pth is 15% of max WSA, the final pattern number is
larger than that obtained with Pth of 20% of max WSA, and in
some cases is even higher than the initial pattern number. This is because when the power threshold is lower, more X-bits need to be specified for power reduction, which reduces the detectability of these patterns. Therefore, more power-safe patterns need to be generated to detect power-risky faults.
TABLE III
7. CONCLUSION
Capture-power-safe test pattern determination procedure to address the capture power problem is proposed. The test pattern refinement process in the proposed procedure refines power-safe patterns to detect the power-risky faults and discards the power-risky patterns to ensure the capture power safety. The capture power of newly generated patterns is also guaranteed to be under the power constraints. The experimental results show that more than 75% of power-risky faults can be detected by refining the power safe patterns, and that the required test data volumes can be reduced by 12.76% on average under the appropriate power constraints without fault coverage loss.
8. REFERENCES
[1] N. Ahmed, M. Tehranipoor, and V. Jayaram, “Transition delay fault test pattern generation considering supply voltage noise in a SOC design,” in Proc. Design Autom. Conf., 2007, pp. 533–538.
[2] Y. Bonhomme, P. Girard, L. Guiller, C. Landrault, and S. Pravossoudovitch, “A gated clock scheme for low power scan testing of logic ICs or embedded cores, ” in Proc. Asian Test Symp., 2001, pp. 253–258. [3] K. Enokimoto, X. Wen, Y. Yamato, K. Miyase, H. Sone, S. Kajihara, M. Aso, and H. Furukawa, “CAT: A critical-area-targeted test set modification scheme for reducing launch switching activity in at-speed scan testing,” in Proc. Asian Test Symp., 2009, pp. 99–104
[4] T.-C. Huang and K.-J. Lee, “A token scan architecture for low power testing,” in Proc. Int. Test Conf., 2001, pp. 660–669.
[5] K.-J. Lee, S.-J. Hsu, and C.-M. Ho, “Test power reduction with multiple capture orders,” in Proc. Asian Test Symp., 2004, pp. 26–31.
[6] J. Li, Q. Xu, Y. Hu, and X. Li, “X-Filling for simultaneous shift- and capture-power reduction in at-speed scan-based testing,” IEEE Trans. Very Large Scale Integr. Syst., vol. 18, no. 7, pp. 1081–1092, Jul. 2010.
[7] E. K. Moghaddam, J. Rajski, S. M. Reddy, and M. Kassab, “At-speed scan test with low switching activity,” in Proc. VLSI Test Symp., 2010, pp. 177– 182.
Gundapu Srivalli 14ND1D5704
M.Tech Student Scholar Father Name:Hari Babu
Department of Electronics & Communication Engineering, Specialization: VLSI
St.Mary’s Women’s Engineering College, Budampadu, Guntur district, A.P, India.
+91 9390224235
N.Ramesh Babu,
Asst.professor, Department of Electronics & Communication Engineering,
St.Mary’s Women’s Engineering College, Budampadu, Guntur district, A.P, India. [email protected]