ISSN (Print) : 2320 – 3765 ISSN (Online): 2278 – 8875
I
nternational
J
ournal of
A
dvanced
R
esearch in
E
lectrical,
E
lectronics and
I
nstrumentation
E
ngineering
(An ISO 3297: 2007 Certified Organization) Website: www.ijareeie.com
Vol. 6, Issue 7, July 2017
GLCM and KNN based Algorithm for Plant
Disease Detection
Gautam Kaushal1, Rajni Bala2
Assistant Professor, Dept. of ECE, University College of Engineering, Punjabi University Patiala, India1
Student, Dept. of ECE, University College of Engineering, Punjabi University Patiala, India2
ABSTRACT: The image processing is the technique which is applied to process the digital information from the images. The plant disease detection is the technique which is applied to detect disease from the input images. In this work, technique is applied which is based on textural feature extraction, segmentation and classification. The GLCM algorithm is applied which extracts textural features from the image. The k-mean clustering algorithm is used for the segmentation of input images. The SVM classifier is applied in the existing algorithm which will classify the input image into two classes. To improve performance of existing algorithm the SVM classifier is replaced with KNN classification. This leads in an improved accuracy of disease detection, moreover classifying the data into multiple classes.
KEYWORDS: Segmentation, Plant Disease Detection, SVM, GLCM, K-means, KNN.
I.INTRODUCTION
Image Processing is the technique of conversion of an image into digital format and later-on, a sequence of operations is performed on it to get an enhanced image. This enhanced image is further used for extracting out useful information from it. Also, we can define image processing as the study of any algorithm that takes an image as input and delivers a processed image as an output. Image processing is referred to processing of a 2D picture by a computer [1].Digital image processing focuses on two major tasks, one it improves pictorial information for human interpretation and other to Process the image data for storage, transmission and representation for autonomous machine perception. Image processing usually refers digital Image processing but optical and analog image processing also are possible. There are many ways through which one can detect plant pathologies. Most of these diseases do not have any detectable symptoms associated and display very late. Image processing technology in the agricultural research has made significant development [2]. We are now able to automate many of the systems that can detect the plant pathologies, for e.g. to recognize and classify fungi disease an automated system has been implemented using algorithm such as back propagation, PCA and SVD techniques of neural network. Once a network has been structured for a particular application, that network is geared up to be trained. To start the process the initial weights are randomly chosen. Then, the training, or learning, begins [3]. Supervised and unsupervised are the two training datasets. Supervised training involves a mechanism of providing the network with the desired output. Unsupervised training is where the network has to make intellect of the inputs without outside help or interference [4].
Principal Component Analysis (PCA): PCA finds a linear projection of high dimensional data into a lower dimensional subspace such that [5]: The variance retained is maximized. The least square reconstruction error is minimized. Principal component analysis (PCA) is a widely-used dimensionality reduction technique in data analysis. Its popularity comes from three key properties. First, it is the optimal (in terms of mean squared error) linear scheme for compressing a set of high dimensional vectors into a set of lower dimensional vectors and then reconstructing. Second, the model parameters can be calculated directly from the data [6]. Third, compression and decompression are simple operations to carry out given the model parameters – they require only matrix multiplications.
ISSN (Print) : 2320 – 3765 ISSN (Online): 2278 – 8875
I
nternational
J
ournal of
A
dvanced
R
esearch in
E
lectrical,
E
lectronics and
I
nstrumentation
E
ngineering
(An ISO 3297: 2007 Certified Organization) Website: www.ijareeie.com
Vol. 6, Issue 7, July 2017
function whose value depends only on the distance from the origin [7]. Sums of radial basis functions are typically used to approximate given functions. RBFs are also used as a kernel in support vector classification.
II.LITERATURE SURVEY
Shrutiet.al, (2014) examined in this paper [8] tomato crop which is attacked by the disease that turns the leaf gray,to white and black in the end. Scientifically, this disease is known as “cercospora leaf spot” or “cercospora crucifer arum”. This is a disease which often kills young seedlings. Air is the medium through which fungus spread on the tomato plant. Hence tomato plantsmust be monitored regularly in order to check their quality. In this paper a novel technique has been proposed which visual the growth of plant from stem and check its type of fungus it is infected. The color depth, size of the fungus, location as well as locus of the fungus on leaves give a precise strength of crop quality under the soil.
In this paper (2013) [9] S. Arivazhagan et.al showed symptoms of plant diseases and how to detect them. The proposed technique is used for automatic detection and classification of plant leaf diseases based upon a software solution. The proposed scheme consisting of four steps i.e. input RGB image creation (for color transformation structure), using specific threshold value followed by segmentation process, then the green pixels are masked and removed. After that the texture statistics are computed for the useful segments, finally the extracted features are passed through the classifier. The proposed algorithm has greater accuracy which is 94% with good efficiency.
Prof. Sanjay B. Dhaygude et.al, (2013) explained in this paper [10] plant disease detection and its prevention. Most plant diseases are due to bacteria, viruses and fungus. Fungi are recognized first and foremost from their morphology, with emphasis placed on their reproductive structures. The developed processing scheme consists of four main steps, first a color transformation structure for the contribution RGB image is created, and this RGB is transformed to HSI for color generation and his fore color descriptor. Then green pixels are cloaked and removed using specific threshold value, then the image is segmented and the useful segments are extracted, finally the texture statistics is computed from SGDM matrices. Finally, the presence of diseases on the plant leaf is evaluated.
Rani Pagariyaet.al,(2014) provided in this paper [11] a survey related to the plant diseases detection using neural network technique. Nowadays image processing is latest technique to detect plant disease in any crop. The diseases may affect crop growth. This paper mainly concentrates on the various diseases of cotton plants and classifies their disease. There are so many classification techniques such as k-means Classifier, k-Nearest Neighbor classifier, Genetic Algorithm, Probabilistic Neural Network, Support Vector Machine, PCA and neural network techniques. After those selection criteria depends upon of the input of the data. This paper gives brief classification for the classification of plant diseases.
SmitaNaikwadi, et.al, (2013) proposed in this paper [12] an experiment which shows classification and detection of plant diseases. Insecticides are not always proved efficient because insecticides may be toxic to some species of birds. It also damages n natural animal food chains. The following two steps are added successively after the segmentation phase. In the first step, they identified the mostly green colored pixels. Then using Otsu's method, pixels are masked having green color. Then those mostly green pixels are masked. After that, red green and yellow color based pixel cluster are removed which are infected. The experimental results show that proposed technique is the best for plant detection.
Haiguang Wang, et.al, (2012) proposed in this paper [13] a technique to recognize the disease of two plants. This investigation has been done on two grapes plants and two wheat plants to improve accuracy using image processing techniques. Back propagation (BP) networks were used as the classifiers to identify grape diseases and wheat diseases, respectively. The results showed that identification of the diseases could be effectively achieved using BP networks. While the dimensions of the feature data were reduced by using PCA, the optimal recognition result for grape diseases was obtained as the fitting accuracy was 100% and the prediction accuracy was 97.14%, and that for wheat diseases was obtained as the fitting accuracy and the prediction accuracy were both 100%.
III.PROPOSED APPROACH
ISSN (Print) : 2320 – 3765 ISSN (Online): 2278 – 8875
I
nternational
J
ournal of
A
dvanced
R
esearch in
E
lectrical,
E
lectronics and
I
nstrumentation
E
ngineering
(An ISO 3297: 2007 Certified Organization) Website: www.ijareeie.com
Vol. 6, Issue 7, July 2017
a. Pre-processing phase
In the first phase, the plant leaf image is given which is converted to grayscale.
This is actual step in which the features are extracted from the image that has undergone segmentation. Feature extraction is the means through which one trains the training set data which is to be used in the next step.
GLCM: The approach that we are implementing uses GLCM i.e. grey level co-occurrence matrix. A GLCM is a matrix where the number of rows and columns is equal to the number of gray levels, G, in the image. The matrix element P (i, j | ∆x, ∆y) is the relative frequency with which two pixels, separated by a pixel distance (∆x, ∆y), occur within a given neighborhood, one with intensity ‘i’ and the other with intensity ‘j’. The matrix element P (i, j | d, ө) contains the second order statistical probability values for changes
between gray levels ‘i’ and ‘j’ at a particular displacement distance d and at a particular angle (ө). Using a large number of intensity
levels G implies storing a lot of temporary data, i.e. a G × G matrix for each combination of (Δx , Δy) or (d, ө). Due to their large
dimensionality, the GLCM’s are very sensitive to the size of the texture samples on which they are estimated. Hence, the number of gray levels is often reduced
GLCM algorithm
1. Count all the number of pixels in the matrix in which the data is saved. 2. Store the counted pixels in matrix P[I,j].
3. Check similarity between pixels in the matrix by applying histogram technique. 4. Calculate contrast factor from the matrix:
= exp[ ( )− ( )
( )− ( )]
5. The elements of g need to be normalized by dividing the pixels.
=
0.8 < 0.8
1.2 > 1.2
ℎ
b.Image Segmentation: The Image segmentation technique is applied which will segment the image based on their properties. Acquiring the image and splitting it into several regions (or segments) which are further used individually for extracting out the image features is termed as the segmentation. In this work, the region based k-mean segmentations technique is applied for the image segmentation.
K-mean clustering: The approach that we are implementing is k-mean clustering algorithm for segmentation. It is one of the popular methods used for segmentation. In this we divide the image into various clusters i.e. divides a set of data into specific number of groups. Data is classified into k number of disjoint sets. A k-centroid is determined and then each point which has least distance from the centroid is taken into consideration. There are several ways of defining the distance of nearest centroid, one such method is Euclidean distance. Euclidean distance is calculated consecutively for each data point and the data point having the minimum distance is assigned to the cluster. These minimum points are summed up to get a centroid. This is how k-mean clustering works
INPUT: Dataset
OUTPUT: Clustered Data
Start ( )
1. Read dataset and dataset has number of rows “r” and number of columns “m” 2. For (i=0;i=r; i++) /// selection of centroid point
1. For (j=0; j=m; j++) 2. Select k=data (i, j); End
3. Calculation of Euclidian distance() 1. For (i=0;i=r;i++) 2. For (j=9;j=m;j++) 3. A(i)=data(i); 4. B(i)=data(j);
5. Distance = sqrt[(A(i+1)-A(i)^2) –(B(j+1)-B(j)^2); End
4. Normalization ()
ISSN (Print) : 2320 – 3765 ISSN (Online): 2278 – 8875
I
nternational
J
ournal of
A
dvanced
R
esearch in
E
lectrical,
E
lectronics and
I
nstrumentation
E
ngineering
(An ISO 3297: 2007 Certified Organization) Website: www.ijareeie.com
Vol. 6, Issue 7, July 2017
5. Repeat step 3 to 4 until all points get clustered.
c. Classification of Data: The KNN is the classification technique which is applied to classify similar and dissimilar data into more than one classes. The training samples are depicted by n dimensional numeric attributes. Every sample represents a point in an n-dimensional space. Along these lines, the greater part of the training samples is stored in an n-n-dimensional pattern space. At the point when given an unknown sample, a k-nearest neighbor classifier looks the pattern space for the k training samples that are closest to the unknown sample. "Closeness" is defined in terms of Euclidean distance. Not at all like decision have tree induction and back propagation, nearest neighbor classifiers assigned break even with weight to every attribute. This may bring about confusion when there are numerous irrelevant attributes in the data. Nearest neighbor classifiers can likewise be utilized for prediction, that is, to give back a genuine valued prediction for a given unknown sample. For this situation, the classifier gives back the average value of the genuine valued associated with the k nearest neighbors of the unknown sample. The k-nearest neighbors' algorithm is among the simplest of all machine learning algorithms. This is the final step in the image processing. In this step the image is classified into a specific class by making use of the features that were inherited in the feature extraction step. In this work we use classification to classify the diseases that the leaves are having. At this step our machine learns how to give a proper name to a diseased leaf. There are many algorithms that can be used for classification. In this work, we are using KNN (k-Nearest Neighbor) algorithm.
ISSN (Print) : 2320 – 3765 ISSN (Online): 2278 – 8875
I
nternational
J
ournal of
A
dvanced
R
esearch in
E
lectrical,
E
lectronics and
I
nstrumentation
E
ngineering
(An ISO 3297: 2007 Certified Organization) Website: www.ijareeie.com
Vol. 6, Issue 7, July 2017
IV.RESULTS AND DISCUSSION
In the existing technique, linear SVM is used for classification. The linear SVM only classify the data into two classed which is very inefficient and reduce accuracy of classification. In this work, other classifier than SVM will be applied which classify data more than two classes. we applied KNN which will classify more than two type of classes. The result of KNN and comparison chart of two techniques is shown below.
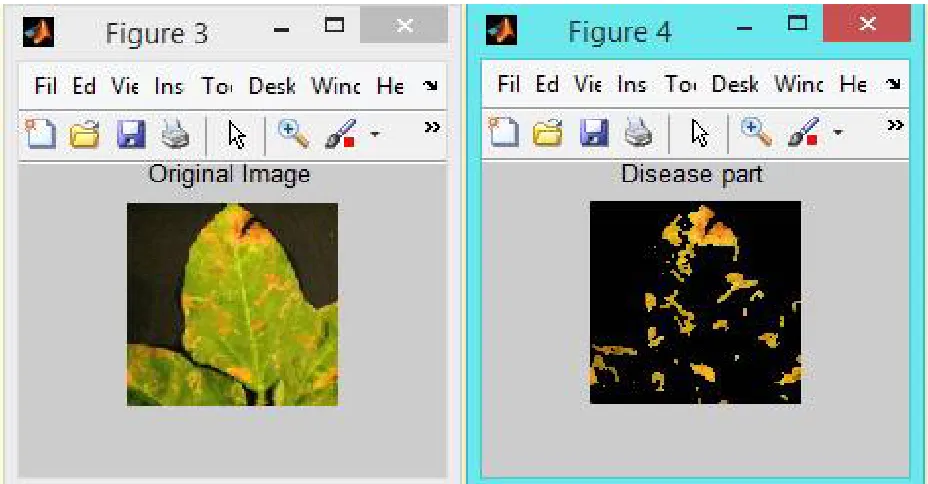
As shown in the figure 2, the image is given as input from which we need to detect the disease. The input image will be converted to the gray scale to apply GLCM algorithm for the feature extraction which will extract the textural features like energy, entropy etc. These input features are used for the plant disease detection.
Fig2.Diseased leaf image Fig 3.Output segmented images using k-mean clustering
As shown in figure 3, the algorithm of k-mean is applied which is the textural feature based segmentation algorithm. In the k-mean clustering algorithm, the centered point is calculated from which the Euclidian distance is calculated and data is clustered according to their similarity.
.
ISSN (Print) : 2320 – 3765 ISSN (Online): 2278 – 8875
I
nternational
J
ournal of
A
dvanced
R
esearch in
E
lectrical,
E
lectronics and
I
nstrumentation
E
ngineering
(An ISO 3297: 2007 Certified Organization) Website: www.ijareeie.com
Vol. 6, Issue 7, July 2017
In figure 4, We will enter the number of cluster in which we have ROI (region of interest).After entering the cluster number, we will get cluster having diseased part.
As shown in the figure 5, The GLCM feature extraction and segmentation algorithm is been applied which will segment the image according to their similarity. The final disease image is shown in which disease part is highlighted.
Fig5.Diseased part segmented from original image
Fig 6.Classification results displayed using a message box
ISSN (Print) : 2320 – 3765 ISSN (Online): 2278 – 8875
I
nternational
J
ournal of
A
dvanced
R
esearch in
E
lectrical,
E
lectronics and
I
nstrumentation
E
ngineering
(An ISO 3297: 2007 Certified Organization) Website: www.ijareeie.com
Vol. 6, Issue 7, July 2017
Fig 7. Accuracy comparison Fig 8. False Acceptance Rate comparison
Accuracy then: 70-80% & now: 80-90% results then: 0.7-0.8 & now 0.8-0.9 V.CONCLUSION
In this work, it is being concluded that plant disease detection required three main steps namely feature extraction, segmentation and classification. In the existing technique GLCM algorithm is used to extract the textural features. The k-mean clustering is applied to segment input images. The SVM classifier is replaced with the KNN classifier in the proposed work to classify data into multiple classes. The performance of proposed algorithm is tested in terms of accuracy and false positive rate with is increase up to 10 percent as compared to existing technique.
REFERENCES
[1] Piyush Chaudhary Anand K. Chaudhari Dr. A. N. Cheeranand Sharda Godara “Color Transform Based Approach for Disease Spot Detection on Plant Leaf”, International Journal of Computer Science and Telecommunications [Volume 3, Issue 6, June 2012.
[2] Krystian Mikolajczyk and Cordelia Schmid “A performance evaluation of local descriptors”, Pattern Analysis and Machine Intelligence”, IEEE Transactions on Pattern Analysis and Machine Intelligence,Volume 27, Issue 10,2005, pp 1615 – 1630.
[3] R. Yusnita, Fariza Norbaya, and Norazwinawati Basharuddin, “Intelligent Parking Space Detection System Based on Image Processing”, International Journal of Innovation, Management and Technology, Vol. 3, No. 3, June 2012.
[4] Karsten Bems Riidiger Dillmann Roland Hofstetter “An Application of a Backpropagation Network for the Control of a Tracking Behavior “Proceedings of the 1991 BEE Intematid Conference. on Robotics and Automatim Sacramento, California - April 1991.
[5] Mark Weber, Paul B. Crilly, Senior Member, IEEE, and William E. Blass “Adaptive Noise Filtering Using an Error- Backpropagation Neural Network” IEEE TRANSACTIONS ON INSTRUMENTAT–ATION AND MEASUREMENT, VOL 40, NO 5. OCTOBER 1991.
[6] Muhammad Faisal Zafar, Dzulkifli Mohamad, Muhammad Masood Anwar “Recognition of Online Isolated Handwritten Characters by BackPropagation Neural Nets Using Sub-Character Primitive Features”,Informatics Complex,FSKSM, University Teknologi Malaysia, 2006 IEEE.
[7] Pranab Mohanty, Sudeep Sarkar, Rangachar Kasturi, Fellow, IEEE, and P. Jonathon Phillips “Subspace Approximation of Face Recognition Algorithms: An Empirical Study” IEEE TRANSACTIONS ON INFORMATION FORENSICS AND SECURITY, VOL. 3, NO. 4, DECEMBER 2008.
[8] Shruti and Nidhi Seth, “Fungus/Disease Analysis in Tomato Crop using Image Processing Technique”, International Journal of Computer Trends and Technology (IJCTT) volume 13 number 2 July, 2014.
[9] Prof. Sanjay B. Dhaygude and Mr.Nitin P.Kumbhar, “Agricultural Plant Leave detection using image Processing”, International Journal of Advanced Research in Electrical, Electronics and Instrumentation Engineering Vol. 2, Issue 1, January 2013.
[10] R. NewlinShebiah,S.Ananthi S. Vishnu Varthini, “Detection of unhealthy region of plant leaves and classification of plant leaf diseases using texture features”,AgricEngInt: CIGR Journal, vol. 15 no. 1, March 2013.
0 0.1 0.2 0.3 0.4 0.5 0.6 0.7 0.8 0.9 1
1 2 3 4 5
R at io o f A cc e p ta n ce R at e
Number of images
ISSN (Print) : 2320 – 3765 ISSN (Online): 2278 – 8875
I
nternational
J
ournal of
A
dvanced
R
esearch in
E
lectrical,
E
lectronics and
I
nstrumentation
E
ngineering
(An ISO 3297: 2007 Certified Organization) Website: www.ijareeie.com
Vol. 6, Issue 7, July 2017
[11] SmitaNaikwadi, NiketAmoda, “Advances in Image processing for detection of plant disease”, International Journal of Application or Innovation in Engineering & Management, volume 2 issue 11, 2013.
[12] Rani Pagariya and MahipBartere, “Review paper on identification of plant diseases using image processing technique”, 2014.