DOI: 10.15662/ijareeie.2014.0307049
Estimation of Available Nitrogen in Soil by
Direct Measurement of Capacitance
Nagendra Tripathi
1,
Dr. Anup Mishra
2Research Scholar, Dept. of EE, Dr. CVR University, Bilaspur, Chhattisgarh, India1
Professor, Dept. of EEE, Bhilai Institute. Of Technology, Durg, Chhattisgarh, India2
ABSTRACT: Electrical Conductivity is a very quick, simple and inexpensive method that farmers and home gardeners can use to check the health of their soils. Whereas pH is a good indicator of the balance of available nutrients in your soil, Electrical Conductivity can almost be viewed as the quantityof available nutrients in your soil.
KEY WORDS: Electrical conductivity, capacitance.
I.
INTRODUCTIONSoil electrical conductivity is an indirect measurement that correlates very well with several soil physical and chemical properties. Electrical conductivity is the ability of a material to conduct (transmit) an electrical current and it is commonly expressed in units of milliSiemens per meter (mS/m). In this paper correlation is obtained between nitrogen content of the soil and the capacitance offered by the soil. Change in the values of capacitance can be measured and prediction of approximate the nitrogen level in the coil can be obtained.
Brief literature survey: D.D. Austin et al., 1971, developed Soil model to predict soil temperature with depth and time..Soil electrical conductivity (EC) is a measurement that correlates with soil properties that affect crop produc-tivity, including soil texture, cation exchange capacity (CEC), drainage conditions, organic matter level, salinity, and subsoil characteristics.Soil electrical conductivity (ECa) was taken as an important precision agriculture tool useful for determining spatial changes in soil properties. Three near-surface geophysical methods are available for rapid, continuous measurement of ECa in agricultural fields. Anderson-Cook et al., 2002, suggested electromagnetic induction (EMI), capacitively coupled resistivity (CCR), and galvanic contact resistivity (GCR).Moisture in soil significantly affects the dielectric properties of soil. Physical and chemical properties show remarkable variation in dielectric properties. This is because, for a composite material such as moist soil, the dielectric constant is not a simple function of the values for the individual components. The electrical conductivity of soil water is a good indicator of amount of nutrients available for crops to absorb as reported by Martin Capewell in 2011.
A. Laboratory Procedures to determine EC Value of Soil Sample.
Measurements of Electrical Conductivity is determined on a saturation extract of soil or supernatent liquid of 1:2 soil water suspension. Electrical conductivity is measured with the help of Electrical Conductivity Meter. The Conductivity Meter is to be calibrated and cell constant be determined with a Standard Solution of 0.7456 gm of dry potassium chloride of 1 liter of distilled water (at 25°C , this solution gives Electrical Conductivity of 1.41 millimohs/cm. A 20gm of soil sample is shaken with 40ml of distilled water in a 250ml conical flask for 1hr. The conductivity of the suppernatent liquid is determined with the help of conductivity meter.
B. Factors affecting soil conductivity
Sands have low conductivity and clays have high conductivity, soil electrical conductivity correlates very strongly with particle size and soil texture. Soils prone to drought or excessive water will show variations in soil texture that can be delineated using soil electrical conductivity.
can delineate differences in organic matter content and cation exchange capacity (also known as electrical conductivity).
Using soil electrical conductivity to create zones with different management strategies is becoming very popular. Areas are grouped by similar electrical conductivity values and may respond similarly to different management systems.
II.
METHODOLOGYThe capacitance offered by parallel plate capacitor is given by
( 1)
Where,
A=area of cross section of parallel plate capacitor d=distance between plates of capacitor
∊=permittivity of the dielectric material Also,
∊=∊o∊r
∊o=absolute permittivityof the material ∊r=relative permittivityof the material
From eq (1) the value of capacitance depends upon ∊, A and d. Keeping d and A constant the capacitance offered is directly proportional to the ∊. More over the value of ∊ further t ∊o and ∊r. Where ∊o is again constant.
Hence further it can be concluded that value of capacitance depends upon ∊r. ∊r depends upon the property of the
material.
A.Effect of frequency on capacitance:
The capacitive reactance offered by capacitor is given by Xc .
Xc (2)
Where,
f=supply frequency C= capacitance Eq. (2) can be rewritten like
(3)
From eq.(3) the capacitance is inversely proportional to the supply frequency. On increasing frequency the
capacitance offered by the capacitor will decrease and on decreasing frequency the value of capacitor will increase.
B. Test bench set-up:
1. Parallel plate capacitor dimension with A=1600 mm2, d= 45 mm
2. Digital multimeter for measurement of capacitor. 3. Function generator.
C.Procedure:
1. The soil (20 gm) whose properties is to be determined is used as dielectric material in parallel plate capacitor.25 ml of distilled water is added on soil.
2. Using function generator signal is applied across it. Keeping voltage magnitude constant the frequency of the signal is varied in steps .
3. For each value of the frequency the value of capacitance is noted with the help of digital multimeter. 4. Take another soil sample and repeat step 1, 2, 3 and tabulate the results.
5. 10 -10 soil samples each soil having low and medium nitrogen content were used as dielectric material .These soil samples were duly tested by authorized government soil testing laboratory.
7. Table 2 shows the different vales of capacitance measured for different values of frequencies when the nitrogen content in the soil was medium (qualitative).
8. Graph 1 and 2 has been plotted between capacitance and frequency for soil having low and medium nitrogen content.
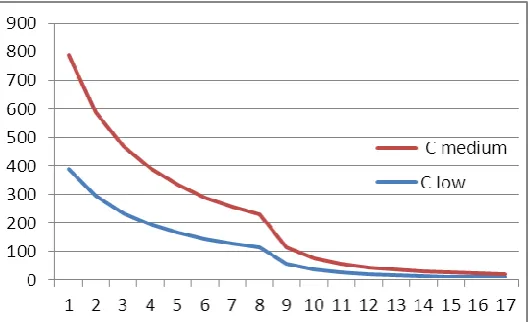
9. Graph 3 is the comparison between the values of capacitance measured for soil having low and medium
nitrogen content.
III.
OBSERVATION AND RESULTThe test has been performed on different soil sample have different nitrogen level .The observation table has been prepared for the capacitance seen at different frequency.
Table1: Capacitance offered by soil having low Nitrogen S.No. Frequency in (Hz) Capacitance Unit
1 10 0.775 µF
2 20 0.569 µF
3 30 387.9 nF
4 40 294.5 nF
5 50 234.5 nF
6 60 195.1 nF
7 70 166 nF
8 80 143 nF
9 90 128 nF
10 100 115 nF
11 200 57 nF
12 300 37 nF
13 400 28.21 nF
14 500 22.01 nF
15 600 18.43 nF
16 700 15.59 nF
17 800 13.63 nF
18 900 11.97 nF
19 1000 10.77 nF
20 2000 5.06 nF
21 3000 3.2 nF
22 4000 2.32 nF
23 5000 1.72 nF
24 6000 1.36 nF
25 7000 1.08 nF
26 8000 0.891 nF
27 9000 0.74 nF
28 10000 0.614 nF
Table-2: Capacitance offered by soil having medium Nitrogen
S.No .
Frequency in Hz Capacitance Units
1 10 1.198 μF
2 20 0.589 μF
3 30 399 nF
4 40 295 nF
5 50 234.6 nF
6 60 195.4 nF
7 70 167.4 nF
8 80 145.6 nF
9 90 129.8 nF
10 100 117.1 nF
11 200 57.9 nF
12 300 38.5 nF
13 400 28.41 nF
14 500 22.50 nF
15 600 18.58 nF
16 700 15.82 nF
17 800 13.70 nF
18 900 12.17 nF
Fig. 2: Graph between Capacitance and frequency (Soil having medium nitrogen level)
Fig 3: Graph showing the comparison of Capacitance measured with soil having low and medium nitrogen level
The capacitance offered by the soil can be correlated with the nitrogen present in it. The nitrogen level (qualitative) can be predicted by measurement of capacitance.
IV.
CONCLUSION1. For soil having low nitrogen level value of capacitance varies from 0.775 μF to 0.0092 nF when supply frequency is varied from 10 Hz to 20kHz.
2. For soil having low nitrogen level value of capacitance varies from 1.198 μF to 10.80nF when supply frequency is varied from 10 Hz to 1000Hz.
3. The value of capacitance decreases rapidly for frequency ranges of 10 Hz to 100 Hz both for soil having low and medium nitrogen level.
4. Small change in the value of capacitance is observed for frequency greater than 100 Hz beyond 1000 Hz the capacitance seen is very low.
5. Value of capacitance measured for frequency range of 1Hz to 20 Hz are in microfarad and beyond 20 Hz capacitances seen are in range of nanofarad.
6. A significant difference in seen in values of capacitance measured with soil having low and medium nitrogen level.
Advantages: The discussed method is fast ,easy and economical method for the estimation of nitrogen level in soil. Not much of technical knowledge is needed if used in soil testing laboratories.
Disadvantages:
REFERENCES
[1] Dabas, M., Tabbagh, A., (2003). A comparison of EMI and DC methods used in soil mapping—theoretical considerations for precision agriculture. In: Stafford, J.,Werner, A. (Eds.), Precision Agriculture.Wageningen , Academic Publishers, Wageningen, The Netherlands, pp. 121–127.
[2] Fystro, G., (2002). The prediction of C and N content and their potential mineralization in heterogeneous soil samples using Vis-NIR spectroscopy and comparative methods. Plant and Soil 246, 139–149.
[3] Price, R.R., Hummel, J.W., Birrell, S.J., Ahmad, I.S., (2003). Rapid nitrate analysis of soil cores using ISFETs. Transactions of the ASAE 46 (3), 601–610.
[4] T.J. Dean, J.P. Bell, A.J.B. Baty,( 1987) ― Soil moisture measurement by an improved capacitance technique, Part I. Sensor design and performance‖, Journal of Hydrology
[5] Doerge, T., Kitchen, N.R., and Lund, E.D. Site-Specific Management Guidelines: Soil Electrical Conductivity Mapping. Potash and Phosphate Institute (PPI). Publication No. SSMG-30.
[6] Grisso, R., Alley, M., Holshouser, D., Thomason, W. Precision Farming Tools: Soil Electrical Conductivity. Virginia Cooperative Extension. Publication No. 442-508.
[7] Sudduth, K.A., Kitchen N.R., Wiebold, W. J., Batchelor, W.D., Bollero, G.A., Bullock, D.G., Clay, D.E., Palm, H.L., Pierce, F.J., Schuler, R.T., Thelen, K.D. (2005). Relating apparent soil electrical conductivity to soil properties across the north-central USA. Computers and Electronics in Agriculture. 46(2005)263-283. Elsevier.
[8] Buchleiter, G.W., Farahani, H., (2002). Comparison of electrical conductivity measurements from two different sensing technologies. Paper No. 02-1056, ASAE, St. Joseph, Michigan.
[9] Andrade, P., Rosa, U.A., Upadhyaya, S.K., Jenkins, B.M., Aguera, J., Josiah, M., 2001b. Soil profile force measurements using an instrumented tine. Paper No. 01-1060, ASAE, St. Joseph, Michigan.
[10] Starr, J.L., Paltineanu, I.C., (2002). Capacitance Devices. In: Dane, J.H.,Topp, G.C. (Eds.), Methods of Soil Analysis,Part 4, Physical Methods. SSSA, Madison, Wisconsin, pp. 463–474.
[11] Adamchuk, V.I., Morgan, M.T., Sumali, H., (2001) a. Application of a strain gauge array to estimate soil mechanical impedance on-the-go. Transactions of the ASAE 44 (6), 1377–1383.
[12] Fan, G., Zhang, N., Sun, Y., Oard, D., (2001). Simultaneous sensing of soil conductive and capacitive properties.Paper No. 01-1021, ASAE, St. Joseph, Michigan.
[13] Starr, J.L., Paltineanu, I.C.,( 2002). Capacitance Devices. In: Dane, J.H.,Topp, G.C. (Eds.), Methods of Soil Analysis, Part 4, Physical Methods. SSSA, Madison, Wisconsin, pp. 463–474.
[14] Anderson-Cook [2 ] Anderson-Cook, C.M., M.M. Alley, J.K. Roygard, R. Khosla, R.B. Noble, and J.A. Doolittle. Differentiating soil types using electromagnetic conductivity and crop yield maps. Soil Science Society of America Journal 66:1562-1570 (2002).