Automatic Machine Learning Forgery Detection
Based On SVM Classifier
S.L.Jothilakshmi 1 V.G.Ranjith2
1
Assistant Professor , Department of IT, PET engineering college,,Tamilnadu, India.
2
Assistant Professor, Department of software Engineering, NI university, Tamilnadu India
Abstract- For decades powerful digital image editing software makes image modifi cations straightforward. In this paper analyze one of the most common form of photographic manipulation is known as Image Composition or Splicing. For that purpose a forgery detection method is used to exploits subtle inconsistencies in the color of the illumination of images. The technique (Machine Learning) is applicable to images containing two or more people. To achieving this concept, the information from physics (Chromaticity)-and statistical (texture and edge)-based illuminate estimators on image regions of similar images are taken. Then the extracted texture and edge-based features are provided to machine-learning approaches for Automatic Decision-Making. The Classification performance achieved by an SVM (Support Vector Machine) meta-fusion classifier. In machine learning of SVM is a supervised learning model with associated in learning algorithm.
Keywords- Color constancy, illuminant color, image forensics, machine learning, spliced image detection, texture and edge descriptors. SVM Classifier.
I.INTRODUCTION
Imagemanipulation is another way to say editing photos and can add filters, remove redness, adjust the hue,
and increase or decrease size. Image Composition (or
Splicing) is one of the most common image manipulation operations. One such example is shown in Figure. 1, in which the girl on the right is inserted. This image shows a harmless manipulation case. It is a simple process that crops and paste region from the same or separate sources. Color has been successfully used for object tracking and recognition. However, the color of an object changes if the illuminant’s color changes.
Color-based method search for inconsistencies in the interactions between object color and light color. Color constancy is ability to perceive colors of objects for invariant to the image.When assessing the authenticity of an image, forensic investigator uses all available sources of tampering evidence.
Figure.1 image composition
Forensics investigators use all available sources of tampering evidence. Tampering means International modification of products in a way that would make them harmful to the consumer.Figure.2. As we can see in parliament meeting, one people not attends but that people should attend the meeting.
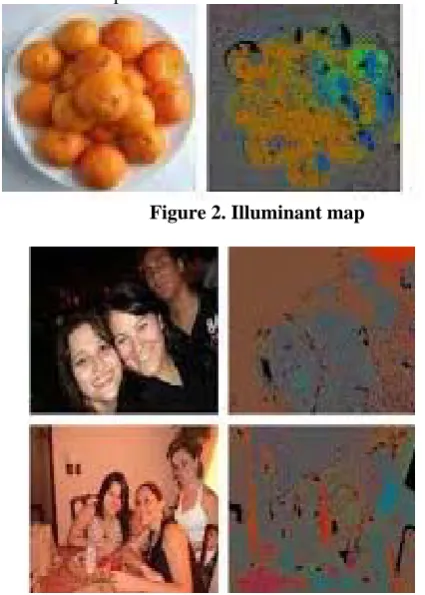
For investigating manipulated images the texture and edge descriptors placed an important role. The texture is an inherently non-local image property. It is extract texture information from illuminant maps. Edge is when an image is spliced, the statistics such edges likely to differ from original image. The characterization method for illuminant maps which explores edges attributes related to the illumination process.
Figure 2. Illuminant map
Figure 3. illuminant maps for an original image(top) and a spliced ge(bottom).
II.RELATED WORK
Illumination-based methods for forgery detection are either geometry-based or color-based. Geometry-based methods focus at detecting inconsistencies in light source positions between specific objects in the scene [5]–[11]. Color-based methods search for inconsistencies in the interactions between object color and light color [2], [12], [13].
Johnson and Farid [8] also proposed spliced image detection by exploiting specular highlights in the eyes. In a subsequent extension, Saboia et al. [14] automatically classified these imagesby extracting additional features, such as the viewer position. The applicability of both approaches, however, is somewhat limited by the fact that people’s eyes must be visible and available in high resolution.
To illustrate the challenges of directly exploiting illuminant estimates, we briefly examine the illuminant maps generated by the method of Riess and Angelo poulou [2]. In this approach, an image is subdivided into regions of similar color (superpixels). An illuminant color is locally estimated using the pixels within each Recoloring each superpixel with its local illuminant color estimate yields a so-called illuminant map.
A human expert can then investigate the input image and the illuminant map to detect inconsistencies. Thus, while illuminant maps are an important intermediate representation, we emphasize that further, automated processing is required to avoid biased or debatable human decisions. Hence, we propose a pattern recognition scheme operating on illuminant maps without human interventions. The features are designed to capture the shape of the super pixels in conjunction with the color distribution. In this spirit, our goal is to replace the expert-in-the-loop, by only requiring annotations of faces in the image.
III. AUTOMATIC MACHINE LEARNING FORGERY
DETECTION
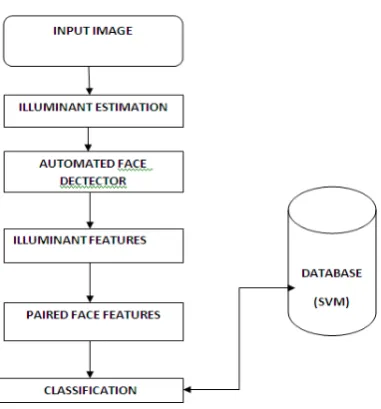
Figure .5 System Architecture
The main objective of this work is to classify the illumination for each pair of faces in the image as either consistent or inconsistent.
Throughout the paper, abbreviate illuminant estimation as IE, and illuminant maps as IM. The proposed method consists of five main components:
A. Illuminant Estimation (IE):
The input image is segmented into homogeneous regions. Per illuminant estimator, a new image is created where each region is colored with the extracted illuminant color. This resulting intermediate representation is called illuminant map (IM).
B.Face Extraction:
This is the only step that may require human interaction. An operator sets a bounding box around each face in the image that should be investigated. Alternatively,an automated face detector can be employed. then crop every bounding box out of each illuminant map,
C.Computation of Illuminant Features:
For all face regions, texture-based and gradient-based features are computed the IM values. Each one of them encodes complementary information for classification.
D.Paired Face Features:
Our goal is to assess whether a pair of faces in an image is consistently illuminated. For an image with faces, we construct joint feature vectors, consisting of all possible pairs of faces.
E.Classification:
We use a machine learning approach to automatically classify the feature vectors. We consider an image as a forgery if at least one pair of faces in the image is classified as inconsistently illuminated.
Figure.5 shows the entire system architecture of forgery detection .
A .Illuminant Estimation (IE):
To compute a dense set of localized illuminant color estimates, the input image is segmented into super pixels, i.e., regions of approximately constant chromaticity, using the algorithm by Felzenszwalb and Hutten locher . Per super pixel, the color of the illuminant is estimated.
Mainly here uses two separate illuminant color estimators: the statistical generalized gray world estimates and the physics-based inverse-intensity chromaticity space,
The original gray world hypothesis through the incorporation of three parameters:
• Derivative order n : the assumption that the average of the illuminants is achromatic can be extended to the absolute value of the sum of the derivatives of the image.ⁿⁿ
• Minkowski norm p : instead of simply adding intensities or derivatives, respectively, greater robustness can be achieved by computing the -th Minkowski norm of these values.
Putting these three aspects together, we estimate the color of the illuminant ‘ e’ as
B. Face Extraction
We require extracting face around all face in an image that should be part of the investigation for obtaining the bounding box we could in principle use in automated algorithm we prefer human operator for this task for two main reason this minimize the false detection missing faces scene context is important when judging the light situation consider an image where all person of interest are illuminated by flash light the illuminants Algorithmic trading, also called automated trading, black-box trading, or algo trading, is the use of electronic platforms for entering trading orders with an algorithm which executes pre-programmed trading instructions whose variables may include timing, price, or quantity of the order, or in many cases initiating the order by a "robot", without human intervention.
C. Illuminant Features
There are two illuminant feature texture and edge. a. Texture Description : SASI
we use statistical analysis of structural information to extract texture information from illuminant map that point out remarkably well our application the most important advantage of sasi is its capability of capturing small granularities and discontinuities in texture pattern the structural properties of texture.
The structural properties of texture is based on the auto correlation of horizontal vertical diagonal pixel lines over an image at different scale one autocorrelation. For our application, the most important advantage of SASI is its capability of capturing small granularities and discontinuities in texture patterns. Distinct illuminant colors interact differently with the underlying surfaces, thus generating distinct illumination “texture”. This can be a very fine texture, whose subtleties are best captured by SASI.SASI is a generic descriptor that measures the structural properties of textures. It is based on the autocorrelation of horizontal, vertical and diagonal pixel lines over an image at different scales.
b. Edge Description: HOG edge algorithm
Differing illuminant estimates in neighboring segments can lead to discontinuities in the illuminant map. Dissimilar illuminant estimates can occur for a number of reasons: changing geometry, changing material, noise, retouching or changes in the incident light. Thus, one can interpret an illuminant estimate as a low-level descriptor of the underlying image statistics. We observed that the edges, e.g., computed by a Canny edge detector, detect in several cases a combination of the segment borders and isophotes (i.e., areas of similar incident light in the image). When an image is spliced, the statistics of these edges is likely to differ from original images. To characterize such edge discontinuities, we propose a new feature descriptor called HOGedge. It is based on the well-known HOG-descriptor,
and computes visual dictionaries of gradient intensities in edge points. The full algorithm is described in the remainder of this section. We first extract approximately equally distributed candidate points on the edges of illuminant maps.
1.Extraction of edge points 2.Point description
3.Visual vocabulary 1.Extraction of Edge Points:
Given a face region from an illuminant map, we first extract edge points using the Canny edge detector . This yields a large number of spatially close edge points. Given a face region from an illuminant map, we first extract edge points using the Canny edge detector [33]. This yields a large number of spatially close edge points. To reduce the number of points, we filter the Canny output using the following rule: starting from a seed point, we eliminate all other edge pixels in a region of interest (ROI) centered around the seed point. The edge points that are closest to the ROI (but outside of it) are chosen as seed points for the next iteration. By iterating this process over the entire image, we reduce the number of points but still ensure that every face has a comparable density of points. 2.Point Description
Histogram of oriented gradients to describe the distribution of the selected edge points hog is based on normalized local histogram of image gradient orientation in a dense grid the hog descriptor is constructed. We compute Histograms of Oriented Gradients (HOG) [14]to describe the distribution of the selected edge points. HOG is based on normalized local histograms of image gradient orientations in a dense grid. The HOG descriptor is constructed around each of the edge points. The neighbor hood of such an edge point is called a cell. Each cell provides a local 1-D histogram of quantized gradient directions using all cell pixels. To construct the feature vector, the histograms of all cells within a spatially larger region are combined and contrast- normalized. We use the HOG output as a feature vector for the subsequent steps. 3.Visual Vocabulary
The number of extracted HOG vectors varies depending on the size and structure of the face under examination. To construct our visual dictionary, we subdivide the training data into feature vectors from original and doctored images. Each group is clustered in clusters using the k -means algorithm. Then, a visual dictionary with visual words is constructed, where each word is represented by a cluster center. Thus, the visual dictionary summarizes the most representative feature vectors of the training set.
Here we Present a novel method for generic visual categorization: the problem of identifying the object content of natural images while generalizing across variations inherent to the object class. This bag of keypointsmethod is based on vector quantization of affine invariant descriptors of image patches. We propose and compare two alternative implementations using different classifiers: Naïve Bayes and SVM.
invariant. We present results for simultaneously classifying seven semantic visual categories. These results clearly demonstrate that the method is robust to background clutter and produces good categorization accuracy even without exploiting geometric information. In our method, the vocabulary is a way of constructing a feature vector for classification that relates “new” descriptors in query images to descriptors.
D. Paired Face Features
To compare two faces, we combine the same descriptors for each of the two faces. For instance, we can concatenate the SASI-descriptors that were computed on gray world. The idea is that a feature concatenation from two faces is different when one of the faces is an original and one is spliced.
we computed the mean value and standard deviation per feature dimension. For a less cluttered plot,we only visualize the feature dimensions with the largest difference in the mean values for this fold. This experiment empirically demonstrates two points.
Firstly, SASI and HOGedge, in combination with the IIC-based and gray world illuminant maps create features that discriminate well between original and tampered images, in at least some dimensions. Secondly, the dimensions, where these features have distinct value, vary between the four combinations of the feature vectors. The SASI and HOGedge descriptors capture two different properties of the face regions. behavior. that is captured by these two descriptors.
E. Classification
The SVM classify the illumination for each pair of faces in an image as either consistent or inconsistent. Assuming all selected faces are illuminated by the same light source, we tag an image as manipulated if one pair is classified as inconsistent. Individual feature vectors, i.e., SASI or HOGedge features on either gray world or IIC-based illuminant maps, are classified using a support vector machine (SVM) classifier.Support vector machine is a method for the classification of both linear and non linear data. It uses a non linear mapping to transform the original training data into higher dimension. With in this new dimension it searches for the linear optimal separating Hyper plane(Decision Boundary).
The SVM finds this hyperplane using support.Vectors and margins(defined by support vectors).The proposed obtain a non linear SVM by extending the approach for linear SVM. The information provided by the SASI features is complementary to the information from the HOGedge features. we use a late fusion technique named SVM-Meta Fusion.
IV.EXPERIMENTAL RESULTS
A. Evaluation Data
To quantitatively evaluate the proposed algorithm, and to compare it to related work, we considered two datasets. One consists of images that we captured ourselves, while the second one contains images collected from the internet. Additionally, validated the quality of the forgeries using a human study on the first dataset. Human
performance can be seen as a baseline for our experiments. 1.DSO-1:This is our first dataset and it was created by ourselves. It is composed of 100 indoor and outdoor images with an image resolution of . Out of this set of images, 100 are original, have no adjustments whatsoever, and 100 are forged. The forgeries were created by adding one or more individuals in a source image that already contained one or more persons.
2. DSI-1:This is our second dataset and it is composed of 50images (25 original and 25 doctored downloaded fromdifferent websites in the Internet with different resolutions5. Figure 6. depicts example image from our databases.
B. Results
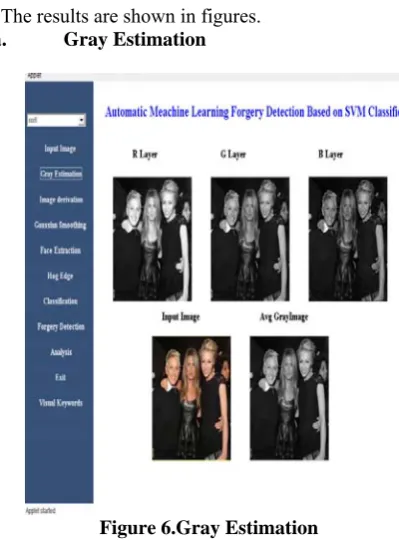
The results are shown in figures. a. Gray Estimation
Figure 6.Gray Estimation
Figure . 6 shows the gray estimation of the particular input image which is for classification .
b. Image Deviation
c. Gaussian smoothing
Figure 8. Gaussian Smoothing
Figure 8 shows the Gaussian smoothing of the input image.
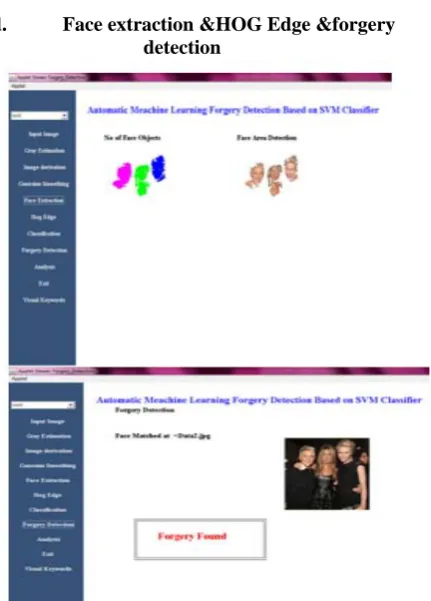
d. Face extraction &HOG Edge &forgery detection
Figure .9 Face extraction &HOG Edge &forgery detection
Figure .9 shows the extracted faces from the input image and the classified forgery image .
V.CONCLUSION AND FUTURE WORK
In this work, we presented a new method for detecting forged images of people using the illuminant color. We estimate the illuminant color using a statistical gray edge method and a physics-based method which exploits the inverse intensity-chromaticity color space. We treat these illuminant maps as texture maps. We also extract information on the distribution of edges on these maps.In order to describe the edge information, we propose a new
algorithm based on edge-points and the HOG provided by cross-database experiment. descriptor, called HOGedge. We combine these complementary cues (texture- and edge-based) using machine learning late fusion. Additionally, it is a significant advancement in the exploitation of illuminant color as a forensic cue. Prior color-based work either assumes complex user interaction or imposes very limiting assumptions.
In future work Reasonably effective skin detection methods have been presented in the computer vision literature in the past years. Incorporating such techniques can further expand the applicability of our method. Such an improvement could be employed, for instance, in detecting pornography compositions which, according to forensic practitioners, have become increasingly common now a days.
REFERENCES
[1] A.Rocha,W.Scheirer,T.E.Boult,andS.Goldenstein,“Vision of the unseen: Current trends and challenges in digital image and video forensics,” ACM Comput. Surveys, vol. 43, pp. 1–42, 2011. [2] C. Riess and E. Angelopoulou, “Scene illumination as an indicator of
image manipulation,” Inf. Hiding , vol. 6387, pp. 66–80, 2010. [3] H. Farid and M. J. Bravo, “Image forensic analyses that elude the
human visual system,” inProc. Symp. Electron. Imaging (SPIE), 2010, pp. 1–10
[4] Y. Ostrovsky, P. Cavanagh, and P. Sinha, “Perceiving illumination in-consistencies in scenes,”Perception, vol. 34, no. 11, pp. 1301– 1314,2005.
[5] H. Farid, A 3-D lighting and shadow analysis of the JFK Zapruder fi lm (Frame 317), Dartmouth College, Tech. Rep. TR2010–677, 2010. [6] M. Johnson and H. Farid, “Exposing digital forgeries by detecting
in-consistencies in lighting,” in Proc. ACM Workshop on Multimedia and Security, New York, NY, USA, 2005, pp. 1–10. [7] M.JohnsonandH.Farid,“Exposing digital forgeries in complex
lighting environments,” IEEE Trans. Inf. Forensics Security ,vol.3,no. 2, pp. 450–461, Jun. 2007.
[8] M. Johnson and H. Farid, “Exposing digital forgeries through specular highlights on the eye,” in Proc. Int. Workshop on Inform. Hiding, 2007,pp. 311–325.
[9] E. Kee and H. Farid, “Exposing digital forgeries from 3-D lighting en-vironments,” in Proc. IEEE Int. Workshop on Inform. Forensics and Security (WIFS) , Dec. 2010, pp. 1–6.
[10] W. Fan, K. Wang, F. Cayre, and Z. Xiong, “3D lighting-based image forgery detection using shape-from-shading,” in Proc. Eur. Signal Pro-cessing Conf. (EUSIPCO) , Aug. 2012, pp. 1777–1781. [11] J. F. O’Brien and H. Farid, “Exposing photo manipulation with
incon-sistent re fl ections,” ACM Trans. Graphics , vol. 31, no. 1, pp. 1–11, Jan.2012.
[12] S. Gholap and P. K. Bora, “Illuminant colour based image forensics,” in Proc. IEEE Region 10 Conf., 2008, pp. 1–5.
[13] X. Wu and Z. Fang, “Image splicing detection using illuminant color in-consistency,” in Proc. IEEE Int. Conf. Multimedia Inform. Networking and Security, Nov. 2011, pp. 600–603.
[14] P. Saboia, T. Carvalho, and A. Rocha, “Eye specular highlights telltales for digital forensics: A mach ine learning ap proach,” in Proc. IEEE Int. Conf. Image Processing (ICIP), 2011, pp. 1937– 1940.
[15] C. Riess and E. Angelopoulou, “Physics-based illuminant color esti-mation as an image semantics clue,” inProc. IEEE Int. Conf. Image Processing, Nov. 2009, pp. 689–692.
[16] K. Barnard, V. Cardei, and B. Funt, “A comparison of computational color constancy algorithms–Part I: Methodology and Experiments With Synthesized Data,”IEEE Trans. Image Process. ,vol.11,no.9, pp. 972–983, Sep. 2002.