University of Windsor University of Windsor
Scholarship at UWindsor
Scholarship at UWindsor
Electronic Theses and Dissertations Theses, Dissertations, and Major Papers
2018
Multinuclear Solid-State NMR Investigation of Structure,
Multinuclear Solid-State NMR Investigation of Structure,
Dynamics, and Formation of Porous Materials
Dynamics, and Formation of Porous Materials
Christopher Andrew O'Keefe University of Windsor
Follow this and additional works at: https://scholar.uwindsor.ca/etd
Recommended Citation Recommended Citation
O'Keefe, Christopher Andrew, "Multinuclear Solid-State NMR Investigation of Structure, Dynamics, and Formation of Porous Materials" (2018). Electronic Theses and Dissertations. 7387.
https://scholar.uwindsor.ca/etd/7387
This online database contains the full-text of PhD dissertations and Masters’ theses of University of Windsor students from 1954 forward. These documents are made available for personal study and research purposes only, in accordance with the Canadian Copyright Act and the Creative Commons license—CC BY-NC-ND (Attribution, Non-Commercial, No Derivative Works). Under this license, works must always be attributed to the copyright holder (original author), cannot be used for any commercial purposes, and may not be altered. Any other use would require the permission of the copyright holder. Students may inquire about withdrawing their dissertation and/or thesis from this database. For additional inquiries, please contact the repository administrator via email
Multinuclear Solid-State NMR Investigation of Structure, Dynamics, and Formation of Porous Materials
By
Christopher Andrew O’Keefe
A Dissertation
Submitted to the Faculty of Graduate Studies through the Department of Chemistry and Biochemistry
in Partial Fulfillment of the Requirements for the Degree of Doctor of Philosophy
at the University of Windsor
Windsor, Ontario, Canada
2018
Multinuclear Solid-State NMR Investigation of Structure, Dynamics, and Formation of Porous Materials
by
Christopher Andrew O’Keefe
APPROVED BY:
______________________________________________ J. Reimer, External Examiner
University of California – Berkeley
______________________________________________ R. Caron
Department of Mathematics and Statistics
______________________________________________ S. Loeb
Department of Chemistry and Biochemistry
______________________________________________ J. Wang
Department of Chemistry and Biochemistry
______________________________________________ R. Schurko, Advisor
Department of Chemistry and Biochemistry
iii
Declaration of Co-authorship/Previous Publications
I. Co-Authorship
I hereby declare that this thesis incorporates material thatis result of joint research, as follows:
I am the primary author on two of the publications that have results, or will result from the work outlined in this thesis. I acknowledge my supervisor, Dr. Robert Schurko, as a co-author in this work and provided contributions to the writing and editing of this thesis
Chapter 2 “NMR-Assisted Powder X-Ray Diffraction for the Structural Characterization of a Zeolitic Imidazolate Framework Synthesized via Accelerated Aging Reactions” includes contributions from Dr. Cristina Mottillo who conducted the PXRD experiments and the initial syntheses. I assisted in the synthesis of the materials, collected and
processed all SSNMR spectra and composed all sections of the unpublished manuscript relating to these experiments.
Chapter 3 “Monitoring the Formation of Cadmium-Containing Zeolitic Imidazolate Frameworks using a Combination of Powder X-ray Diffraction and Multinuclear Solid-State NMR” I am the primary author of this manuscript that is in preparation for publication. I acknowledge contributions from Dr. Cristina Mottillo for guidance in the initial mechanochemical reactions and Jacqueline Gemus for assisting with synthesis and the collection of SSNMR data. I conducted the majority of the SSNMR and PXRD experiments.
iv
Kris Harris aided in the simulation of the SSNMR data. Dr. Victor Terskikh at the National Ultrahigh-Field NMR Facility for Solids acquired SSNMR data at 21.1 T.
Chapter 5 “Multinuclear Solid-State NMR Investigations of Platinum(II) trans-Dihydride Molecular Rotors” Samples were synthesized and provided by Dr. Ernest Prack and Dr. Ulrich Fekl from the University of Toronto at Mississauga and Dr. Salvador Conejero from the University of Seville, Spain. Dr. Jeremy Moore conducted the low temperature 2H SSNMR experiments, under the supervision of Dr. Conradi. A. Lai, A Lough, and Dr.
P. M. MacDonald provided guidance in the interpretation of NMR data. Dr. Prack determined the energy landscape using DFT calculations. I acquired higher temperature 2H SSNMR data, processed and simulated all NMR data and assisted in writing the
manuscript.
Chapter 6 “An investigation of chlorine ligands in transition-metal complexes via 35Cl SSNMR and DFT calculations” I acquired and processed all 35Cl SSNMR and NQR data, and performed the CASTEP DFT calculations. Dr. Karen Johnston from Windsor
assisted with the interpretation of the NMR data and in editing the manuscript. Dr. Jochen Autschbach and K. Sutter at the State University of New York at Buffalo conducted the NLMO and NBO calculations. Dr. R. Gauvin, Dr. N Popoff and Dr. M. Taoufik
synthesized the surface supported materials and Dr. L. Delevoy and Dr. J. Trébosc
acquired the 35Cl SSNMR spectrum. Dr. Outdatchin from the NRC performed the PXRD experiments.
I am aware of the University of Windsor Senate Policy on Authorship and I certify that I have properly acknowledged the contribution of other researchers to my thesis, and have obtained written permission from each of the co-author(s) to include the above material(s) in my thesis.
I certify that, with the above qualification, this thesis, and the research to which it refers, is the product of my own work.
v
This thesis includes 6 original papers that have been previously published/submitted for publication in peer reviewed journals, as follows:
Thesis Chapter Publication title/full citation Publication status* Chapter 4 Vukotic, V. N., O’Keefe, C. A., Zhu,
K., Harris, K. J., To, C., Schurko, R. W., Loeb, S. J., Mechanically Interlocked Linkers Inside Metal-Organic Frameworks: Effect of Ring Size on Rotational Dynamics, J. Am. Chem. Soc., 2015, 137, 9643-9651
Published
Chapter 4 Zhu, K., O’Keefe, C. A., Vukotic, V. N., Schurko, R. W., Loeb, S. J., A Molecular Shuttle that Operates Inside a Metal-Organic Framework, Nat. Chem.,
2015, 7, 514-519
Published
Chapter 4 Zhu, K., Vukotic, V. N., O’Keefe, C. A., Schurko, R. W., Loeb, S. J. Metal-Organic Frameworks with Mechanically Interlocked Pillars: Controlling Ring Dynamics in the Solid State via a Reversible Phase Change, J. Am. Chem. Soc., 2014, 136, 7403-7409
Published
Chapter 5 Prack, E., O’Keefe, C. A., Moore, J. K., Lai, A., Lough, A. J., Macdonald, P. M., Conradi, M. S., Schurko, R. W., Fekl, U., A Molecular Rotor Possessing a H-M-H “Spoke” on a P-M-P “Axle”: a Platinum(II) trans-Dihydride Spins Rapidly Even at 75 K, J. Am. Chem. Soc., 2015, 137, 13464-13467
vi
Chapter 6 O’Keefe, C. A., Johnston, K. E., Sutter, K., Autschbach, J., Gauvin, R., Trébosc, J., Delevoye, L., Popoff, N., Taoufik, M., Oudatchin, K., Schurko, R. W. An Investigation of Chlorine Ligands in Transition-Metal Complexes via 35Cl Solid-State NMR and Density
Functional Theory Calculations, Inorg. Chem., 2014, 53, 9581-9597
Published
I certify that I have obtained a written permission from the copyright owner(s) to include the above published material(s) in my thesis. I certify that the above material describes work completed during my registration as a graduate student at the University of Windsor.
III. General
I declare that, to the best of my knowledge, my thesis does not infringe upon anyone’s copyright nor violate any proprietary rights and that any ideas, techniques, quotations, or any other material from the work of other people included in my thesis, published or otherwise, are fully acknowledged in accordance with the standard referencing practices. Furthermore, to the extent that I have included copyrighted material that surpasses the bounds of fair dealing within the meaning of the Canada Copyright Act, I certify that I have obtained a written permission from the copyright owner(s) to include such material(s) in my thesis.
vii
Abstract
The work described herein demonstrates the utility of solid-state nuclear magnetic
resonance (SSNMR) spectroscopy for the characterization of molecular-level structure
and dynamics in porous materials, including the determination of the reaction pathways
involved in the formation of porous solids made via solid-state synthetic techniques, a
study of the motion of dynamic components of metal-organic frameworks (MOFs) that
are prototypes for future molecular machines, and the structural characterization of a
surface-supported catalyst.
In Chapters 2 and 3, accelerated aging and mechanochemical reactions are used to
synthesize cadmium-containing zeolitic imidazolate frameworks (ZIFs). These
techniques provide a means for clean and efficient syntheses of these materials; however,
little is known about the reaction kinetics and mechanisms underlying their production.
First, the structure of a new cadmium-imidazolate framework (CdIF) is determined using
a combination of powder X-ray diffraction (PXRD) and SSNMR, a methodology known
as NMR-assisted crystallography. SSNMR experiments are also used to monitor the
formation of ZIFs made using mechanochemical synthesis, providing information on the
intermediates and products of the reactions. It is revealed that the initial
mechanochemical ball milling provides the activation energy for the formation of ZIFs,
but aging reactions within the milling jars drive the reaction to completion. As
demonstrated here, milling times as short as five seconds provide enough energy for the
initiation of the reactions, allowing for extremely low-energy synthesis of these materials.
In Chapter 4, series of metal-organic frameworks (MOFs) with dynamic,
viii
motion of the rings. It is demonstrated that the size of the rings and the framework
structure affect the motion. 13C variable temperature SSNMR is used to confirm the
shuttling motion of rings between recognition sites on an axle that is incorporated into a
MOF. Next, a study on a series of simple inorganic molecular rotors is described. It is
shown that some of these compounds act as rotors with very low energy barriers that
exhibit random rotational dynamics at temperatures below 75 K, while other structurally
similar compounds do not display any motions over a wide range of temperatures. It is
posited that steric and electronic effects from the coordinating ligands are responsible for
the observed dynamics. 2H SSNMR is shown to be essential for classifying and
understanding the dynamics of these low-energy molecular rotors
Finally, 35Cl SSNMR is used to elucidate the structure of a transition-metal
compound bound to the surface of a porous silica material. It is demonstrated that
ultra-wideline (UW) 35Cl SSNMR spectra for transition-metal complexes can be rapidly
acquired using a combination of high magnetic fields and specialized pulse sequences.
These spectra allow for the differentiation of different Cl bonding environments (i.e.,
bridging, terminal axial, and terminal equatorial). Density functional theory (DFT)
calculations and an accompany molecular-orbital analysis allow for an understanding of
the origin of the observed 35Cl electric field gradient (EFG) parameters, which influence
the 35Cl quadrupolar interactions. The structure of a surface-supported complex is then
proposed, demonstrating the applicability of these techniques to the study of very dilute
ix
Dedication
In memory of:
Leonard N. Cohen
September 21st, 1934 – November 7th, 2016
and
Gordon E. Downie
February 6th, 1964 – October 17th, 2017
Ring the bells that still can ring,
Forget your perfect offering,
There is a crack, in everything,
That’s how the light gets in.
x
Acknowledgments
The completion of this thesis would not have been possible without the
contributions (scientific or otherwise) many people. For those whom I have failed to
mention, I offer my sincerest apologies.
First and foremost, I acknowledge my supervisor, Dr. Rob Schurko, for all the
guidance he has provided through these past years. I first met Rob in his Physical
Chemistry Class. The second time I met Rob was in the corridor of Essex Hall, where he
convinced me to abandon the Physics Department and join his research group. Despite
him (in)conveniently scheduling my orientation meeting at a time when he was in France
for a conference, he has always been available to provide guidance on projects. I have
had the opportunity to take several of his classes, and while his lectures can be
sleep-inducing at times, he teaches with the utmost passion and enthusiasm. He has laid the
foundation for my understanding of NMR and taught me to be an independent researcher.
Through his gruelling 3+ hour-long practice talks for conferences presentations, he has
taught me to present my ideas in a clear and succinct way. His rigorous editing of
manuscripts, consisting of at least six versions, has taught me the skill of scientific
writing; if the manifestation of this skill is not evident in this thesis, he is surely to blame.
Lastly, he is well-versed in a wide range of topics, and so casual conversation in the lab is
rarely dull. Working with Rob has been a truly rewarding experience, and for that, I am
grateful.
To all members of the Schurko research group past and present, you are all
thanked. A special thank you goes to Dr. Karen Johnston, who helped me develop as a
xi
training. Dr. Kris Harris is acknowledged for taking the time to teach me about dynamics
and NMR. The comic relief provided by Dr. Bryan Lucier certainly made the time in the
lab more enjoyable. Dr. Stanislav Veinberg is acknowledged for all his help in
troubleshooting spectrometer issues and his methodical approach to solving problems.
Dr. Sean Holmes is thanked for his suggestions in regard to DFT calculations
David Hirsh and his better half, Steph Kosnik, are thanked for keeping me sane
these past five years. The countless lunch-time gossip sessions and foggy nights at Sugar
House will always be remembered (or will they?). Cameron Vojvodin is graciously
thanked for agreeing to take over the coordination of Win.Chem. Austin Peach....is
thanked....for....I don’t know. I am certainly indebted to Jacqueline Gemus for all her
assistance and ideas on the mechanochem project. You were a great student and I hope
you learned something from me. Nathan Veinberg is thanked for being an easy target for
jokes. Thankfully, Lucas Foster has taken his place. Adam and Derek are thanked, even
though they don’t say much.
My “posse” is also thanked. I am very grateful to have met these friends and I
hope never lose contact with them, wherever we all end up. Habibi Manar, your dad jokes
are unparalleled, and you always know how to make light of any situation. Akhil, you
taught me that somehow, grad students can have expensive tastes. Gio, I rarely
understand what you’re saying, but I’m sure it makes sense in your head. A special thank
you goes out to pinche Pablo Bulit, your assistance with chemistry, Microsoft Word, and
life is greatly appreciated.
I would like to thank my committee members for agreeing to read this thesis, and
xii
acknowledged for his assistance in NMR experiments and Joe Lichaa is thanked for his
help with numerous computer/technical issues.
Last, but certainly not least, a special thank you goes to my parents, Chris and
Roseann, for all your love and support throughout my life. Now that I’ve submitted my
xiii
Table of Contents
Declaration of Co-authorship/Previous Publications ... iii
Abstract ... vii
Dedication ... ix
Acknowledgments ... x
List of Tables ... xx
List of Figures ... xxiv
List of Schemes ... xliv List of Abbreviations ... xlvi 1 Chapter 1: Introduction to NMR and Context of Research ... 1
1.1 Nuclear Magnetic Resonance Spectroscopy ... 1
1.2 NMR Interactions ... 3
1.2.1 The Zeeman Interaction ... 3
1.2.2 The Radiofrequency Interaction ... 6
1.2.3 The Magnetic Shielding/Chemical Shift Interaction ... 9
1.2.4 The Quadrupolar Interaction ... 13
1.2.5 Direct Dipolar Coupling ... 20
1.2.6 Indirect spin-spin Coupling (J-coupling) ... 21
1.3 Effects of Dynamics on SSNMR spectra ... 22
1.4 Acquisition Techniques ... 28
1.4.1 Magic-Angle Spinning (MAS) ... 29
xiv
1.4.3 Quadrupolar Echo ... 34
1.4.4 Carr-Purcell Meiboom-Gill (CPMG) Pulse Sequence ... 35
1.4.5 Wideband Uniform-Rate Smooth-Truncation (WURST)-CPMG ... 36
1.4.6 Frequency-Stepped Acquisition ... 37
1.5 Density Function Theory Calculations ... 38
1.6 Context of Research ... 39
1.6.1 Into the Void(s) ... 40
1.6.2 “There’s plenty of room at the bottom” ... 42
1.7 References ... 44
2 Chapter 2: NMR-Assisted Powder X-Ray Diffraction for the Structural Characterization of a Zeolitic Imidazolate Framework Synthesized via Accelerated Aging Reactions ... 54
2.1 Overview ... 54
2.2 Introduction ... 54
2.3 Experimental Details ... 59
2.3.1 Reagents ... 59
2.3.2 Accelerated Aging Reactions ... 59
2.3.3 Powder X-ray Diffraction ... 59
2.3.4 Solid-State NMR ... 59
2.3.5 1H-111Cd CP/MAS and CP static NMR ... 60
2.3.6 1H-14N BRAIN-CP/WURST-CPMG ... 61
2.3.7 Structure Refinement ... 62
2.4 Results and Discussion ... 62
2.4.1 Synthesis and Powder X-ray Diffraction ... 62
xv
2.4.3 Structural Refinement ... 73
2.5 Conclusions ... 74
2.6 References ... 76
3 Chapter 3: Monitoring the Formation of Cadmium-Containing Zeolitic Imidazolate Frameworks using a Combination of Powder X-ray Diffraction and Multinuclear Solid-State NMR ... 83
3.1 Overview ... 83
3.2 Introduction ... 84
3.3 Experimental Details ... 89
3.3.1 Starting Materials ... 89
3.3.2 Mechanochemical Synthesis ... 89
3.3.3 Synthesis of aCdM ... 90
3.3.4 Synthesis of CdIF-1 ... 90
3.3.5 SSNMR Experiments ... 91
3.3.6 1H-111Cd CP/MAS NMR ... 91
3.3.7 15N MAS SSNMR ... 92
3.3.8 Powder X-ray Diffraction (PXRD) ... 92
3.3.9 Void volume calculations ... 92
3.4 Results and discussion ... 93
3.4.1 General overview of syntheses ... 93
3.4.2 Reaction Set 1 (CdO + 2 eq. HMeIm, 4 mol% NH4NO3, 100 µL MeOH, room temperature). ... 95
xvi
3.4.4 Reaction 3 (CdO + 2 eq. HMeIm, 4 mol% NH4NO3, 100 µL MeOH, cryomilling)
101
3.4.5 PXRD Analysis of Reaction Set 1 ... 103
3.4.6 Reaction 4 (amorphous framework + HMeIm + 4 mol% NH4NO3 + 100 µL MeOH) 106 3.4.7 CdIF-1 ... 110
3.4.8 Identity of iCdM ... 112
3.4.9 Reaction pathways ... 114
3.4.10 Role of the salt ... 119
3.5 Conclusions ... 121
3.6 References ... 123
4 Chapter 4: Observing Dynamics in Metal-organic Frameworks with Mechanically Interlocked Components using Solid-state NMR Spectroscopy ... 129
4.1 Overview ... 129
4.2 Introduction ... 130
4.3 Experimental Details ... 136
4.3.1 Synthetic procedures ... 136
4.3.2 SSNMR Studies at 9.4 T ... 136
4.3.3 13C SSNMR at 21.1 T ... 138
4.4 Results and Discussion ... 139
4.4.1 UWDM-1 Series ... 142
4.4.2 UWDM-2. ... 154
4.4.3 a-UWDM-3 ... 157
4.4.4 β-UWDM-3 ... 161
xvii
4.4.6 UWDM-4 ... 173
4.5 Conclusions ... 180
4.6 References: ... 182
5 Chapter 5: Multinuclear Solid-State NMR Investigations of Platinum(II) trans-Dihydride Molecular Rotors ... 186
5.1 Overview ... 186
5.2 Introduction ... 187
5.3 Experimental Methodologies and Computational Details ... 190
5.3.1 Synthesis ... 190
5.3.2 195Pt SSNMR ... 191
5.3.3 Low-temperature 2H SSNMR ... 191
5.3.4 Variable-temperature 2H SSNMR Experiments at 9.4 T ... 192
5.3.5 Simulation of 2H SSNMR Data ... 193
5.3.6 Calculation of 195Pt CS and 2H EFG Tensor Parameters ... 193
5.3.7 DFT Calculations of Energy Landscapes ... 194
5.4 Results and Discussion ... 194
5.4.2 trans-D2Pt(P(NMe2)3)2 (2) ... 208
5.4.3 trans-D2Pt(P(Cy)3)2 (3) ... 211
5.4.4 trans-D2Pt(iPr)2 (4) ... 212
5.4.5 trans-DPt(iPr)2 (5) ... 213
5.5 Conclusions ... 216
5.6 References ... 218
6 Chapter 6: An Investigation of Chlorine Ligands in Transition-metal Complexes via 35Cl SSNMR and DFT Calculations ... 222
xviii
6.2 Introduction ... 223
6.3 Experimental and Computational Details ... 227
6.3.1 Sample Preparation ... 227
6.3.2 Synthesis of WCl6–SiO2 ... 227
6.3.3 Powder X-ray Diffraction (PXRD) ... 228
6.3.4 35Cl SSNMR Spectroscopy ... 228
6.3.5 35Cl NQR Spectroscopy ... 230
6.3.6 Plane-wave DFT Calculations ... 230
6.3.7 35Cl Natural Bond Orbital/Natural Local Molecular Orbital Analysis of NbCl 5 ... 231
6.4 Results and Discussion ... 232
6.4.1 Tungsten(VI) Chloride (WCl6) ... 237
6.4.2 Tetracholorotungsten(VI) oxide (WOCl4) and tetrachloromolybdenum(VI) oxide (MoOCl4) ... 244
6.4.3 Niobium(V) chloride (NbCl5) and tantalum(V) chloride (TaCl5) ... 250
6.4.4 35Cl Transverse Relaxation Time (T 2) measurements ... 255
6.4.5 LMO Analysis of the 35Cl EFG Tensors ... 258
6.4.6 35Cl SSNMR of WCl 6 supported on silica ... 263
6.5 Conclusions ... 265
6.6 References ... 268
7 Chapter 7: Conclusions and Future Outlook ... 273
7.1 General Overview ... 273
7.2 Solid-state Synthesis of Cadmium-imidazolate Frameworks ... 274
7.3 Future Work – Monitoring the Formation of Porous Materials ... 275
7.4 Dynamics of Molecular Machines ... 278
xix
7.6 Surface Supported Catalysts ... 283
7.7 Future Work – Ultra-wideline 35Cl SSNMR ... 283
8 Appendix A Supplementary Tables and Figures for Chapter 2 ... 288
9 Apendix B: Supplementary Tables and Figures for Chapter 3 ... 295
10 Appendix C Synthetic Information and Supplementary Tables and Figures for Chapter 4 ... 302
11 Apendix D Supporting Tables and Figures for Chapter 5 ... 314
12 Apendix E Supplementary Information for Chapter 6 ... 320
xx
List of Tables
Table 2.1: Experimentally measured cadmium chemical shift tensor parameters. ... 67
Table 3.1: Sample names and descriptions. ... 89
Table 3.2: Summary of the reagents and conditions used in the mechanochemical
syntheses. ... 93
Table 3.3: Experimentally measured 111Cd isotropic shifts, line widths, and J-coupling
constants. ... 97
Table 4.1: Rates and modes of motion used in the simulation of experimental VT 2H
SSNMR data for UWDM-1(22). ... 149
Table 4.2: Rates and modes of motion used in the simulation of experimental VT 2H
SSNMR data for UWDM-1(B24). ... 152
Table 4.3: Rates and modes of motion used in the simulations of experimental VT 2H
SSNMR data for UWDM-2 ... 156
Table 4.4: Rates and modes of motion used in the simulation of experimental VT 2H
SSNMR data for a-UWDM-3 ... 159
Table 4.5: Rates and modes of motion used in the simulation of experimental VT 2H
SSNMR data for a-UWDM-3 ... 162
Table 4.6: Rates and modes of motion used in the simulation of experimental VT 2H
SSNMR data for b-UWDM-3 ... 164
Table 4.7: Unit cell parameters for the UWDM-P MOF series. ... 166
Table 4.8: Rates and modes of motion used in the simulation of experimental VT 2H
xxi
Table 4.9: Rates and modes of motion used in the simulation of experimental VT 2H
SSNMR data for UWDM-P1d. ... 169
Table 4.10: Rates and modes of motion used in the simulation of experimental VT 2H
SSNMR data for UWDM-P2. ... 169
Table 4.11: Rates and modes of motion used in the simulation of experimental VT 2H
SSNMR data for UWDM-P2d. ... 169
Table 5.1: Calculated (DFT) and experimental platinum chemical shift (CS) tensor
parameters for 1. ... 196
Table 5.2: Calculated (DFT) and experimental 2H EFG tensor parameters. ... 200
Table 6.1: Experimentally measured 35Cl NMR parameters for transition metal chlorides.
... 233
Table 6.2: Experimental and calculated (using CASTEP) 35Cl EFG tensor parameters and
comparison of predicted NQR frequencies obtained from 35Cl SSNMR data to those
reported in literature. Calculation of the NMR parameters was completed both prior
to and post geometry optimization of the structure. ... 236
Table 6.3: LMO contributions to the 35Cl EFG tensors of the various chlorine
environments in NbCl5 ... 261
Table B1: 1H-111Cd CP/MAS NMR contact times and recycle delays ... 295
Table B2: Calculated pore volumes for the Zn and Cd ZIFs. ... 295
Table C1: Optimized recycle delays and 90° pulse lengths used in the acquisition of 2H
xxii
Table C2: Shuttling rates obtained from the simulation of solution-state 13C NMR data
for the [2]rotaxane made from A4 and CE4. ... 304
Table D1: Recycle delays used in the acquisition of VT 2H SSNMR spectra at 9.4 T .. 315
Table D2: Calculated hydrogen chemical shielding tensor parameters. ... 315
Table E1: Experimental times for the acquisition of 35Cl SSNMR spectra at 9.4 and 21.1
T. ... 323
Table E2: WURST-CPMG acquisition parameters for 35Cl SSNMR spectra acquired at
9.4 T for all samples. ... 325
Table E3: WURST-CPMG acquisition parameters for 35Cl SSNMR spectra acquired at
21.1 T for all samples. ... 326
Table E4: Pseudopotential information for CASTEP calculations. ... 327
Table E5: Pre- and post-geometry optimization bond lengths. ... 328
Table E6: Initial and post-optimization atomic forces in the structures. ... 329
Table E7: Calculated (using CASTEP) 35Cl CS tensor parameters. Calculation of the
NMR parameters was completed both prior to and post geometry optimization of the
structure. ... 334
Table E8: T2 measurements made by placing the transmitter on each of the
discontinuities of the 35Cl SSNMR powder patterns. ... 335
Table E9: Structural parameters of (NbCl5)2. Selected averaged XRD and optimized
(OPT)a bond distances (Å) and bond angles (°). ... 336
Table E10:Comparison of experimental (EXP) and calculated 35Cl EFG tensor
xxiii
NbCl5, as well as ADF calculations performed on non-optimized crystal structures
(XRD). ... 336
Table E11: LMO contributions to the V33 component of equatorial (eq), bridging (br) and
axial (ax) chlorides in the complex (NbCl5)2. All values are in au. ... 337
xxiv
List of Figures
Figure 1.1: The effect of the Zeeman interaction on the energy levels for a spin-1/2
nucleus. The originally degenerate energy levels are split into two equally spaced
energy levels when placed in an external magnetic field. ... 5
Figure 1.2: Vector representation of the effect of a radiofrequency pulse on the bulk
magnetization. The coordinate system is a rotating reference frame that rotates about
the direction of the external magnetic field at the transmitter frequency, ωrf. A rf
pulse is applied along the x′-axis for a duration that tips the angle along the –y'-axis.
After the pulse is turned off, the magnetization begins to precess about the z-axis ... 8
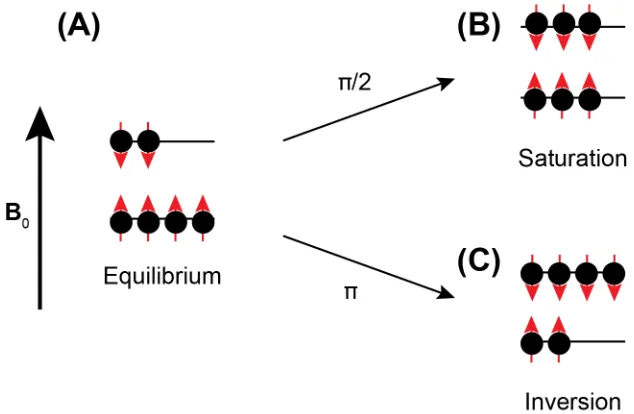
Figure 1.3: Schematic representation of the populations of spins at equilibrium (A). The
application of π/2 and π pulses create the conditions of (B) saturation and (C)
inversion, respectively. ... 9
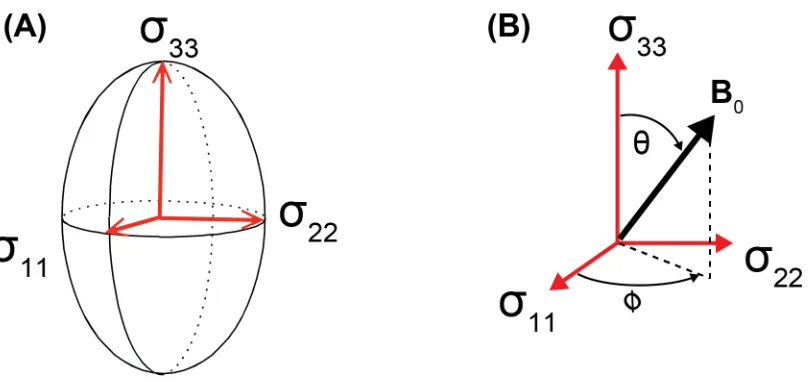
Figure 1.4: (A) Schematic representation of the MS tensor in its principal axis system
(PAS) using an ellipsoid as a visual aid. The magnitudes of the components are σ11 ≤
σ22 ≤ σ33. (B) Angles θ and φ describe the relative orientations of B0 and the MS
tensor in its PAS. ... 11
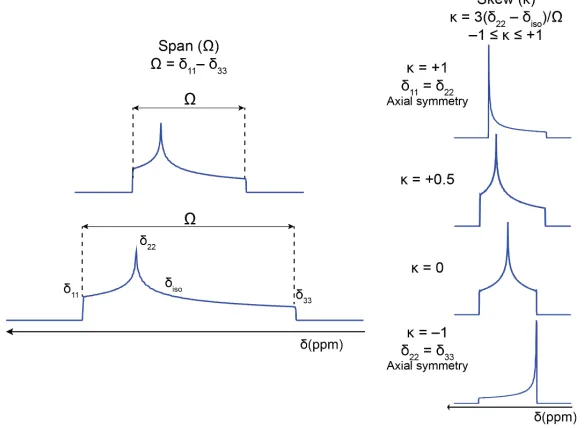
Figure 1.5: Simulated CSA powder patterns showing the effects of the (A) span (Ω) and
(B) skew (κ) on the appearance of the spectra ... 12
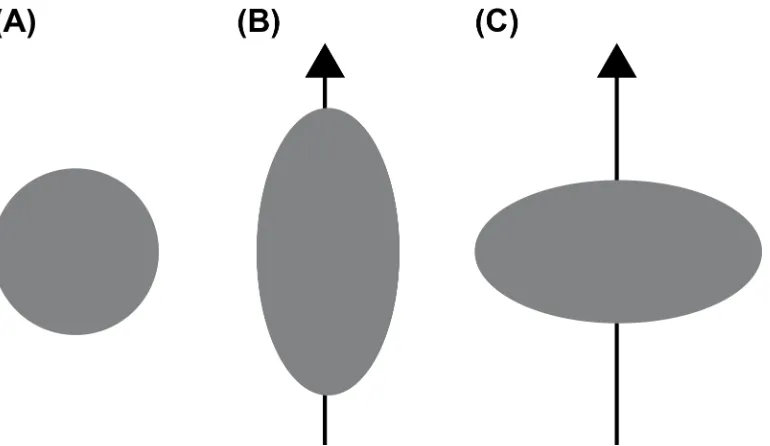
Figure 1.6: Schematic representation of the distribution of nuclear charge in a (A)
spin-1/2 (Q = 0, spherical), (B) quadrupolar (Q > 0, prolate), and (C) quadrupolar (Q < 0,
oblate) nuclides. ... 13
Figure 1.7: The relationship between the absolute magnitudes of CQ and the spherical
xxv
oxides, as described by Koller et al. As the degree of spherical symmetry increases,
the magnitude of CQ decreases. Adapted from ref. 28. ... 14
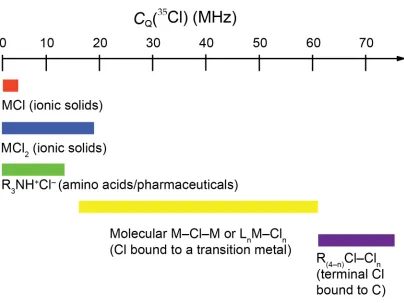
Figure 1.8: Relationships between the Cl bonding environment and typical magnitudes of
CQ(35Cl). ... 16
Figure 1.9: Perturbation of the Zeeman energy levels by the first- and second-order
quadrupolar interactions for a (A) spin-3/2 nuclide (e.g., 35Cl) and (b) spin-1 nuclide
(e.g., 2H). The first-order quadrupolar interaction (FOQI) does not influence the
central transition (CT, shown in red) but influences the satellite transitions (ST) to a
great extent ... 18
Figure 1.10: Simulated central-transition second-order quadrupolar spectra for a spin-3/2
nucleus with (A) ηQ = 0 and values of CQ ranging from 15 to 35 MHz and (B) CQ =
25 MHz and ηQ values ranging from 0.2 to 1.0. ... 19
Figure 1.11: Appearance of a powder pattern in the spectrum of a spin-1 nuclide; such
patterns are referred to as Pake doublets. Also shown are the frequency separations
of the “horn”, “shoulder”, and “foot” discontinuities. ... 20
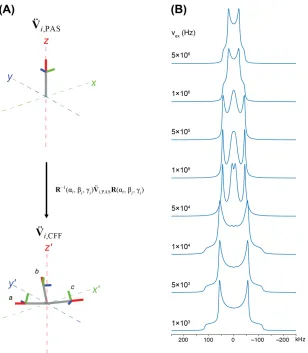
Figure 1.12: (A) A depiction of the rotation of a 2H EFG tensor in its principal axis
system (PAS) into the three sites of a CD3 group in the crystallite-fixed frame
(CFF). The z-axis of the CFF is coincident with the C3 rotation axis of the CD3
group. (B) Simulated 2H SSNMR spectra for the three-fold rotation of the CD3
groups with different exchange rates (νex). ... 29
Figure 1.13: Schematic representation of the orientation of an NMR rotor with respect to
the external magnetic field (B0). θR is the experimentally adjusted angle between the
xxvi
ellipsoid represents an interaction tensor whose largest component is oriented at
angles β with resepct to the rotor axis and θ with respect to B0. ... 31
Figure 1.14: Diagrams depicting the (A) cross-polarization (CP), (B) quadrupolar echo
(QE), and (C) Carr-Purcell-Meiboom-Gill (CPMG) pulse sequences. ... 34
Figure 1.15 : The (A) amplitude and (B) phase profiles of the WURST pulse. ... 36
Figure 1.16: The acquisition of a 35Cl SSNMR spectrum using the variable offset
cumulative spectra (VOCS) technique. WURST-CPMG spectra were acquired with
100 kHz increments of the transmitter frequency. ... 38
Figure 2.1: Experimental PXRD patterns for (A) 1:2 reaction aged for 12 days, (B) 1:2
reaction with NH4NO3 aged for 7 days, (C) 1:6 reaction with NH4NO3 aged for 6
days, (D) 1:6 reaction with NH4NO3 aged for 6 days, and (E) CdO. ... 63
Figure 2.2: Experimental 1H-111Cd CP NMR spectra acquired under MAS (blue traces)
and static (black traces) conditions, with accompanying simulations of the static
spectra (red traces) for (A) dia-Cd[Im]2 (2), (B) yqt1-Cd[MeIm]2 (3), and (C)
[Cd(HIm)6]2+[CO3]2– • 3H2O (4). ... 68
Figure 2.3: Experimental 1H-111Cd CP NMR spectra under (A) MAS (νrot = 5 kHz) and
(B) static conditions for compound 1, with an accompanying simulation of the static
spectrum in (C). ... 70
Figure 2.4: (A) 1H-13C CP MAS spectra of bulk HMeIm (green trace) and 1 (blue trace),
(B) 1H MAS spectrum of 1 and (C) 1H-14N BRAIN-CP/WURST-CPMG spectra of
xxvii
Figure 2.5:Depictions (adapted from the predicted crystal structure of 1) of (A) the
coordination environment about the Cd atoms, and (B) a supercell showing the pores
containing the HMeIm molecules (hydrogen atoms have been omitted for clarity). 72
Figure 3.1. 1H-111Cd CP/MAS NMR spectra (νrot = 5 kHz) of the products of 1 (CdO + 2
eq. HMeIm + 4 mol% NH4NO3 + 100 µL MeOH) milled for different time periods.
... 95
Figure 3.2: 1H-111Cd CP/MAS NMR spectra (νrot = 5 kHz) for the products of the
mechanochemical reaction between CdO, 2 eq. HMeIm, and 4 mol% NH4NO3 using
(A) 25 µL, (B) 50 µL, and (C) 100 µL of MeOH solvent. The reactions were milled
for five minutes. ... 99
Figure 3.3:1H-111Cd CP/MAS NMR spectra (νrot = 5 kHz) of the products of 2 (CdO + 2
eq. HMeIm + 4 mol% NH4NO3 + 50 µL MeOH) milled for different time periods.
... 100
Figure 3.4: 1H-111Cd CP/MAS NMR (νrot = 5 kHz) spectra for the products of 3 (CdO + 2
eq. HMeIm + 4 mol% NH4NO3 + 100 µL MeOH, 77 K). The spectra were acquired
at different time intervals, as noted by the superscript on the reaction number (the
spectra are non-cumulative). ... 102
Figure 3.5: (A) Experimental PXRD patterns for the products of 1 milled for different
time periods. Simulated PXRD patterns for (B) CdO, (C) HMeIm, (D) CdIF-1, (E)
dCdM, and (F) yCdM. ... 104
Figure 3.6: Experimental PXRD patterns for (A) 125m, (B) 125m-a1h, (C) 15s, (D) 15s-a1d.
xxviii
Figure 3.7: 1H-111Cd CP/MAS NMR spectra of (A) yCdM obtained from
mechanochemical synthesis and (B) the aCdM obtained by milling a dried sample
of yCdM for three hours. ... 108
Figure 3.8: 1H-111Cd CP/MAS NMR spectra (νrot = 5 kHz) for 4 (aCdM + HMeIm + 4
mol% NH4NO3 + 100 µL MeOH) acquired at different time intervals (the spectra are
non-cumulative). ... 109
Figure 3.9: 1H-111Cd CP/MAS NMR spectra (νrot = 5 kHz) for (A) CdIF-1as, (B) ... 111
Figure 3.10: (A) Unit cell of CdIF-1 with the 002 lattice planes shown in red. ... 115
Figure 3.11:1H-111Cd CP/MAS NMR spectra (νrot = 5 kHz) of the products 1 conducted
with (A) no salt, and (B) the addition of 4 mol% of NH4NO3. ... 119
Figure 3.12: 15N DP MAS NMR spectra of (A) 15NH4 15NO3 and (B) 130m. ... 121
Figure 4.1: General procedure for the synthesis of metal-organic frameworks with
dynamic interlocked components. First, a [2]rotaxane is made from an organic axle
molecule and a crown ether macrocycle. The [2]rotaxane is combined with an
organic linker and a metal source to form the MOF. ... 132
Figure 4.2: (A) Experimental VT 2H SSNMR powder patterns of UWDM-1(24), (B)
simulated 2H SSNMR powder patterns and, (C) accompanying depictions of the
motional models used for the (i) motions that are too slow to influence the
appearance of the Pake doublet (i.e., in the SML), (ii) the two-site jump with β =
77°, (iii) the two-site jump with β = 60° combined with partial rotation of the ring
over 225° in 45° steps, and (iv) two-site jumps of 70° combined with full rotation of
xxix
Figure 4.3: (A) Ball-and-stick representation of the [2]rotaxane ligand in UWDM-1(22),
which is composed of A1 and CE2 and coordinated to SBU1 (colour key: C = black,
O = red, N = blue, Cu = green. Hydrogen atoms are omitted for clarity). (B) View
down the crystallographic c-axis of UWDM-1(22) depicting the hexagonal shaped
channels (A1 shown in blue, CE2 in red, and Cu2+ metal ions in green). It is noted
that UWDM 1(B24) has the same structure, but with CE3 rings. ... 147
Figure 4.4: (A) Experimental VT 2H SSNMR powder patterns for UWDM-1(22), (B)
simulated 2H SSNMR powder patterns, and (C) accompanying depictions of the
motional models used for the (i) motions that are too slow to influence the
appearance of the Pake doublet (i.e., in the SML), (ii) two-site jumps with β = 65°
and rates in the FML, (iii) two-site jumps combined with the onset of partial rotation
of the ring over 250° in 50° steps, and (iv) two-site jumps and partial rotation with
rates in the FML. ... 148
Figure 4.5: (A) Experimental VT 2H SSNMR powder patterns for UWDM-1(B24), (B)
simulated 2H SSNMR powder patterns, and (C) accompanying depictions of the
motional model used for the (i) motions that are occurring too slowly to influence
the appearance of the Pake doublet (i.e., in the SML), (ii) two-site jumps with β =
60°, (iii) two-site jumps with β = 70°, and (iv) two-site jumps with β = 75°. ... 151
Figure 4.6: (A) Ball-and-stick representation of UWDM-2 showing the three-fold
interpenetration (colour key: A2 = blue, CE1 = red, L1 = yellow). (B) Ball-and-stick
representations showing the proximity of the rings (red) to one another and to the
xxx
Figure 4.7: (A) Experimental VT 2H SSNMR powder patterns for UWDM-2. (B)
Simulated 2H SSNMR powder patterns using the two-site jump (β = 72(2)°) and
partial rotation models. Rates used in the simulations are listed in Table 4.3. (C)
Depiction of the motional model used. ... 157
Figure 4.8: (A) Ball-and-stick representation of α-UWDM-3 showing the two-fold
interpenetration (colour key: A2 = blue, CE1 = red, L2 = yellow). (B) Ball-and-stick
representations showing the confinement of the CE1 ring (red) within the “square
plane” of the framework (green). (C) Schematic depiction of the reversible phase
change that occurs in UWDM-3. ... 158
Figure 4.9: (A) Experimental VT 2H SSNMR powder patterns for α-UWDM-3. (B)
Simulated 2H SSNMR powder patterns and (C) accompanying depictions of the
motional model used for the (i) motions that are occurring too slowly to influence
the appearance of the Pake doublet (i.e., in the SML), (ii) two-site jump with β =
75(2)°, (iii) two-site jump with β = 75(2)° combined with the onset of partial
rotation of the ring over 225° in 45° steps and (iv) two-site jump and partial rotation
combined with large amplitude ring flexing to positions 30(3)° above and below the
“square plane” of the framework, and (v) the FML of all the above-mentioned
motions. ... 160
Figure 4.10: (A) Experimental VT 2H SSNMR powder patterns for β-UWDM-3. (B)
Simulated 2H SSNMR powder patterns and (C) accompanying depictions of the
motional model used for the (i) motions that are too slow to influence the
appearance of the Pake doublet (i.e., in the SML), (ii) two-site jump with β = 75(2)°,
xxxi
ring over 225° in 45° steps, (iv) two-site jumps combined with partial rotation and
jumps through the alkyl portion of the ring that are occurring at a rate slower than
the rate of jumps between oxygen atoms, and (v) increased rate of jumps through the
alkyl portion of the ring. ... 163
Figure 4.11: Crystal structures showing the two-fold interpenetration of (A) UWDM-P1,
(B) UWDM-P2, and (C)UWDM-P2d. In each case, the CE1 macrocycles sit above
the square plane formed by the L3 ligands. It is noted that a crystal structure of
UWDM-P1d could not be determined, however; crystal lattice parameters were
obtained (Table 4.6). ... 166
Figure 4.12: (A) Experimental VT 2H SSNMR spectra for UWDM-P1 and corresponding
simulations showing the (i) SML, (ii) onset of the two-site jump (β = 78°), (iii) FML
of the two-site jump and onset of partial rotation, and (iv) FML of the two-site jump
and partial rotation. (B) Experimental VT 2H SSNMR spectra for UWDM-P1d and
corresponding simulations showing the (i) SML, (ii) IMR for the two-site jump, (iii)
FML of the two-site jump, (iv) onset of partial rotation, and (v) FML of the two-site
jump and partial rotation. ... 167
Figure 4.13: (A) Experimental VT 2H SSNMR spectra for UWDM-P2 and corresponding
simulations showing the (i) SML, (ii) FML of the two-site jump (β = 78°) and the
onset of partial rotation, (iii) FML of the two-site jump and partial rotation, and (iv)
FML of the two-site jump and full rotation. (B) Experimental VT 2H SSNMR
spectra for UWDM-P2d and corresponding simulations showing the (i) SML, (ii)
xxxii
the onset of partial rotation, and (iv) FML of the two-site jump and partial rotation.
... 168
Figure 4.14: (A) Schematic diagram of the [2]rotaxane used in the synthesis of
UWDM-4. The positions of the 13C labels are marked with asterisks. (B) Depiction of the
interpenetration in UWDM-4 where the [2]rotaxanes serve as “crossbars” that join
together two lattices (green and yellow). (C) View along the crystallographic c axis
showing the open channels in the framework. ... 174
Figure 4.15: Variable temperature 1H-13C CP/MAS (νrot = 14.4 kHz) NMR spectra
acquired for UWDM-4 at 21.1 T. ... 176
Figure 4.16: 1H-13C CP/EXSY MAS NMR spectra (νrot = 14.4 kHz) acquired at 0 °C and
21.1 T using mixing times of (A) 1 ms, and (B) 100 ms. ... 177
Figure 4.17: The Eyring plot generated from the simulation of the VT 13C SSNMR data.
Rates used in the simulations and thermodynamic parameters extracted from the plot
are shown in Table 4.11 and Table 4.12, respectively. ... 179
Figure 5.1:(A) Platinum chemical shift, (B) 2H EFG, and (C) hydrogen chemical
shielding tensor orientations for 1 determined by DFT calculations. ... 197
Figure 5.2: Experimental 195Pt WURST-CPMG NMR spectra (blue) and accompanying
analytical simulations (red) for 1 acquired at (A) 133 K and (B) 298 K. The platinum
CS tensor parameters are shown in Table 5.1. The dashed lines indicate the relative
positions of δ22 (black) and δ33 (grey) ... 199
Figure 5.3: (A) VT 2H SSNMR spectra of 1-D acquired at 4.75 T. (B) Accompanying
simulations using the n:1:1 rotational model. The impurity peak that appears in the
xxxiii
Figure 5.4: (A) two-site, (B) three-site, (C) four-site, and (D) six-site rotation motional
models used in the simulation of the 2H SSNMR data. The red arrows in the
schematic pictures represent the positions of the largest principal component of the
2H EFG tensor (V33) which is collinear with the Pt–D bonds. ... 204
Figure 5.5: Simulated 2H SSNMR spectra for the (A) n:1:1, (B) n:n':1, and (C) n2:n':1
population models. The ratios represent the relative populations of the rotational
states (i.e., the populations of the 0°(180°):60°(240°):120°(300°) states). ... 206
Figure 5.6: (A) VT 2H SSNMR spectra of 1-D acquired at 9.4 T. (B) The accompanying
simulations using the n:1:1 rotational model. The simulations include the effects of
1H CSA. ... 207
Figure 5.7: The energy landscape for 1 as determined by DFT calculations. The hydride
positions were rotated about the P–Pt–P axis. Global minima are observed at H–Pt–
P–C torsion angles of 0° and 180° (hydrides eclipsed with the P-C9 bonds) and local
minima are observed at positions where the deuterides are eclipsed with the P–C1
and P-C5 bonds. ... 209
Figure 5.8: VT 2H SSNMR spectra acquired at 9.4 T for 2-D. A simulation of the
spectrum acqired at 273 K is shown as the red trace. The spectra do not change with
temperature indicating that the motion is in the SML. ... 210
Figure 5.9: VT 2H SSNMR spectra of 3-D acquired at 9.4 T. A simulation of the
spectrum acquired at 173 K is shown as the red trace. The spectra do not change
xxxiv
Figure 5.10: VT 2H SSNMR spectra of 4-D acquired at 9.4 T. An analytical simulation
of the spectrum acquired at 223 K is shown in red. The spectra do not change with
temperature, indicating that the moition is in the SML (see text for details). ... 214
Figure 5.11: (A) VT 2H SSNMR spectra of 5-D acquired at 9.4 T. (B) Accompanying
simulations using the four-site jump rotational model. ... 215
Figure 6.1: Comparison between the experimental and calculated values of (A) CQ and
(B) ηQ for all sites.All calculated values were obtained from 35Cl EFG tensor
calculations completed on geometry optimized structures using CASTEP. The
values of both CQ and ηQ for the pseudo-bridging chlorine sites in MoOCl4 were
omitted due to poor correlation between experiment and calculation. ... 238
Figure 6.2: Static 35Cl SSNMR spectra acquired using frequency-stepped
WURST-CPMG for (A) α-WCl6 at 21.1 T and (B) β-WCl6 at 9.4 T with corresponding
analytical simulations shown in red. (C) Hahn-echo experiments conducted on β
-WCl6at (i) the high and (ii) the low frequency discontinuities. ... 240
Figure 6.3: 35Cl NQR spectra for (A) α-WCl6 and (B) β-WCl6. The NQR frequencies
(νQNQR) for each of the sites are shown in the figure. The spectra were acquired with
a transmitter frequency of 10.52 MHz. ... 242
Figure 6.4: Theoretical 35Cl EFG tensor orientations in the molecular frames for (A) α
-WCl6and (B) β-WCl6, as determined from 35Cl EFG tensor calculations completed
on geometry-optimized structures using CASTEP. ... 244
Figure 6.5: Static 35Cl SSNMR spectra acquired at 21.1 T for (A) WOCl4 and (B)
xxxv
shown in red, while individual sites are shown in blue (Cl1), green (Cl2), black
(Cl3) and orange (Cl4). ... 246
Figure 6.6: Theoretical 35Cl EFG tensor orientations for (A) WOCl4 and (B) MoOCl4
with (i) the pseudo-bridging chlorine sites (Cl1), (ii) the terminal chlorine sites
opposite the pseudo-bridging sites (Cl2) and (iii) the terminal chlorine sites adjacent
to the pseudo-bridging chlorine sites (Cl3 and Cl4). All pictured orientations were
determined from 35Cl EFG tensor calculations completed on geometry-optimized
models using CASTEP. ... 248
Figure 6.7: Static 35Cl SSNMR spectra acquired at 21.1 T for (A) NbCl5 and (B) TaCl5.
Corresponding analytical simulations representative of the entire powder patterns
are shown in red and simulations of the individual sites are shown in blue (Clbr),
green (Clax), and orange (Cleq). ... 253
Figure 6.8: Theoretical 35Cl EFG tensor orientations in the molecular frame for the (A)
Clbr, (B) Cleq, and (C) Clax environments in NbCl5. Orientations were determined
from 35Cl EFG tensor calculations completed on geometry-optimized models using
CASTEP. Similar tensor orientations were found for the isostructural TaCl5
complex. ... 255
Figure 6.9: T2 relaxation time constants and corresponding CPMG echo trains from
experiments on α-WCl6 at (A) the high-frequency, (B) central and (C)
low-frequency discontinuities. ... 257
Figure 6.10: (A) Atom numbering of the Nb2Cl10 unit used in the LMO analysis. (B)
Isosurface representations of the LMOs (1) σ(Clax-Nb), (2) σ LP Clax, (3) πx LP Clax,
xxxvi
Clbr (with some µ-bonding character), (10) µ(Nb-Cl-Nb), (11) σ LP Clbr and (12) πz
LP Clbr. ... 260
Figure 6.11: Graphical representations (polar plots) of 35Cl EFG tensors of NbCl5 for (A)
Clax, (B) Cleq and (C) Clbr environments. The blue colour indicates a positive EFG
while orange indicates a negative EFG. The values of V33 are +0.71, +0.81 and –1.32
a.u., for (A) - (C) respectively. ... 262
Figure 6.12: Static 35Cl SSNMR spectrum acquired using the WURST-CPMG pulse
sequence at 18.8 T for WCl6–SiO2 with corresponding analytical simulation shown
in red. ... 265
Figure A1: Experimental PXRD patterns for (A) the dry-milled reaction mixture before
aging and (B) CdO. (C) Simulated PXRD pattern for HMeIm. ... 290
Figure A2: Experimental PXRD patterns for the products of the aging reaction treated
with either (NH4)2(SO4) after (A) one day and (B) seven days of aging, or
HCafHSO4 after (C) one day and (D) seven days of aging. Simulated PXRD patterns
from the crystal structures (E) 1 and (F) 3. ... 290
Figure A3: The coordination environment of the Cd atoms in dia-Cd[Im]2 (2). ... 291
Figure A4: Coordination environment about (A) the Cd1 site, (B) the Cd2 site and atom
labeling in thle yqt1-Cd[MeIm]2 (3) framework. There is an apparent positional
disorder of one of the MeIm– ligands at the Cd1 site. ... 291
Figure A5: Coordination environment about the Cd atom and atom labelling in the ... 292
Figure A6: 1H MAS (νrot = 16 kHz) NMR spectra acquired at 9.4 T for (A) framework
xxxvii
Figure A7: 1H-13C CP/MAS (νrot = 10 kHz) NMR spectra acquired at 9.4 T of (A)
framework 2, (B) framework 3, and (C) compound 4. The asterisks (*) denoted
spinning sidebands. ... 293
Figure A8: Proposed 111Cd isotropic chemical shift ranges based on the compounds
investigated herein and on studies conducted by Ellis et al. ... 293
Figure A9:1H-14N BRAIN-CP/WURST-CPMG spectrum of bulk HMeIm (blue trace)
and simulation of the powder pattern (red trace). A deconvolution of the simulation
into the two distinct powder patterns is also shown. The purple trace is the pattern
corresponding to the N1 site (CQ = 1.95(5) MHz, ηQ = 0.44(2)) and the green trace is
the ... 294
Figure B1: (A) 1H-111Cd CP/MAS NMR spectrum acquired for the products of 3 (twenty
minute acquisition time). (B) 111Cd NMR spectrum of the same sample acquired for
an additional twenty minutes (the two spectra are non-cumulative). ... 296
Figure B2:1H-111Cd CP NMR spectra acquired under static conditions (i.e., no sample
rotation) for products 3 at different time intervals (the spectra are non-cumulative).
... 297
Figure B3: Experimental PXRD patterns obtained for (A) 185m and (B) 125m-a1h. ... 298
Figure B4: Experimental PXRD pattern acquired for aCdM that was synthesized by
milling a sample of yCdM for three hours. The broad features confirm the
amorphous nature of this material. ... 299
Figure B5: (A) Experimental PXRD pattern obtained for CdIF-1. (B) Simulated PXRD
xxxviii
Figure B6: (A) Experimental PXRD pattern for CdIF-1HMeIm. (B) Simulated PXRD
pattern from the crystal structure of dCdM. ... 300
Figure B7: Comparison of the peak widths in the 111Cd NMR spectra of (A) CdIF-1dried,
(B) CdIF-1, and (C) 130s. Experimental spectra are shown in blue and the
corresponding simulations are shown as the red traces. ... 301
Figure C1: Simulation of a 2H SSNMR powder pattern showing the positions of the three
sets of discontinuities (horns, shoulders and feet) and their respective frequency
separations (Δν11, Δν22 and Δν33). Also shown are the relations between the positions
of the discontinuities and the quadrupolar parameters (CQ and ηQ). ... 304
Figure C2: (A) Orientation of the 2H EFG tensor for the deuterons in the alkyl region of
the macrocycles in the MOF systems. (B) Depiction of the two-site jump motional
model. The CH2 group jumps through an angle β about an axis that is in the plane of
the ring. (C) Simulated 2H powder patterns for this motional model simulated in the
FML with the corresponding values of β. The powder patterns were simulated using
a SML EFG tensor with CQ = 165 kHz and hQ = 0.0. ... 305
Figure C3: Simulated 2H SSNMR powder patterns for the two-site jump model with β =
77° using rates within the three motional regimes. Rates in the SML are considered
to be ≤103 Hz, IMR rates are between 103 and 107 Hz and FML rates are ≥107 Hz.
... 306
Figure C4: (A) Depiction of the partial rotation motional model. The V33 component of
the EFG tensor is depicted with the red arrows and jumps between n sites separated
by an angle γ. Jumps can only occur to adjacent sites. The sites that the deuteron can
xxxix
patterns for this motional model simulated in the FML as a function of the angles α
and γ and by considering six rotational steps. The powder patterns were simulated
using a SML EFG tensor with CQ = 165 kHz and ηQ = 0.0. It is noted that the
right-most column represents the special case of full rotation. ... 307
Figure C5: Simulated 2H powder patterns using various rates (k) for different two-site
jump angles (β). Simulations used a SML EFG tensor with CQ = 165 kHz and ηQ =
0.0... 308
Figure C6: Simulated 2H SSNMR powder patterns for a motional model consisting of
two-site jumps through an angle of 72° combined with partial rotation where the
ring jumps through an angle 225° in 45° steps. ... 309
Figure C7: (A) Schematic diagram showing the sites used in the simulation of
β-UWDM-3. The numbered positions correspond to the rotational sites (1-6 are sites
where the oxygen atoms on the ring form hydrogen bonds with the axle and sites 7
and 8 correspond to rotation through the alkyl portion of the ring). Sites a and b
correspond to the two positions in the two-site jump model where the CD2 groups
rotate about an axis in the plane of the ring. (B) Kinetic matrix used in the
simulation of the high-temperature data for β-UWDM-3. j is the rate constant for the
two-site jump motion, r is the rate constant for rotation between hydrogen-bonding
positions and a is the rate constant for rotation through the alkyl portion of the ring.
... 310
Figure C8: VT 2H SSNMR spectra of UWDM-P2 with (A) no solvent, or the addition of
(B) dimethylformamide, (C) mesitylene, (D) dioxane, (E) 1-butanol, (F) ethylene
xl
Figure C9: 19F MAS NMR spectra acquired for (A) UWDM-4 (νrot = 18 kHz) and (B)
UWDM-4•HBF4 (νrot = 9.5 kHz). The blue shaded region shows signal from the BF4
– anion, † denote signal from the Teflon spacers and caps, and * denote spinning
sidebands of the Teflon signal. ... 311
Figure C10: 1H-13C CP/MAS (νrot = 8 kHz) acquired at 9.4 T for neutral UWDM-4. The
resolution of these spectra is too low to observe chemical exchange. ... 312
Figure C11: (A) Solution-state VT 13C NMR data of the [2]rotaxane made from A4 and
CE4. (B) The Eyring plot is generated from the 13C NMR data and used to calculate
the thermodynamic parameters listed in Table 4.12. ... 313
Figure D1: Crystal structure of 1-H showing the disorder of the hydride ligands. Atom
numbering is shown for one of the phosphine ligands. ... 316
Figure D2: VT 195Pt SSNMR spectra for 1–H acquired at 4.75 T. The low S/N is due to
the long T1(195Pt) at low temperatures and the experiments being run without 1H
decoupling. The spectrum at 40 K was acquired with significantly more scans. ... 316
Figure D3: 2H SSNMR spectra acquired for 1-D at 120 K with different values of the
interpulse delay (τ). There are no appreciable differences in the spectra, indicating
that the motion is occurring with rates in the FML. ... 317
Figure D4: Simulations of the experimental 2H SSNMR for 1 pattern collected at 9.4 T
and 298 K using Ω = 60 and 13 ppm. The latter value was obtained from DFT
calculations. The dashed lines show the relative positions of the low-frequency
discontinuities. ... 318
Figure D5: View along the C–Pt–C rotation axis showing the relative positions of the
xli
Figure E1: Depections of the packing of atoms in the unit cell for α-WCl6 with views
along the crystallographic (A) a-axis, (B) b-axis, (C) c-axis and (D) [111] plane. 338
Figure E2: Depections of the packing of atoms in the unit cell for β-WCl6 with views
along the crystallographic (A) a-axis, (B) b-axis, (C) c-axis and (D) [111] plane. 339
Figure E3: Depections of the packing of atoms in the unit cell for WOCl4 with views
along the crystallographic (A) a-axis, (B) b-axis, (C) c-axis, and (D)the [111] plane.
... 339
Figure E4: Depections of the packing of atoms in a 2x2x2 supercell for MoOCl4 with
views along the crystallographic (A) a-axis, (B) b-axis, (C) c-axis, and (D) [111]
plane. ... 340
Figure E5: Depections of the packing of atoms in the unit cell for NbCl5 with views
along the crystallographic (A) a-axis, (B) b-axis, (C) c-axis, and (D) [111] plane. 340
Figure E6: Depections of the packing of atoms in the unit cell for TaCl5 with views
along the crystallographic (A) a-axis, (B) b-axis, (C) c-axis, and (D) [111] plane. 341
Figure E7: Experimental PXRD pattern for WCl6 shown as the black trace. Simulated
patterns for α-WCl6 (red trace) and β-WCl6 (blue trace). ... 341
Figure E8: Experimental (black trace) and simulated (red trace) PXRD patterns for
WOCl4. ... 342
Figure E9: Experimental (black trace) and simulated (red trace) PXRD patterns for
MoOCl4. ... 342
Figure E10: Experimental (black trace) and simulated (red trace) PXRD patterns for
xlii
Figure E11: Experimental (black trace) and simulated (red trace) PXRD patterns for
TaCl5. ... 343
Figure E12: Static 35Cl SSNMR spectrum of α-WCl6 acquired at 9.4 T with
corresponding analytical simulation (red trace). ... 344
Figure E13: Static 35Cl SSNMR powder pattern for WOCl4 acquired at 9.4 T and
corresponding analytical simulation (red trace). ... 344
Figure E14: Static 35Cl SSNMR powder pattern for MoOCl4 acquired at 9.4 T.
Analytical simulations for the individual sites are show in blue, green, black, and
orange. The red trace is an analytical simulation representative of the entire powder
pattern ... 345
Figure E15: Static 35Cl SSNMR powder pattern for NbCl5. Analytical simulations are
shown in blue (bridging), green (terminal axial), and orange (terminal equatorial).
The red trace is an analytical simulation representative of the entire powder pattern.
... 345
Figure E16: Static 35Cl SSNMR powder pattern for TaCl5. Analytical simulations are
shown in blue (bridging), green (terminal axial), and orange (terminal equatorial).
The red trace is an analytical simulation representative of the entire powder pattern.
... 346
Figure E17: Simulation of the 35Cl SSNMR powder pattern for the terminal-equatorial
site in NbCl5 including only the quadrupolar interaction (bottom trace) and both the
quadrupolar and CSA interactions (top trace). ... 346
Figure E18: Dative (Cl→Nb) bonds in NbCl5. Linear combinations of (A) (v+vi)/√2 and
xliii
Figure E19: Graphical representation of the EFG related to the spn set of hybrid orbitals
of Eq. (3). Electron configuration (spn1)2(spn2)1.8(spn3)1.8(spn4)2. Angle θ between
spn2 and spn3: 102°. The negative tensor component V33 (orange) is perpendicular to
the plane spanned by the directional vectors of the two bonding hybrids with
occupancy lower than two. ... 347
Figure E20: Analytical simulations of static 35Cl SSNMR spectra acquired at 18.8 T for
xliv
List of Schemes
Scheme 2.1: Proposed reaction pathways for the accelerated aging reactions of CdO and
HMeIm with different protic salts. For the reaction with NH4NO3, 1:2, 1:3, and 1:6
Cd:HMeIm ratios were used. ... 64
Scheme 3.1: General synthetic procedure for the mechanochemical formation of ZIFs
using cadmium oxide (CdO) and 2-methylimidazole (HMeIm) with the addition of a
catalytic amount of ammonium nitrate (NH4NO3) and a small amount of methanol
(MeOH) solvent. ... 94
Scheme 3.2: Mechanochemical reaction pathways for (A) ZnO + HMeIm forming (i) 116
Scheme 4.1: Representations of the secondary building units (SBUs) used in MOF
synthesis. (A) Cu paddlewheel (SBU1), (B) Zn paddlewheel (SBU2), and (C) Zn4O
cluster (SBU3). Colour key: C = black, O = red, N = blue, Cu = cyan, Zn = grey. 139
Scheme 4.2: Organic axle molecules for the rotaxanes used in the synthesis of (A)
UWDM-1 (A1), (B) UWDM-2, UWDM-3, UWDM-P1 (A2), (C) UWDM-P2 (A3),
and (D) UWDM-4 (A4). ... 140
Scheme 4.3: Schematic representation of the organic linkers used in the synthesis of
pillared or mixed-linker MOFs. (A) 1,4-diazophenyl-dicarboxylic acid (L1), (B)
1,4-biphenyl-dicarboxylic acid (L2), and (C) tetracarboxyphenyl-porphyrin-Pd2+ (L3).
... 140
Scheme 4.4: Schematic diagrams of the crown ether macrocyles used in the preparation
the rotaxanes. (A) [24]crown-6 (CE1), (B) [22]crown-6 (CE2), (C)
benzo[24]crown-6 (CE3), (D) [24]crown-8 (CE4). For the rings that were deuterated for dynamic
xlv
Scheme 5.1: Representations of the structures of (A) trans-H2Pt(PtBu3)2 (1), (B) trans
-H2Pt(P(NMe2)3)2 (2), (C) trans-D2Pt(PCy3)2 (3-D), (D) trans-D2Pt(iPr)2 (4), and (E)
[trans-HPt(iPr)2][BArF4] (5). For 1, 2, 4, and 5, ball-and-stick representations are
derived from the crystal structures, whereas for 3-D, no crystal structure has been
reported. Non-hydride hydrogen atoms and the [BArF4]– counterion have been
omitted for clarity. Colour key: H/D = pink, C = black, N = blue, P = orange, Pt =
grey. ... 190
Scheme 6.1: Schematic representations of (A) tungsten(VI) chloride (WCl6), (B)
tetrachlorotungsten(VI) oxide (WOCl4) and tetrachloromolybdenum(VI) oxide
(MoOCl4), (C) niobium(V) chloride (NbCl5) and tantalum(V) chloride (TaCl5). . 231
Scheme 6.2: Schematic representation of the different chlorine bonding environments in
the bridging pentahalide species. Bridging chlorine atoms (Clbr) are shown in blue,
xlvi
List of Abbreviations
aCdM Amorphous Cd[MeIm]2
ADC Analog to digital controller
ADF Amsterdam density function
BRAIN-CP Broadband adiabatic Inversion cross-polarization
BRAIN-CP/WCPMG Broadband adiabatic inversion with WCPMG
CASTEP Cambridge serial total energy package
CCF Crystallite-fixed frame
CdIF Cadmium imidazolate framework
CdO Cadmium oxide
CE Crown ether
CP Cross-polarization
CP/MAS Cross-polarization/magic angle spinning
CPMG Carr-Purcell-Meiboom-Gill
CS Chemical shift
CSA Chemical shift anisotropy
CSD Cambridge Structural Database
CT Central transition
dCdM dia-Cd[MeIm]2•HMeIm
DFT Density functional theory
DMF Dimethylformamide
EFG Electric field gradient
xlvii
FML Fast motion limit
FOQI First-order quadrupolar interaction
FWHH Full width half height
HMeIm 2-methylimidazle
iCdM Intermediate Cd[MeIm]2
Im Imidazole
IMR Intermediate motion regime
MAS Magic angle spinning
MeOH Methanol
MO Molecular orbita
MOF Metal-organic framework
MQMAS Multiple quantum magic angle spinning
MS Magnetic shielding
NLMO Natural localized molecular orbital
NMR Nuclear magnetic resonance
o.d. Outer diameter
PAS Principal axis system
ppm Parts per million
PXRD Powder X-ray diffraction
QE Quadrupolar echo
QI Quadrupolar interaction
RAS Relaxation-assisted separation