DAMAGE AND FAILURE ANALYSIS OF CONCRETE USING
SYNTHETIC 3D MESO-STRUCTURES
Xiaofeng Wang1 and Andrey P Jivkov2
1
PhD student, University of Manchester, UK
2
Lecturer, University of Manchester, UK
ABSTRACT
Concrete is one of the key materials used in the construction of nuclear power plants, with both structural and shielding functions. Understanding the aging of concrete in service is essential prerequisite for advanced plant life assessment. Aging is associated with changes in the complex heterogeneous structure of concrete, which could be chemically and/or mechanically driven. First steps towards modelling and predicting aging can be made by appropriate representations of concrete at its meso-structural length scale, where it is a three-phase composite, containing mortar, coarse aggregates and voids. This work presents generation and packing algorithms for modelling three-dimensional heterogeneous concrete specimens with randomly distributed spherical, ellipsoidal and polyhedral aggregates and voids, with prescribed size distributions, shape and volume fraction. Models are meshed automatically and include cohesive elements at all interfaces between continuum elements. The cohesive elements represent potential crack paths and their traction-separation laws are different within the mortar, within the aggregates and at the interfaces between these phases. Mesoscale crack initiation, propagation and coalescence are simulated naturally with the cohesive elements. The models are solved by FEM, and statistically analysed to evaluate the effects of mechanical behaviour of concrete. The proposed methodology provides an effective and efficient tool for damage and failure analysis of concrete, and a comprehensive study was conducted for 3D heterogeous concretes in this paper.
INTRODUCTION
Concrete is the most widely used construction material in the field of civil engineering due to its good strength and durability relative to its cost. Understanding the characteristics of concrete is essential prerequisite for building construction assessment. Due to its multi-phase composition and quasi-brittle mechanical behaviour, modelling of concrete for structural engineering analysis has been a classical challenge for several decades, and up to now many details such as strain softening, micro-crack propagation, failure mechanisms and size effects are still far from being fully understood.
aggregate-mortar interfaces. So among all the approaches, it seems that the direct approach is particularly suitable for statistical analysis of concrete samples, and was used in this work.
For meso-structure models of concrete, identification and generation of unit cell geometry is a vital step,
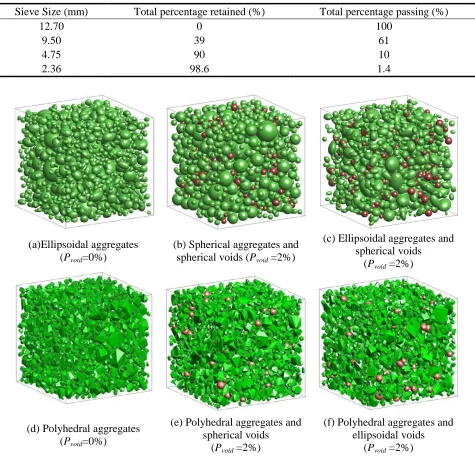
aggregates are usually assumed to be spherical for simplicity. In recent years, considerable attention has been paid to generate various aggregate shapes, e.g., ellipsoidal aggregates using functions with varying parameters (Liu et al., 2014), and polyhedral aggregates by random packing systems (Khelifa and Guessasma, 2013) and Voronoi tessellation methods (Caballero, 2005). It is worth noting that most of the existing meso-structure models of concrete only consider random aggregates (Caballero, 2005; López, Carol and Aguado, 2007) but neglect voids. However, X-ray computed tomography (XCT) images of concrete (Landis and Keane, 2010; Man, 2010) clearly show that voids exist in concrete at mesoscale. It is therefore imperative to develop a procedure for automatic generation of morphological details of materials with both randomly distributed aggregates and voids of different shapes.
Several numerical models for crack propagation at mesoscopic level have been used to study the heterogeneity of concrete. Continuum based finite element models are the main approaches employed in the literature (Hordijk, 1992; Kwan et al., 1999). Other alternative approaches have also been developed, such as discrete element model (DEM) (Shiu et al., 2008) and lattice model (Reichert, 2009). A key issue associated with the DEM and lattice model is the difficulty in determining the equivalent model parameters, which is relatively straight forward for continuum based FE models (Tu and Lu, 2011; Jivkov, 2014). The numerical model used in this work for crack propagation at mesoscopic level is based on the cohesive zone model (Wang, Yang, Yates, Jivkov and Zhang, 2015). It is becoming more and more popular in modelling crack propagation due to its simple formation, easy implementation in the form of cohesive interface elements (CIEs).
The aim of this work is to develop a holistic procedure for analysis of meso-structure and local properties effects on the macroscopic behaviour of concrete. Firstly, an in-house program HMG (heterogeneous material generator) consisting of particle generation and packing is developed and applied to generate 3D meso-structures of concrete with randomly distributed spherical, ellipsoidal and polyhedral aggregates and voids, respectively. Secondly, interfaces between all aggregate-aggregate, mortar-mortar and aggregate-mortar continuum elements are represented by zero thickness cohesive elements via an in-house program CIEIN (cohesive interface elements insertion). Non-linear cohesive laws for the three types of interfaces are implemented. Thirdly, MCS (Monte Carlo Simulations) are carried out to investigate mechanical behaviour of concrete in a quantitative manner. The outcomes are presented comprehensively and provide valuable information for improved understanding of damage and failure mechanisms of concrete.
MESO-STRUCURES OF CONCRETE
Table 1 Aggregate size distribution (Hirsch, 1962)
Sieve Size (mm) Total percentage retained (%) Total percentage passing (%)
12.70 0 100
9.50 39 61
4.75 90 10
2.36 98.6 1.4
(a)Ellipsoidal aggregates
(Pvoid=0%)
(b) Spherical aggregates and
spherical voids (Pvoid =2%)
(c) Ellipsoidal aggregates and spherical voids
(Pvoid =2%)
(d)Polyhedral aggregates
(Pvoid=0%)
(e) Polyhedral aggregates and spherical voids
(Pvoid =2%)
(f) Polyhedral aggregates and ellipsoidal voids
(Pvoid =2%)
Fig. 1. 3D mesostructures of concrete (Pagg=30%)
FINITE ELEMENT MODELLING
Mortar
Aggregate
N1 N7 N6 N9 N14 N5N12N13
N15
N16
N4
N3
N2
N8 N11
N10 E4 E6 E7 E3 E2 E1 E5
CIE AGG
CIE_MOR
CIE_INT
aggregates (grey in Fig. 2 (b) and Fig. 2 (d)), CIE_MOR inside the mortar (green in Fig. 2 (b) and Fig. 2 (d)), and CIE_INT on the aggregate-mortar interfaces (yellow in Fig. 2 (b) and Fig. 2 (d)). The element
and node numbers are denoted as E and N respectively. The detailed numbering of elements and nodes in
the initial mesh and the mesh with inserted cohesive elements shows the insertion procedure with the new nodes generated at the same positions and CIEs between the continuum elements. A bilinear cohesive crack model is used here to predict discrete crack propagation in concrete specimens under tension loading. A linear ascending branch is added in the softening curve to model the initially un-cracked material.
(a)Initial mesh (b)Mesh with zero thickness cohesive elements
Fig. 2 Inserting different cohesive elements into mortar-aggregate interface
RESULTS AND DISCUSSION
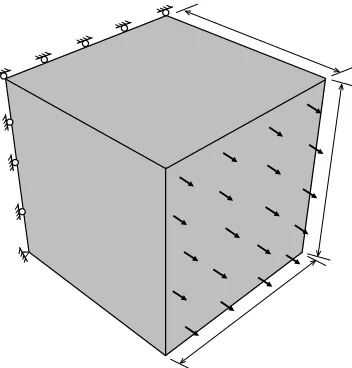
Fig. 3 shows the geometry, boundary and loading conditions of the numerical model. A displacement
controlled loading scheme was used and all the analyses were ended at a displacement d=0.1 mm and
loading time t=0.005s (Wang, Yang, Yates, Jivkov and Zhang, 2015). Considering the balance between accuracy and efficiency, the element length 1mm was used for all the meshes in this study (Wang, Yang, Yates, Jivkov and Zhang, 2015). Solutions were performed with the commercial software ABAQUS/Explicit.
Stress-displacement curves from a Monte Carlo simulation with 50 realisations are shown in Fig. 4 together with the numerical mean curve and experimental data acquired from tension tests of six samples by Hordijk (Hordijk, 1992). The simulated stress-displacement curves in this work fit well with the experimental scatter. They are similar in terms of clear peak and sharp initial post-peak drop followed by a long shallow tail. The influence of the sample number on the Coefficient of Variation (CoV) of stress at loading point A (i.e. peak stress) and B (i.e. stress at displacement 0.03mm, where largest standard deviation is observed) (see Fig. 4) is shown in Fig. 5. It can be seen that 50 samples are enough to get a convergent value of CoV of stress with a stable fluctuation. It can also be observed that COV of peak stress for different void and aggregate distribution is low (1.5%), which demonstrates that the peak stress is relatively insensitive to the void and aggregate distribution. The notably large differences observed between the softening responses of the different realisations and high CoV of stress at point B illustrates the necessity to do a statistical analysis as the results vary greatly for different aggregate and void distribution, especially in softening range. Fig. 6 shows the statistical distribution of peak stress, together with the probability density and the best fit Gaussian Probability Density Function (PDF). The probability
Mortar
Aggregat
N7 N6 N5 N1 N2 N3
N4 E4
E3
E2
density curve can be used to calculate structural reliability or failure reliability against given external loadings and material properties for structural design.
Fig. 3. Specimen dimensions, loading and boundary conditions
Fig. 4. Stress-displacement curves obtained from Monte Carlo simulation
0 20 40 60 80
0 1 2 3 4 5 6
0 10 20 30 40 50
CoV
-B
(%
)
CoV
-A (%
)
Sample number 3D-A
3D-B
Fig. 5. Influence of sample number on the CoV of stress
Fig. 6. Statistical distribution of peak stress from Monte Carlo simulation
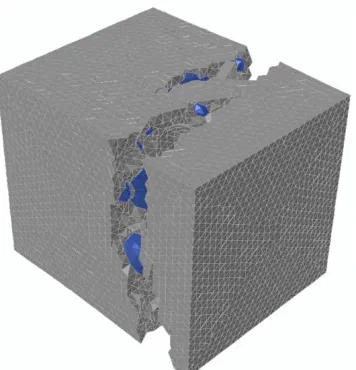
Typical macro-crack patterns are observed from the Monte Carlo simulations under uniaxial tension. Fig. 7 presents the crack patterns at softening stage. To clearly visualise the fracture surfaces, four different ways are used: models with damaged cohesive elements (displacement magnification factor of 20), model without cohesive elements (displacement magnification factor of 200), failed interfaces only (displacement magnification factor of 20) and morphology of failed surface. The cracks shown in Fig. 7(a)
and Fig. 7(c) are represented by red cohesive interface elements with damage index D≥0.95 (D=1 means
complete failure). It could be observed that 3D modeling predicts more realistic fracture surfaces in the thickness direction whereas 2D modeling only assumes plane fracture problems. This result confirms the importance of including the third dimension into the analysis.
A
(a) Models with damaged cohesive elements (b) Model without cohesive elements
(c) Failed interfaces only (d) Morphology of failed surface
Fig. 7. Failure of concrete under tension
CONCLUSION
ACKNOWLEDGEMENT
XF Wang is funded by an EPS Faculty PhD studentship from the University of Manchester, UK. The support of IT Services for the use of the Computational Shared Facility (CSF) at The University of Manchester is also gratefully acknowledged.
REFERENCES