Highlights from Super-Kamiokande
Kimihiro OKUMURA1,2,a
1Research Center for Cosmic Neutrinos, Institute for Cosmic Ray Research, University of Tokyo, Kashiwa,
Chiba 277-8582, Japan
2Kavli Institute for the Physics and Mathematics of the Universe (WPI), The University of Tokyo Institutes for
Advanced Study, University of Tokyo, Kashiwa, Chiba 277-8582, Japan
Abstract.Recent results from Super-Kamiokande experiment are reviewed in this pa-per; Neutrino mass hierarchy and CP violation in the lepton sector are investigated via
νμ →νeoscillation of the atmospheric neutrinos. The event rate, correlation with solar
activity, energy spectrum of the solar neutrinos are measured via electron elastic scat-tering interactions. Neutrino emission from the WIMP annihilation at the center of the Sun are searched in the GeV energy regions. New project, SK-Gd project, to enhance anti-neutrino identification capability, has been approved inside the collaboration group.
1 The Super-Kamiokande detector
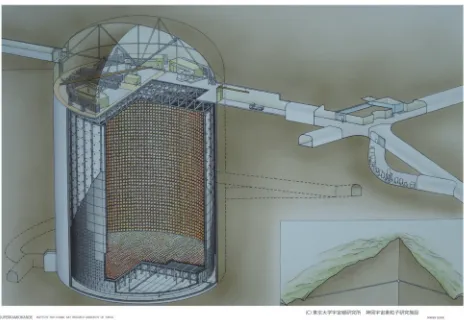
Figure 1 shows the schematic view of Super-Kamiokande (SK) detector. SK is a water Cherenkov detector, which size is 41.4 m and 39.3 m in height and diameter, respectively. It is located about 1000 m underground in Kamioka mine of Gifu prefecture, Japan. The total volume is 50 kton, and the fiducial volume for analysis is 22.5 kton. The detector is separated into the inner (ID) and the outer (OD) detectors. In the inner detector, 11129 20” photomultipliers (PMTs) are placed in grid on the detector wall to take the image of Cherenkov lights, which are produced by charged particles. In the outer detector 1885 8” PMTs are placed to detect activities coming from outside such as cosmic ray muons.
SK has been running almost 20 years from April 1996. The first phase of the experiment, SK-I, began with the original configuration of 40% photo coverage. The detector underwent an implosion accident losing about half of PMTs in 2001. The rest of PMTs are re-arranged uniformly, and SK-II resumed with 20% photo coverage. After full recovery, SK-III started with 40% coverage from 2006. The frontend electronics were upgraded in SK-IV.
SK is a multi-purpose detector with rich physics. Neutrino oscillations have been studied with solar and atmospheric neutrinos. SK also plays a role of the far detector in T2K long baseline ex-periment, where neutrino oscillation has been studied with accelerator neutrinos. At the same time, we are searching for astronomical neutrinos, such as supernova burst and supernova relic neutrinos. Proton decay is predicted in GUT theory, which is the physics beyond standard model. WIMP anni-hilation signal from astronomical objects, such as the Sun, may be observable if the mass range is in the energy range from GeV to TeV.
This paper reviews the recent results and status of SK. It goes with atmospheric neutrino (Sec. II), solar neutrino (Sec. III), solar WIMP search (Sec. IV), SK-Gd project (Sec. V), and summary (Sec. VI).
Figure 1.Schematic drawing of Super-Kamiokande detector.
Table 1.Experimental phase, observation period, and detector configuration of Super-Kamiokande
Phase Period # of ID PMTs (photo coverage)
SK-I Apr. 1996−Jul. 2001 11146 (40%)
SK-II Oct. 2002−Oct. 2005 5182 (20%)
SK-III Jul. 2006−Aug. 2008 11129 (40%)
SK-IV Sep. 2008−Present 11129 (40%)
2 Oscillation analysis with atmospheric neutrino
Since the existence of the neutrino mass became evident in 1998 [1], three-flavor mixing of the neu-trino oscillation is widely accepted as the standard theory. The flavor eigenstate of three neuneu-trinos
(να,α=e,μ,τ) are expressed by the mass eigenstate (νi,i=1,2,3) and PMNS [2, 3] mixing matrix as
follows:
⎛ ⎜⎜⎜⎜⎜ ⎜⎜⎜⎝ ννeμ
ντ ⎞ ⎟⎟⎟⎟⎟ ⎟⎟⎟⎠=
⎛ ⎜⎜⎜⎜⎜
⎜⎜⎜⎝ 10 cos0θ23 sin0θ23 0 -sinθ23 cosθ23
⎞ ⎟⎟⎟⎟⎟ ⎟⎟⎟⎠ ⎛ ⎜⎜⎜⎜⎜
⎜⎜⎜⎝ cosθ13 0 sinθ13e −iδCP
0 1 0
-sinθ13eiδCP 0 cosθ13 ⎞ ⎟⎟⎟⎟⎟ ⎟⎟⎟⎠ ⎛ ⎜⎜⎜⎜⎜
⎜⎜⎜⎝ -sincosθθ1212 cossinθθ1212 00
0 1 0
⎞ ⎟⎟⎟⎟⎟ ⎟⎟⎟⎠ ⎛ ⎜⎜⎜⎜⎜ ⎜⎜⎜⎝ νν12
ν3 ⎞ ⎟⎟⎟⎟⎟ ⎟⎟⎟⎠.
According to the neutrino oscillation measurements using the atmospheric [4, 5], reactor [6–9],
accelerator [10–13], solar neutrinos [14, 15], the values of two mass splitting, (Δm2
21,Δm232), and three
mixing angles, (θ12,θ23,θ13), have been measured. However, still important pieces are missing, such
as, CP violation phase,δCPand neutrino mass hierarchy. We have a great interest in measuringδCP
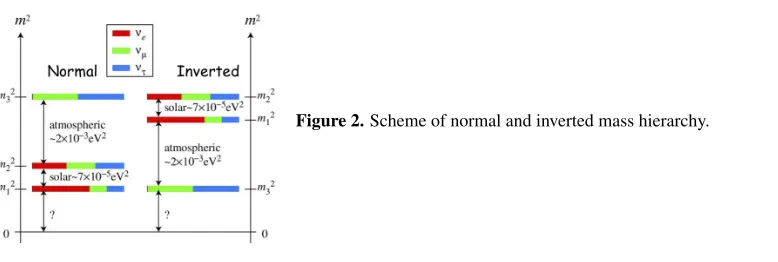
since it may be the source of matter/anti-matter asymmetry universe. The mass hierarchy means the
ordering of second and third mass state. The normal (inverted) hierarchy is defined as that mass of the
3rd neutrino is larger (smaller) than others, as shown in Figure 2. The octant ofθ23, i.e. θ23>π/4 or
Figure 2.Scheme of normal and inverted mass hierarchy.
These parameters are possible to be probed by using atmospheric neutrinos. The atmospheric neutrinos are the decay products of secondary particles, such as pions and kaons, generated by the interactions of cosmic-ray and atmosphere. SK has been observing the atmospheric neutrino events in a wide energy range from sub-GeV up to TeV scale.
The oscillation of the upward-going electron neutrino, which travels in a long distance inside the
Earth, is affected by the matter effect, and contains important information on the mass hierarchy and
CP violation phase. Figure 3 shows the oscillated electron neutrino flux relative to the non-oscillated
flux in the upward-going direction. A resonant-like enhancement by MSW effect is seen around multi
GeV region. Interestingly the resonance occurs for either neutrino or anti-neutrino, depending on the mass hierarchy, i.e. the resonance occurs only for neutrino (anti-neutrino) oscillation with normal
(inverted) hierarchy case. In additionθ23octant affect the amplitude of the resonance. The absolute
flux of the electron neutrinos in the range of Sub-GeV energy region is affected byδCPvalue.
A fit to SK data was performed with several oscillation parameter sets ofδCP,θ23,Δm232 in the
interested regions, based onχ2value between data and Monte Calro (MC) expectation. This fit was
also applied twice with normal and inverted hierarchy assumptions, respectively. Figure 4 showsχ2
difference between normal and inverted mass hierarchy assumptions. The difference of minimumχ2
values for each assumption was 3.0. This means that SK data favors normal hierarchy, but less than
2σsignificance. Alsoχ2becomes minimum inδ
CP∼240◦and sin2θ23>0.5.
We introduced T2K constraint into oscillation fit in order to improve mass hierarchy sensitivity
since T2K data can reduceΔm2
32 andθ23 uncertainties. A model of T2K predictions is constructed
using public available data from T2K, andχ2contribution from T2K data is calculated for each
oscil-lation parameter. This is possible since the neutrino cross section and the detector efficiency are same
due to the usage of the same detector between T2K and SK experiments, Another oscillation fit was performed including T2K constraint. As a result of the fit, normal hierarchy is still favored. Figure 5
shows theχ2difference (Δχ2) from best fit point for different data sample. Both SK and T2K favored
around 280 degrees inδCP, but CP conservation, which corresponds toδCP∼0 orπ, is still allowed at
least 90% confidence level.
3 Observation of solar neutrino
SK is observing Boron 8 solar neutrino via electron scattering interaction in water. At present there are two main motivations to analyze solar neutrino. One motivation is to observe spectrum distor-tion due to the transidistor-tion from vacuum oscilladistor-tion below 1 MeV to matter oscilladistor-tion above 5 MeV. This distortion is indicated from several solar neutrino measurements, but there is no measurement
Figure 3. Oscillatedνeflux relative to the non-oscillated flux as a function of neutrino energy for the
upward-going neutrinos with zenith angle cosθ=-0.8. Thin solid lines, dashed lines, and dotted lines correspond to the solar term, the interference term, and theθ23 resonance term, respectively. Thick solid lines are total
fluxes. Parameters are set as (sin2θ
12, sin2θ13, sin2θ23,δCP,Δm221,Δm 2
32)=(0.31, 0.025, 0.6, 40◦, 7.6×10− 5eV2, +2.4×10⁻⁵eV2) unless otherwise noted. Theθ
23octant effect can be seen by comparing (a) (sin2θ23=0.4) and
(b) (sin2θ
23=0.6). δCPvalue is changed to 220◦ in (c) to be compared with 40◦in (b). The mass hierarchy is
inverted only in (d) soθ13resonance (MSW) effect disappears in this plot.
] 2 [eV 23 2 m Δ
0.001 0.002 0.003 0.004 0.005
2 χ Δ 0 2 4 6 8 10 Normal Hierarchy Inverted Hierarchy 90% CL 95% CL 23 θ 2 sin 0.3 0.4 0.5 0.6 0.7
2 χ Δ 0 2 4 6 8 10 Normal Hierarchy Inverted Hierarchy 90% CL 95% CL CP [degree] δ
0 100 200 300
2 χ Δ 0 2 4 6 8 10 Normal Hierarchy Inverted Hierarchy 90% CL 95% CL
Figure 4. χ2difference from the global best fit point in the oscillation fits as a function ofΔm2
23(left), sin 2θ
23
(middle),δCP(right), respectively. Two lines shows the cases with normal (blue solid) and inverted (orange
dashed) mass hierarchy assumptions. At each point theχ2 is marginalized for other oscillation and nuisance
parameters.
solar neutrino flux which is expected to be caused by the re-generation of Earth’s matter effect when neutrino propagates the Earth.
2 | MeV 32 2 m Δ |
0.001 0.002 0.003 0.004 0.005
2χ Δ 0 5 10 15 20 99% 90% 68% 23 θ 2 sin
0.2 0.4 0.6 0.8
2χ Δ 0 5 10 15 20 99% 90% 68% cp δ
0 2 4 6
2χ Δ 0 5 10 15 20
Figure 5.χ2difference from the best fit point in the oscillation fits using SK (solid black), T2K model (dashed
purple), and SK plus T2K model (solid light blue) data sample, as a function ofΔm2
23(left), sin 2θ
23(middle),δCP
(right), respectively. Normal mass hierarchy is assumed.
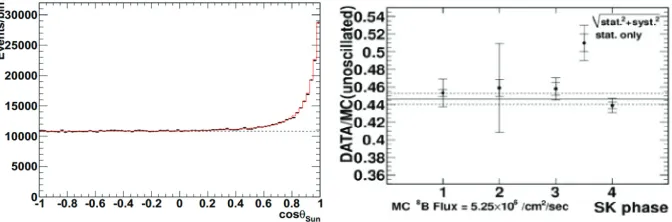
The yearly event rate with the Sun spot number are shown in Figure 7 from 1996 up to the present. The observed rate is consistent with flat distribution; thep-value of the observed rate compared with the constant is 78.6%. There is no significant correlation between the solar neutrino flux and the Sun spot number,
Figure 6.Angular distribution of the observed events with respect to solar direction in SK-IV (left), and the ratios of data to unoscillated Monte Carlo expectation in8B flux for each SK experiment phase. cosθ
Sunrepresents the
cosine of the inner angle between electron direction and the solar direction. The events near the peak around cosθSun=1 corresponds to the recoiled electron events by solar neutrino interactions, and the flat components are background.
Figure 7.Ratio of data flux to unoscillated Monte Carlo expectation (red with error bar) and the Sun spot number (black dot) are shown as a function of observed date from the beginning of SK-I to the recent period of SK-IV.
Figure 8.Combined spectrum of the recoiled electron kinematic energy from SK-I to SK-IV with the expected spectra of the various spectral assumptions (left), and the observed neutrino energy spectrum of several solar neutrino experiments (right). In the left plot the expected spectrum for the best fit oscillation parameters obtained with solar plus KamLAND (blue) and solar global (green) data are shown. The energy spectra expressed by the quadratic (black) and exponential (orange) functions are also shown. Note that the unit of the horizontal axis is the total energy of recoil electron where the detector effect such as energy resolution are not de-convoluted. The error bar represents statistical uncertainties. In the right plot the measured oscillation probability by SK plus SNO data (red) is shown with those measured with p-p solar (blue),7Be by Borexino (green), Homestake plus
SK plus SNO CNO (olive), and pep by Borexino (cyan) data, as a function of neutrino energy.
4 Search for neutrino emission from solar WIMP
It is believed that Weakly Interacting Massive Particle (WIMPs) are attracted by the Sun’s gravity, lose their energy by interactions, annihilate viaχχ→ bb¯ / W+W− /τ+τ− channels. Then neutri-nos are expected to be produced as their decay products. SK is possible to search WIMP signal by looking for such neutrino events from the Sun. Recently some direct dark matter experiments, such
as DAMA/LIBRA [16, 17], reported positive results in the low energy WIMP mass region around
10 GeV. We have improved our analysis to search for WIMP signal for such low energy region. SK is suitable to search for these low mass WIMP signal. Figure 9 shows the angular
distribu-tions with respect to the Sun and the momentum distribudistribu-tions of several different energy samples.
Figure 9. Angular and reconstructed momentum distributions of SK I-IV data (black crosses); atmospheric-neutrino background MC (normalized to data live time, blue solid); WIMP atmospheric-neutrino signal MC for the 6 GeV/c2
bb¯channel (magenta dotted)/200 GeV/c2τ+τ−channel (cyan dashed) at 90% upper limit, magnified 30 times for visibility. Among seven sub-GeV samples, the single-ringe-like 0-decay-electron andμ-like 0,1-decay-electron samples are combined and shown in the left column. In the middle column, six multi-GeV samples are combined and shown. PC and up-μsamples are shown in the right column.
The WIMP signal was searched by the fitting method. The WIMP simulation are generated with several WIMP mass assumption and via the several annihilation modes ofχχ→bb¯,W+W−, τ+τ−. The angular distributions of the data are fitted with atmospheric MC (background) plus WIMP simulation data with varying their normalizations. As a result of fitting analysis, no significant excess was seen over the background distributions.
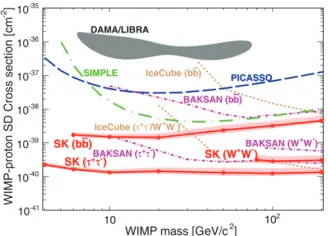
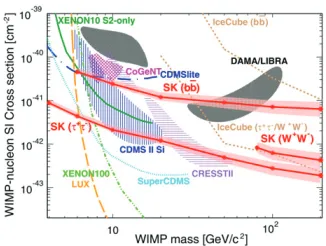
In order to have the meaningful upper limit on the WIMP cross section, the conversion factor from neutrino flux to WIMP cross sections is calculated using DarkSUSY 5.0.6 [18]. Also with several standard assumptions, which are commonly used in dark matter analysis, the upper limits on spin-dependent (SD) and spin-independent (SI) cross sections are obtained below 200 GeV/c2 in
WIMP mass as shown in Figure 10 and Figure 11. The current best limits are set in SD interaction and, some fraction of WIMP allowed regions are ruled out in SI interaction. This results has been published in [19].
Figure 10.90% C. L. upper limits on SD WIMP-proton cross section calculated at DarkSUSY [18] default are shown in red solid with uncertainty bands to take account uncertainties in the capture rate for thebb¯,W+W−andτ+τ−channels from top to the bottom. Also shown are limits from other experiments: IceCube [20] in brown dashed: (top)bb¯/W+W−orτ+τ− (bottom); BAKSAN in pink dot-dashed:bb¯(top)/W+W− (middle)/τ+τ−(bottom) ; PICASSO [21] (blue long-dashed); SIMPLE [22] (green long dot-dashed). The black shaded region is the 3σC.L. signal claimed by
Figure 11.90% C. L. upper limits on the SI WIMP-nucleon cross section (plotting scheme is the same as Figure 10). Also shown are event excesses or annual modulation signals reported by other experiments: DAMA/LIBRA (black shaded regions, 3σC.L.); CoGeNT [23] (magenta diagonally cross-hatched region, 90% C.L.); CRESSTII [24] (violet horizontally-shaded regions, 2σC.L.); CDMS II Si [25] (blue vertically-shaded region, 90% C.L.); and limits: IceCube in brown dashed:bb¯(top)/W+W−(middle)/τ+τ−(bottom); SuperCDMS [26] (cyan dotted); CDMSlite [26] (blue long dot-dashed); XENON10 S2-only [27] (dark green dash triple dot); XENON100 [28] (green dash double dot); LUX [29] (orange long-dashed)
5 Super-Kamiokande Gadolinium project
SK collaboration has decided to approve new project, named as Super-Kamioande Gadolinium project (SK-Gd) in 2015 June. In the project, 0.2% concentration of Gadolinium (Gd) sulfate is added in the pure water. When the neutrons are produced via anti-neutrino interactions, they are thermalized
quickly and captured into Gd with high efficiency of about 90%. The Gd atom emits multiple gammas
which total energy is about 8 MeV. By detecting the prompt positron and the delayed gamma signals, the events of anti-neutrino interaction are possible to be separated from those of neutrinos.
Figure 12.Schematic diagram of electron anti-neutrino reaction with Gadolinium (Gd) water. The signal is recognized by the coincidence of the prompt positron signal and the delayed gamma produced by neutron capture with Gd.
The main motivation of this project is to detect supernova relic (SNR) neutrino, which should be produced in the past supernova. It is believed that much more star formation and supernova burst oc-curred in the past though such star formation rate has large uncertainties from the current astronomical observations. If the amount of SNR neutrino is measured, it will be great interest in the astrophysics and the cosmology.
The attempt in detecting SNR neutrino has also been made in current SK but not detected so far in the energy window of 10-30 MeV since the data suffers from atmospheric neutrino backgrounds, such as Michel electrons produced from low energy invisible muons. Using the coincidence technique of the prompt and the delayed signals in SK-Gd, such background events should be eliminated.
The results of the water transparency and scattering measurements by using the laser injector seems good. The amount of Cherenkov light left after 15 m photon travel is estimated to 92% of pure water case at 0.2% concentration of Gadolinium (Gd) sulfate, as shown in Figure 13. Also no significant increase of the Rayleigh scattering photons, which may affect the performance of the Cherenkov light imaging, have been observed.
Figure 13.(Left) Photo of the EGADS tank and equipments for testing the feasibility of the Gadolinium water in SK. The 200 m3test tank is located at the opposite side of the experimental hall. The Gd water purification
system is located in the near side. (Right) The variation of the water transparency measured in EGADS tank. The measurement started with pure water, and the gadolinium sulfate is added gradually, 0.02%, 0.1%, 0.16%, and 0.2%. The horizontal value is shown by the expected Cherenkov light left at 15 m estimated based on the water transparency measured with several wavelength of the laser injector. The difference in line color represents the the different tank location (blue:bottom, red:center, green:top). The blue shaded region corresponds to those of pure water case measured in SK-III and IV.
According to these verification studies, we, SK collaboration, decided to approve SK-Gd project in 2016 June. The actual start time will be determined by considering the T2K neutrino beam schedule.
6 Summary
Recent physics results and the status of Super-Kamiokande experiment are reviewed in this paper. The oscillation analysis using the atmospheric neutrino shows a slight preference to normal hierarchy and
δCP∼3π/2, The expected distortion in the energy spectrum has not been seen from the solar neutrino observation. The stronger upper limits for SD and SI cross section are set in the mass range of 4-200
GeV/c2from the indirect solar WIMP search. A new project, SK-Gd, is approved and announced by
the SK collaboration, which aims to detect supernova relic neutrino using neutron capture by adding Gadolinium.
References
[1] Y. Fukuda et al. (Super-Kamiokande Collaboration), Phys. Rev. Lett.81, 1562 (1998) [2] Z. Maki, M. Nakagawa, S. Sakata, Prog. Theor. Phys.28, 870 (1962)
[3] B. Pontecorvo, Sov. Phys. JETP26, 984 (1968)
[4] Y. Ashie et al. (Super-Kamiokande), Phys. Rev.D71, 112005 (2005),hep-ex/0501064
[5] R. Wendell et al. (Super-Kamiokande Collaboration), Phys.Rev. D81, 092004 (2010),
[6] S. Abe et al. (KamLAND Collaboration), Phys.Rev.Lett.100, 221803 (2008),0801.4589
[7] F. An et al. (DAYA-BAY Collaboration), Phys.Rev.Lett.108, 171803 (2012),1203.1669
[8] J. Ahn et al. (RENO collaboration), Phys.Rev.Lett.108, 191802 (2012),1204.0626
[9] Y. Abe et al. (DOUBLE-CHOOZ Collaboration), Phys.Rev.Lett. 108, 131801 (2012),
1112.6353
[10] M. Ahn et al. (K2K), Phys.Rev.D74, 072003 (2006),hep-ex/0606032
[11] P. Adamson et al. (MINOS), Phys.Rev.Lett.106, 181801 (2011),1103.0340
[12] K. Abe et al. (T2K), Phys.Rev.Lett.112, 181801 (2014),1403.1532
[13] K. Abe et al. (T2K), Phys.Rev.Lett.112, 061802 (2014),1311.4750
[14] J. Hosaka et al. (Super-Kamiokande), Phys.Rev.D73, 112001 (2006),hep-ex/0508053
[15] B. Aharmim et al. (SNO), Phys.Rev.C72, 055502 (2005),nucl-ex/0502021
[16] R. Bernabei et al. (DAMA Collaboration), Eur.Phys.J.C56, 333 (2008),0804.2741
[17] C. Savage, G. Gelmini, P. Gondolo, K. Freese, JCAP0904, 010 (2009),0808.3607
[18] P. Gondolo et al., JCAP0407, 008 (2004),astro-ph/0406204
[19] K. Choi et al. (Super-Kamiokande), Phys. Rev. Lett.114, 141301 (2015),1503.04858
[20] M. Aartsen et al. (IceCube), Phys.Rev.Lett.110, 131302 (2013),1212.4097
[21] S. Archambault et al. (PICASSO Collaboration), Phys.Lett.B711, 153 (2012),1202.1240
[22] M. Felizardo, T. Girard, T. Morlat, A. Fernandes, A. Ramos et al., Phys.Rev.Lett.108, 201302
(2012),1106.3014
[23] C. Aalseth et al. (CoGeNT collaboration), Phys.Rev.Lett.106, 131301 (2011),1002.4703
[24] G. Angloher, M. Bauer, I. Bavykina, A. Bento, C. Bucci et al., Eur.Phys.J.C72, 1971 (2012),
1109.0702
[25] R. Agnese et al. (CDMS Collaboration), Phys.Rev.Lett.111, 251301 (2013),1304.4279
[26] R. Agnese et al. (SuperCDMS Collaboration) (2014),1402.7137
[27] J. Angle et al. (XENON10 Collaboration), Phys.Rev.Lett.107, 051301 (2011),1104.3088
[28] E. Aprile et al. (XENON100 Collaboration), Phys.Rev.Lett.109, 181301 (2012),1207.5988