THE
C A N 1LOCUS
OF SACCHAROMYCES CEREVISIAE: FINE-STRUCTURE ANALYSIS AND FORWARD MUTATION RATES1WILLIAM L. WHELANZ, ELMAR GOCKE3 A N D THOMAS R. MANNEY4
Department of Microbiology, School of Medicine, Case Western Reserve University, Cleueland, Ohio 44106
A N D
Department of Physics, Kansas State Uniuersity, Manhattan, Kansas 66506
Manuscript received January 7, 1977 Revised copy received July 28, 1978
A B S T R A C T
A system of strains and growth media was developed to allow efficient detec- tion of forward mutation, reversion, complementation, and suppression at the canavanine-resistance (CAN1 ) locus of Saccharomyces cereuisiae. Genetic fine- structure analysis revealed that the map length is at least 40, and possibly as much as 60 X-ray map units; this is the longest gene map yet reported in S. cereuisiae. Allelic complementation was not observed, despite testing of a large number of allele pairs, and alleles suppressible by the ochre suppressor SUP11 were absent from a sample of 48 spontaneous mutants and occurred in- frequently (7%) among a sample of ultraviolet-induced mutants. Infrequent mutant types included canavanine-resistant mutants capable of arginine uptake and alleles thought to represent deletions or inversions. In contrast to previous raports in the literature, the spontaneous forward mutation rate a t CAN1 did not increase during meiosis.
HE C A N 1 locus of Saccharomyces cerevisiae uniquely determines sensitivity Tor resistance to the toxic effects of the arginine analog, L-canavanine (KIT- AGAWA and TOMIYAMA 1929), at the canavanine concentration used in this study. Mutants resistant to canavanine are readily selected (SRB 1955) by plating wild-type (sensitive) cells on media containing canavanine, but lacking arginine. GRENSON et al. (1966) demonstrated that S. cerevisiae takes up arginine by means of a specific permease and that canavanine competitively inhibits argi- nine uptake; they indicated further that resistance to canavanine is associated with loss of arginine permease function. Their results (together with our pres- ent results) strongly suggest that C A N 1 codes f o r the primary structure of the arginine permease.
* This investigation was supported in part by Public Health Service research grant GM19175.
* Present address: Department of Microbiology and Public Health, Michigan State University, E. Lansing, Michigan
48824.
Present address: Zentrallahoratorium fiir Mutagenitllspriifung, Freiburg, Germany.
4 Present address: Department of Physics, Kansas State University, Manhattan, Kansas GGSCG, to whom reprint requests should he sent.
36 W. L. WHELAN, E. GOCKE A N D T. R. MANNEY
All the mutations to canavanine resistance that we isolated occurred at a single locus (see RESULTS) ; this, combined with the ease of selection of both for- ward and reverse mutations, makes the CAN1 locus an especially useful tool for the study of mutation.
In this study, we describe the use of C A N l in studying spontaneous mutation rates during mitotic growth and meiosis. MAGNI and VON BORSTEL (1962) dem- onstrated that the reversion rate of certain alleles is 6- and 20-fold higher dur- ing meiosis than during mitotic growth. This phenomenon (termed the meiotic effect) was shown to be associated with recombination of outside markers in the region of the test allele (MAGNI 1963). The finding that certain alleles revert more readily during meiosis need not imply that forward mutation rates are higher during meiosis than during mitosis.
MAGNI
(1964), using mutation to canavanine resistance, was able to demonstrate an apparent increase in forward mutation rate during meiosis (a 17-fold increase was found) andFRIIS,
FLURYand LEUPOLD (1971), using mutation to adenine dependence in Schizosacclzaro-
myces pombe, demonstrated an approximately three-fold increase i n mutation rate during meiosis. There is an inherent difficulty in measuring the rate of a forward mutation at meiosis because the contribution of accumulated mitotic mutations cannot be evaluated directly. This difficulty is compounded if the strains used do not have a uniform, isogenic background. Our objective has been to solve these problems and to remove the ambiguity concerning the occurrence
of a unique class of forward mutants, if they exist. We have not been able to demonstrate any increase in the forward mutation rate during meiosis.
Fine-structure analysis of CAN1 revealed that the map length of the gene is
40 to 60 X-ray map units; this is the largest map yet described in S. cereuisiae. Despite the great length of the map and the occurrence of alleles that are diffi- cult to position reliably, neither map expansion nor contraction was observed. Certain properties of the C A N l locus suggest that the arginine permease has an essential function (possibly as a structural component of the cell membrane) in addition to its permease function.
MATERIALS A N D METHODS
Strains: The strains S288C, X2180-1A and X2180-1B (mating types cy, a, and cy, respectively) are isogenic for all loci except mating type and have the genotype ARG6, ARGI, C A N I , gaZ2 ( R . K. MORTIMER, personal communication). They were obtained from R. K. MORTIMER (Uni- versity of California, Berkeley). Table 1 gives the genotypes of the strains used. The alleles
trp5-87 and trp5-67C4 are complementing alleles, and are included i n the strains to permit isolation of diploids by prototroph selection. The mutant alleles argd and argd used in this study were isolated after UV mutagenesis (30% survival). These mutations impose two blocks in the arginine pathway prior to the formation of ornithine, and thereby impose an arginine require- ment that can be satisfied by either arginine or ornithine. The uptake of ornithine, however, is not dependent upon the arginine permease. Ornithine is taken up by a t least two systems: the arginine permease (GRENSON et al., 1966) and a general amino acid permease (GRENSON,
T H E CAN1 L O C U S IN S A C C H A R O M Y C E S
TABLE 1
37
Genotypes of strains that carry the wild-type CANl allele
XW195-1B a trp5-87 arg6 arg8 CANl
XW195-1OC CY trp5-67C4 arg6 arg8 CANl
XW197-2A a trp5-67C4 arg6 arg8 CAN1
XW197-2B a trp5-67C4 arg6 arg8 CANl
XW197-2C a trp5-87 arg6 argd CANl
XW197-2D CY trp5-87 arg6 arg8 CANl
Suppressibility testers
XW1066-1A CY trp5-67C4 arg’ SUP11 canl-111
X W 1 0 6 6 l D a trp5-67C4 arg SUP11 c a n l - I l l XW10664C a trp5-87 arg SUP11 c a d - I l l XW10664D CY trp5-87 arg SUP11 cad-111
* Each strain is either arg6, argd, or arg6 arg8 but the exact genotype is uncertain. The symbols refer to the following phenotypes: a/a mating type gene; arg-arginine-requiring, trp-tryptophan- requiring, can-canavanine resistant, SUP-nonsense suppressor.
Notation: CAN1 refers to the dominant allele, which confers sensitivity in the parent strains. Resistant alleles, which are recessive to the sensitive allele, are denoted as c a d - n , where n is the allele number assigned to each independently isolated mutant.
Media: The following media were used as indicated: (M) = Minimal: Difco Yeast Nitrogen Base without amino acids (WICKERHAM 1946) 0.6%, glucose 2%. (MO) =Minimal plus L-ornithine (200 mg/l) (Calbiochem A grade). (MOT) = MO plus L-tryptophan (U, mg/l) (Calbiochem A grade). (MOTC) = MOT plus L-canavanine sulfate (U, mg/l) (Calbiochem A
grade). (SC) = Minimal plus the following supplements: adenine (20 mg/l), L-arginine (20 mg/l), L-histidine (10 mg/l), L-leucine (30 mg/l), L-lysine (U, mg/l), L-threonine (150 mg/l), uracil (20 mg/l). (SC-i) =SC lacking component i only. (M+i) =Minimal plus
compound i. (YEPD) = Difco Yeast Extract ( l x ) , Difco Bacto Peptone (2%), dextrose (2%). (YEKAC) = Potassium acetate ( l x ) , Difco Yeast Extract (0.25%). (KAC) = Potassium acetate (1 %). Solid media contain 2% Difco Bactor agar.
Radiation sources: Ultraviolet light was delivered from a G.E. germicidal lamp. Cultures were irradiated to yield 30 to 50% survival and were incubated in the dark.
X rays were delivered from a beryllium-window X-ray tube (Machlett OEG 60) operated at 50 kVp and 20 mA with no additional filtration. The dose rate at the level of the cells was about 200 rads/second. (MORTIMER 1953, and personal communication).
Conditions of incubation: All cultures were incubated at 30”. Liquid cultures were incubated on a shaker operating at about 250 rpm.
Genetic analysis: The symbols representing genes and alleles used throughout are those proposed at the Fourth International Conference on yeast Genetics (Microbial Genetics Bulletin 21, 1969).
Asci were dissected on MOT agar slabs for tetrad analysis by the method of JOHNSTON and MORTIMER (1959), using Glusulase (Endo Laboratories) to digest the ascus walls. The agar slab was placed on MOT agar and incubated for two to three days. The spore clones were then trans- ferred to MOT agar and the phenotype of each clone determined by replica-plating to the appropriate media.
38 W. L. W H E L A N , E. GOCKE A N D T. R . M A N N E Y
Allelic complementation was judged by the ability of a diploid strain heteroallelic at CAN1
to utilize the arginine present in SC. The MO diploid selection plate was replica plated to an SC plate, which was observed periodically during incubation f o r seven days.
A spot test for recombination in CAN1 was used for preliminary mapping. The diploid selection plate containing heteroallelic crosses was replica plated to SC and to YEKAC. The SC plate served to detect recombinants o r revertants present in the culture before sporulation. The YEKAC plate was incubated for three days to allow sporulation, and then replica plated to SC. Growth on the two SC plates was compared. The alleles were considered capable of recombina- tion if sporulation resulted in a significant increase in clones capable of growth on SC. The results for most alleles were clear cut. When no recombination was observed, the SC plate from YEKAC was examined for the presence of asci. In all cases, asci were plentiful.
This spot test was designed specifically to detect deletion mutation by their failure to recom- bine with at least two alleles capable of recombination with each other. It is also a useful aid in allele mapping, since in many cases it allows assignment of a n approximate map position.
Iniragenic mapping: The method used to position mutational sites within C A N l is the X-ray mapping method of MANNEY and MORTIMER (1964), who lound that when a noncomple- menting heteroallelic diploid is irradiated, a linear relationship exists between the number of prototrophic recombinants (or gene convertants) induced (per survivor) and the X-ray dose. The distance between mutational sites is taken to he the slope of a straight line fitted to the plot of prototrophic recombinants per survivor uersus dose. The relative distances are expressed in X-ray map units (Xrmu), which have the dimensions: prototrophs per 108 survivors per roent- gen. For any three alleles (a triad) in the order a b c , one constructs a three-point map by determining the distances ab, bc, ac. Additivity of the three-point map is assessed by determining
A = ab
+
bc/ac, where A is the additivity coefficient used by KORCH (1971) to assess additivity in his map of HIS1. For each pair of C A N l alleles to be mapped, a pure diploid clone hetero- allelic for them was isolated from the diploid selection plate by streaking for isolated colonies on MO. Liquid MOTC (1 ml) was inoculated with the clone and incubated for 24 hr. Canavanine is included in this medium to reduce the background of spontaneous recombinants. Water (4 ml) was added and the cultures were centrifuged. The cells were washed once with water (5 ml) and were suspended in water (5 ml). This suspension, appropriately diluted, was spread on SC and MOT agar with a sterile glass spreader. The SC and MOT plates were irradiated within 30 min (usually within 15 min) of spreading. Colonies appearing on the SC and MOT plates were counted at three and seven days after irradiation. The counts did not increase significantly after seven days; therefore, the counts at that time are used for calculation of map distances.Response of CAN1 alleles to the nonsense suppressor SUP11 was determined with the strains in Table 1. The recessive canl-111 allele, which is nonsuppressible and fails to recombine with a number of other canl alleles that are capable of recombining among themselves, is in the test strain because the alleles to be tested are recessive. The testers all require arginine, but the exact arginine genotype is indefinite. The presence of SUP11 in the testers was verified by cross- ing each to a strain containing the known SUP11 suppressible allele ade2-1, and scoring SUP-
pression of ade2-1 by tetrad analysis. To test a canl allele for suppressibility, a haploid strain containing the allele was crossed with the tester of opposite mating type and complementing irp5 allele. The diploid selection plate was replica plated to SC and to YEKAC. The SC plate served to test whether suppression could occur in th- diploid. The YEKAC (sporulation) plate was incubated three days and replica-plated to MOT to ensure germination of ascospores. After two days incubation, the MOT plate was replica plated to SC. This plate served to test whether suppression could occur in haploid segregants.
THE CAN1 L O C U S IN S A C C H A R O M Y C E S 39
of C usually employed, C-I is indistinguishable from C. Thus one has: M = m / C (LEA and COULSON 1949; LURIA and DELBRUCK 1943). One determines experimentally the number of
mutants, r, in each of a series of parallel cultures of known size. The number of mutants found in a culture is the result of two processes-mutation itself and the proliferation of mutations once they have appeared. An estimate of m may be obtained by determining r for each of a series of parallel cultures and using one of the procedures of LEA and COULSON (1949). We have used method (c), the Method of the Median of those authors. One determines m by measuring
To, the median of the distribution of r among N parallel cultures, and using the relation: ( r o / m )
-
log m = 1.24 (LEA and COULSON 1949). The use of the median, rather than the mean, of the distribution of r eliminates excessive effects of a few cultures with very high r values on the estimate of m (LEA and COULSON 1949). The standard deviation in m is estimated from the procedure described by LEA and COULSON (1949).I n haploid strains: In most experiments (numbers 1 through 5 and number 7), isolated clones of the strain under study were grown from single cells isolated on MOT agar. The cell from which the clone was derived was isolated either by micromanipulation or by spreading on MOT a suspension of culture of the strain diluted so as to obtain 10 to 20 cells per plate. After incuba- tion to form a clone of suitable size, the entire clone was spread on an MOTC agar plate. The number of mutants in the clone is taken as the colony count after incubation for six to eight days. The average clone size C was estimated by suspending one or more of the parallel clones sepa- rately in water and spreading a suitable dilution on MOT agar. The colony count after incubation for six to eight days, corrected for dilution, is the clone size ( C )
.
In experiment 6, the mutation rate was determined i n a culture growing exponentially in liquid MOT medium. An MOT culture of the strain under study was used to inoculate liquid MOT medium (5 ml) with about 2 x 10⁴ cells. Five parallel cultures were incubated. After incubation for 21 hr, the cultures were centrifuged and resuspended in water (0.5 ml). Part of the suspension (0.4 ml) was spread on MOTC to determine the number of mutants present. The culture size was determined by spreading a suitable dilution of the suspension on MOT agar.
Diploid strains after sporuhtion: In most experiments (1 through 6 ) , each diploid culture was grown from a single zygote isolated from the cross XW195-1B x XW195-IOC. The zygote was formed and isolated on either SC or MOT agar, and incubated in liquid MOT. In Experi- ment 7, the diploid cultures were obtained by inoculating liquid MOT with a small sample of a pure diploid clone from the cross XW197-2B x XW197-2D.
The diploid cultures were incubated for one to eight days, centrifuged and resuspended in sporulation medium (YEKAC in experiments 1 to 6; KAC in Experiment 7). The cell density after suspension i n sporulation medium was adjusted to 3 to 10
x
107 ml-*, determined by microscopic count.The cultures in sporulation medium were incubated three to eight days. After incubation, the number of mutants ( r ) per culture was determined by spreading an aliquot of the culture on MOTC. The number of viable cells ( C ) in the culture was determined by spreading a suitable dilution of the culture on MOT. In no case was any attempt made to disrupt the integrity of the asci and disperse the spores. The ascus frequency was determined microscopically by determining the number of asci in a sample of 100 to 300 cells. I t was found that most of the cells that failed to sporulate died during incubation in sporulation medium. In three of the mutation-rate experi- ments, the colonies produced on the viable-count plate were tested for the presence of haploid cells; the frequency of haploid-containing colonies ranged from 0.56 to 0.92. This is an estimate of the fraction of the viable cells that have been through sporulation. Thus, the viable population after sporulation is enriched f o r sporulated cells, and mutation rate calculations are based on the viable count.
R E S U L T S
40 W. L. WHELAN, E. GOCKE A N D T. R. MANNEY
concentration employed is not critical: 10 mg. per 1 completely abolishes growth of a wild-type strain ( GRENSON et al. 1966), while resistant strains grow in the presence of concentrations at least as high as 30 mg. per 1 (MAGNI, VON BORSTEL and SORA 1964). A canavanine-resistant strain capable of arginine biosynthesis is not at a great selective disadvantage in arginine-containing media. However,
if the strain is made incapable of arginine biosynthesis, a strong selective pres- sure for revertants at CAN1 is imposed; the double mutant (argX c a n l ) can neither transport nor synthesize arginine. We have used strains carrying mutant alleles of the loci ARG6 and ARG8 to permit direct selection for revertants at C A N l . The use of these loci, which permit the strain to utilize ornithine in place of arginine, was suggested by F. SHERMAN (personal communication).
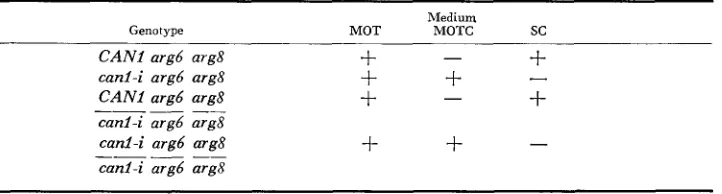
Table 2 describes the CAN1 system. The medium
MOT,
which contains ornithine, is nonselective for sensitive o r resistant trains. MOT is used for rou- tine stock maintenance, ascus dissection, and growth of trains prior to mutant or revertant selection. Canavanine-resistant mutants are selected on canavanine- containing medium, MOTC. Most of these mutants fail to grow on SC, which contains arginine and other amino acids, but not ornithine, a result consistent with loss of arginine permease function. (However, a few canavanine-resistant mutants described below are found to be capable of growth on SC). Revertants are selected on SC medium. It was observed that canavanine-resistant strains cangrow on minimal medium supplemented with arginine (20 mg per 1) but are in- capable of growth on SC (which contains arginine at the same concentration). It seems likely that an alternate uptake system (such as the general amino acid permease of GRENSON, Hou and CRABEEL 1970) exists for arginine and that in
SC arginine uptake by the alternative system is competitively inhibited by the other amino acids. Diploids that are heterozygous at CAN1 have the sensitive phenotype; those that are homozygous for a resistant allele have the resistant phenotype.
Intragenic mapping: In constructing a map of C A N l an arbitrary sample of 87 alleles of spontaneous origin was mapped using a large number of triads. I t became apparent that a considerable fraction of the total were difficult to map
TABLE 2
Growth properties of strains bearing wild-iype OT mutrrnt alleles of CANl
Genotype
Medium
MOT MOTC sc
CAN1 argb arg8 canl-i argd arg8 CAN1 argb arg8 canl-i argb arg8 canl-i argd aTg8 canl-i argb arg8
-____
__
--__ --
+
+
-
-
+
+
+
-+
-
+
+
THE CAN1 LOCUS IN SACCHAROMYCES 41
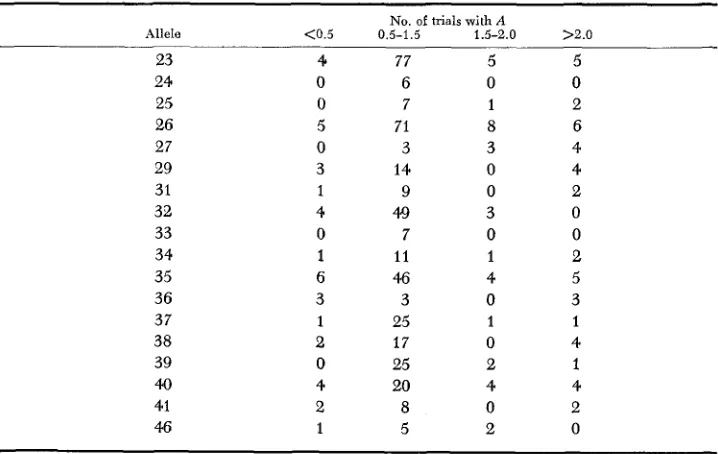
because they gave poor additivity in several triads. These alleles were identified by determining, for all triads in which a given allele appears, the frequency distribution of values of A . The useful range of A is taken to be 0.5-1.5. Table 3 gives the values of A for 18 alleles which appeared in five or more triads. It is
seen that six of the 18 gave values of A outside the useful range in 33% or more of the triads in which they appear. However, it was found that certain pairs of alleles, when present in a triad, allow reasonable additivity in mapping a third allele, even if the latter is ambiguous in other triads. Triads containing reliable allele pairs (particularly 23-26, 23-32, 32-37) are given most weight in PO- sitioning alleles.
The CAN1 gene was found to be unexpectedly long (Figure 1 ) . Alleles 37 and 39 are considered to be the two reliably positioned alleles farthest apart. Thus, the gene is approximately 40 Xrmu in length and possibly longer, if alleles
41
and 36 are considered. Both41
and 36 map poorly in other triads but give reasonable additivity when mapped in the triad containing alleles 23 and 26.If
41
and 36 are included the length becomes slightly greater than 60 Xrmu. Figure 2 represents the distribution of all alleles of CAN1 mapped to date. The majority were mapped by using only one triad, and are positioned within one of a series of segments 10 Xrmu i n length. The order and position of alleles within segments is unknown.It
may be seen that the ends of the map are rather poorly defined; however, the length of the map is not greatly in excess of 60Xrmu since the four alleles which lie outside of segments A through F are not much more than 30 Xrmu from allele 23.
TABLE 3
Disiribuiion of values of A for all triads in which ihe specified allele appears
No. of trials with A
Allele <0.5 0.5-1.5 1.5-2.0 >2.0
42 W. L. WHELAN, E. GOCFU? AND T. R. MANNEY
4 39 38 35 23 31 26 32 37 36
.
'
t ~ ( x r r m )'
FIGURE 1.-Map of CANI showing length and additivity of intervals. 1 Xrmu = one proto- trophs per 108 survivors per roentgen.
Although alleles which give poor mapping additivity occur frequently in
CAN?, systematic nonadditivity (dependent on the distances measured rather than nature of the allele) was not observed. Of 221 triads, 205 gave values of A between 0.0 and 2.0. The remaining triads i n the sample were considered to map poorly due to experimental error o r the presence of one or more of the alleles described above as mapping poorly. The frequency distribution of values of A
(Figure 3) for these 205 triads approximated a normal distribution with mean and standard deviation of 0.96t- 0.35, and 73% of the values falling within one standard deviation of the mean. The distribution is skewed toward values of
A
<
1.0, but the effect is small. The median value of A is 0.94. To detect de-pendence of
A
on the longest distance in a triad the linear regression ofA
on the longest distance (Figure 4) was determined to have nearly zero slope (0.003Xrmu-l) and intercept 1.01. Thus, A is approximately normally distributed about the expected mean and no dependence of A on the longest distance of the triad occurs. The range over which the longest distance varied is from 1 to 54 xrmu.
Complementation: The ability of heteroallelic diploids to grow when replica plated onto
SC
medium was used as the criterion for complementation. All possible painvise combinations of 35 alleles of independent origin (isolated as spontaneous mutants in haploid cells) were tested. Complementation was notA B C D E F
can 1-23 U
IO (xrmu)
T H E C A N j L O C U S IN S A C C H A R O M Y C E S 43
ADDITIVITY COEFFICIENT
FIGURE 3.-Frequency distribution of A . Map distance is in units of prototrophs per I O 8 survivors per roentgen.
observed. From among the 35 alleles tested, nine were chosen (distributed over most of the map) to test 83 alleles isolated from sporulated diploid cultures. Again, complementation was not observed.
Suppressibility of CAN1 alleles: Suppressibility by the ochre suppressor SUP11 (MANNEY 1964, 1968) was tested as described in MATERIALS and METH-
ODS. No suppressible alleles were found among 48 alleles of spontaneous origin. This result was surprising, since suppressible alleles of CAN1 are known to exist (HAWTHORNE 1968). The test for suppressibility was also applied to induced
. .
. .
.
0 .
.
.*
I .
C
I I I I
I
I I I I I
0.0
!
0
IO
20
30
40
50
44 W. L. WHELAN, E. GOCKE A N D T. R. MANNEY
mutants; only 13 of 185 UV-induced were found to be suppressible by SUPII. Eight of the diploids formed for the suppressibility test were subjected to tetrad analysis and the presence of a suppressible allele was confirmed. To be sure that the low frequency o i suppressible alleles found was not due to the presence of a suppressor in the wild-type strains from which the mutants were isolated, they were crossed to strains bearing the known suppressible (ochre) alleles trp5-48, Zysl-1, and his5-2 (HAWTHORNE and
LEUPOLD
1974). Tetrad analysis failed to demonstrate the presence of suppressors.Mutational alteration of the specificity of the arginine permease: Most cana- vanine-resistant mutants are incapable of arginine uptake as indicated by their failure to grow on SC. Among 94 independent alleles of CAN1 (used in mapping and complementation) none was found capable of growth on SC. I n a n attempt to find canavanine-resistant mutants capable of growth on SC (designated M0TC-tSC-I-), 21 clones of a wild-type haploid strain were grown from single cells on MOT. A sample (ranging in size from one to 15) of the population of canavanine-resistant mutants in each clone was tested for ability to grow on SC. MOTCfSCf strains were found in four of 21 clones as a minority (1/5, 1J6,
3/10, 1/11 ) of the canavanine-resistant mutants in the clones. Three independ- ent MOTCfSCf mutants were subjected to further analysis. Tetrad analysis
of the heterozygotes formed by crossing the mutants to strains of genotype arg6, arg8, CAN1 demonstrated 2: 2 segregation for canavanine sensitivity: resistance and
4:
0 segregation for growth: nongrowth on SC, thus failing (in 11asci) to segregate the property of growth on SC from canavanine resistance. The novel mutants were shown to carry alleles of CAN1 by tetrad analysis (27 asci) using canl-23 as the standard CAN1 allele. Diploids formed by cros- sing the MOTCfSCf strains to the strain bearing cad-23 grew on S C ; this behavior prevents mapping of the novel CAN1 allele.
The simplest hypothesis to account for the observations is that the MOTCf SCf mutants contain a n arginine permease capable of transporting arginine but not canavanine.
If
the phenotype is due to the presence of two mutations (one in CAN1 and one in some other gene) then the putative second mutation is close (within approximately5
centimorgans) to CAN1.Macromutations
in
CANI: Of 111 alleles of CAN1 tested for ability to re- combine with a set of test alleles, five alleles (numbers 65, 66, 86,111 and 117) were found to be incapable of yielding viable recombinants when tested with any of the test alleles. I n the X-ray mapping method, alleles 65. 66, and 86 failed to recombine with either of the well-spaced aleles 26 and35;
alleles 111T H E C A N 2 LOCUS IN SACCHAROMYCES 45
ratio 2:2, spore clones which grow at different rates (Figure 5 ) . The difference
in growth rates persists through repeated subculture. The slower-growing pheno- type is denoted detrimental ( d e l ) . Segregation o f det was not observed on tetrad analysis of the heterozygote bearing c a d - 6 6 , nor was segregation of det observed
in tetrad analysis of diploids heterozygous for any of 32 other can1 alleles tested. Tetrad analysis of the heterozygotes bearing any one of the can1 alleles 65,86,
211 and 117 revealed tight linkage of the gene determining det to cant. These results suggest that allelcs 65,6h, 86,221 and 127 are short deletions or inversions
A
B
C
D
E
FIGURE 5.--Segregation of the drt phenotype in tetrads. (The parental diploids were het-
46 W. L. WHELAN, E. GOCKE A N D T. R. MANNEY
extending through the CAN1 gene; the det phenotype might result from deletion or inversion of genes (near C A N l ) whose loss of function results in a lowered growth rate.
Spontaneous mufiation rates: Experiments were performed to determine the mutation rates at C A N l during mitotic (vegetative) growth and during the process of meiosis. Because there are many more possible routes to forward mu- tation than there are to reversion of a mutant allele, the demonstration of a “meiotic effect” ( MAGNI and VON BORSTEL, 1962) for reversion of certain alleles
does not necessarily mean that the processes which results in the “meiotic effect” are quantitatively important in forward mutation.
The forward mutation rate during meiosis cannot be directly measured in the CAN1 system. This difficulty results from the constraints imposed by the process of sporulation in yeast and from the recessive nature of mutant alleles at C A N l . I n order to obtain a culture in which to induce sporulation, it is neces- sary that the culture pass through a period of vegetative growth in the diploid
state. During this period mutations will presumably occur. There is no direct way of detecting mutations appearing during the period of vegetative growth of
the diploid strain prior to meiosis because the mutant alleles are recessive (GRENSON et al., 1966). Thus, although a diploid cell may have sustained a mutation (in one of the two copies of CAN1 present), the cell remains canava- nine-sensitive, Mutations may be detected after sporulation, but it is impossible to determine whether a given mutation occurred during the process of meiosis or in the period of premeiotic vegetative growth. The mutation rate to canava- nine-resistance can, however, be measured in haploid strains. We assume that, in the diploid, the mutation rate during vegetative growth per copy of CAN1 is the same as in the haploid. On this assumption the mutation rate during diploid vegetative growth is the sum of the rates found in the two parental haploids. The validity of the assumption has been tested by MAGNI (1963). He demon- strated that, during vegetative growth, the reversion rate of a n allele in the homoallelic diploid state was the sum of the reversion rates of the allele in the parental haploids. Thus, one can measure the mutation rate at CAN1 during vegetative growth of haploid strains and after sporulation has occurred i n diploid strains and use the measured rate in haploids to estimate the mutation rate i n mitotically growing diploids and thus the background of mutations present before meiosis.
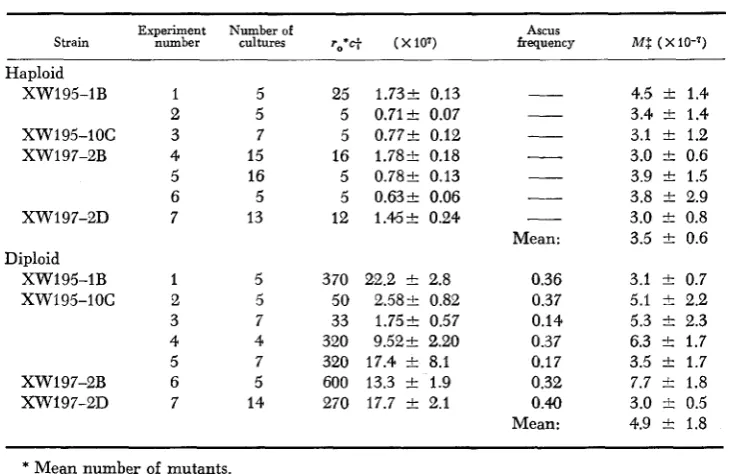
The measured values (Table 4) do not distinguish between the rates in hap- loid cultures and those in diploids after sporulation. The means of both the haploid and diploid rates lie within one standard deviation of the mean of all the rates. If the rate in vegetative diploids is assumed to be twice the haploid rate, one expects a diploid rate (measured after meiosis) of at least (7.0 2 1.2)
x IO-‘. The standard deviation of this value overlaps the standard deviation of the mean of the diploid rates measured, although the mean rate measured is
THE CAN1 LOCUS IN S A C C H A R O M Y C E S
TABLE 4
Mutation rates to canavanine resistance measured in haploid cultures and in diploid cultures after sporulation
47
Experiment Number of Ascus
Strain number cultures ro*c+ (X107) frequency M S ( x 10-7)
Haploid XW195-1B
xw195-1oc XW 1 97-2B
XW197-2D Diploid XW195-1B xw195-1oc XW197-2B XW197-2D 5 5 7 15 16 5 13 5 5 7 4 7 5 14 25 5 5 16 5 5 12 3 70 50 33 320 320 600 270
1.732 0.13 0.712 0.07 0.772 0.12 1.782 0.18 0.782 0.13 0.632 0.06 1.452 0.24
22.2 2 2.8 2.582 0.82 1.752 0.57 9.522 2.20 17.4 t 8.1 13.3 2 1.9 17.7 k 2.1
Mean: 0.36 0.37 0.14 0.37 0.17 0.32 0.40 Mean:
4.5 k 1.4 3.4 i:1.4 3.1 2 1.2 3.0 k 0.6 3.9 t 1.5 3.8 t 2.9 3.0 t 0.8 3.5 2 0.6
3.1 2 0.7 5.1 t 2.2 5.3 2 2.3 6.3 2 1.7 3.5 t 1.7 7.7 it 1.8 3.0 i: 0.5 4.9 t 1.8
* Mean number of mutants.
f Viable cells (counting asci as single cells).
P Mutations per cell division.
is that one is attempting to evaluate what appears to be a small difference be- tween two quantities (the haploid and diploid rates) themselves subject to con- siderable variance. From the rates alone one may conclude that the rate meas- ured in diploid cultures after meiosis can be not greater than twice the haploid rate. Thus, the rate measured in diploid cultures that underwent both vegetative growth and meiosis is no greater than that predicted for vegetative growth. We conclude that a contribution due to mutation rate at meiosis has not been detected. Another, and more easily visualized, way of treating the data is to use the mitotic rates to predict the number of mutants present in a diploid culture at the beginning of the sporulation process. This is the background of mutants present before meiosis. Subtraction of the background number of mutants from the number of mutants found after meiosis should detect mutants produced during meiosis. Thus, one uses the measured rate in haploids to predict z,, the median number of mutants present in a series of parallel diploid cultures at the end of presporulation growth. This analysis supports the conclusion previously stated: the experiments do not detect a contribution of meiosis to the population of mutants present in sporulated cultures.
48 W. L. WHELAN, E. GOCKE A N D T. R . MANNEY
growth. These uncertainties do not allow a clear conclusion that the meiotic rate is zero, which it could be, but do allow the conclusion that it is not greater than the rate per chromosome duplication at mitosis. Thus, the can1 locus has, at most, not greater probability of sustaining a forward mutation during meiosis than it does during the vegetative cell cycle.
DISCUSSION
The can1 map is the longest gene map yet described in S. cereuisiae. In the absence of molecular weight data for the arginine permease, we cannot be sure that the map length is a measure of the length of the peptide product. However,
o n the assumptions (1) that canl responds to stimulation of allelic recombina- tion (or conversion) in a manner similar to previously studied genes, and (2) that the ends of the map represent the ends of the gene, we may calculate a pre- dicted molecular weight for the permease. The prediction is based on the calibra- tion of the X-ray mapping method by MANNEY and MORTIMER (1964), PARKER and SHERMAN (1969) and KORCH and SNOW (1973). Over the range of map size studied (12.5, 2.5, 7.6 Xrmu, respectively) it was found that 1 Xrmu is equivalent to 43 amino acids. However, later studies (MOORE and SHERMAN 1975, 1977) have shown that 1 Xrmu should be taken as approximately equiva- lant to 20 to 50 amino acid residues. Using 60 Xrmu as the length of canl, we predict 2580 amino acid residues in the arginine permease for a molecular weight of approximately 260,000 daltons. I t is well established that genetic dis- tance (Xrmu) and physical distance (nucletotide pairs) are not necessarily pro- portional or simply related, particularly when the distance between mutational sites is small (MOORE and SHERMAN 1975, 1977). However, in our map of
canl the distances measured are very large. It remains to be determined whether map length is a n adequate measure of physical length f o r long maps.
We consider, from the absence of allelic complementation, that the permease is functional as a monomer. The test for complementation is sensitive and there is no reason to think that weak complementation may have escaped detection. It is necessary to consider, however, that the mutants studied were selected on the basis of their resistance to a toxin and that perhaps partial defectives (leaky mutants) and complementing mutants are killed in the selection. It is very un- likely that this consideration could account for the failure to observe comple- mentation, i n that complementing mutants do not necessarily possess residual function. A few leaky mutants were isolated by the selection procedure. How- ever, we have not compared the frequency of leaky mutants in the selected sample with their frequency in an unselected sample.
We have found that about 7% of UV-induced can1 alleles are suppressible by by the efficient ochre suppressor SUP11 (MANNEY 1964,1968). This result con- trasts with earlier studies in the genes: trp5 (MANNEY 1964; MORTIMER and GILMORE 1968) his4abc (FINK 1966), leu1 (NAKAI and M O R T I M E R 1967), arg4 (MORTIMER and GILMORE 1968) in which 19 to 41
%
of alleles where suppressed by supll. SINGH and SHERMAN (1975) have found that 10% of alleles of met15THE CAN1 LOCUS I N SACCHAROMYCES 49
at equal frequency. Thus, the frequencies of ochre allele in met15 and can2
are similar and are lower than the frequencies found in previously studied genes. However, neither gene displays the extreme behavior of
hid,
in which no (ochre) nonsense allele were found (KORCH and SNOW 1973). The selection sys- tem devised by SINGH and SHERMAN (1975) for met15 is interesting in that it sensitively detects partially defective mutants. It is likely, as pointed out by those authors, that efficient selection of partial defectives will lead to low frequen- cies of suppressible alleles. A high percentage of the canavanine resistant mu- tants isolated in this study grew rapidly on canavanine-containing medium (MOTC) and showed no discernible residual growth on arginine-containing medium (SC). Leaky mutants are rare (six in 97 mutants of spontaneous origin). There is no obvious reason why the selection system should select against nonsense mutants. It is likely that the low frequency of ochre alleles is due to some as yet unknown characteristic of c a d , and not to the selection method.The nature of the can1 alleles which fail to recombine with other alleles re- mains uncertain. We have not distinguished between the possibilities that the alleles are inversions or deletions. These apparent macromutations appear to extend through all o r most of CAN1 and possibly into an adjacent gene or genes. Preliminary experiments ( GOCKF, 1973; GOCKE and MANNEY 1979) have indi- cated that a strain bearing the nonrecombining allele canl-121 has residual arginine uptake activity, while a point mutant, canl-23, does not. These experi- ments must be extended to more nonrecombining alleles, and it must be shown that the uptake is a result of the can1 product before definite conclusions can be formed.
The class of mutants which take up arginine but not canavanine will be of use in determining map positions of amino acids important in determining the conformation of the arginine binding site.
The CAN1 system may be o€ general use in studies of mutagenesis. No other system, with the possible exception of the met15 mutants ( SINGH and SHERMAN 1975), has been described in S. cerevisiae by which mutants and revertants may be isolated with comparable efficiency. We have used this efficient system in an attempt to detect an enhanced forward mutation rate during meiosis. No such effect was observed. MALONEY and
FOGEL
(in preparation) have measured mu- tation rates to canavanine resistance very similar to ours and have similarly found no increase in forward mutation rate during meiosis. They used the frac- tion of cultures containing no mutants to calculate the mutation rate according to LURIA and DELBRUCK (1 943). GOTTLIEB and VON B ~ R S T E L ( 1976) (using the method of the median) report a mutation rate similar to ours for haploid (vege- tative) cultures. Both studies just mentimed used strains prototrophic for arginine.50 W. L. WHELAN, E. GOCKE A N D T. R. MANNEY
workers, the use of the method of the median is justified by our observation of lack of selection for or against the mutants in the MOT cultures used to measure mutation rates. We consistently observed identical growth rates of canavanine sensitive and resistant strains, as judged my colony size or MOT. The only ex- ceptions were four of the nonrecombining mutants. Ornithine, at the concen- tration used in this study, completely compensates for arginine auxotrophy and prevents can2 from influencing growth rate.
Despite our finding that the forward mutation rate at can2 does not increase during meiosis, it is not possible to exclude the possibility that certain mutational changes do occur preferentially during meiosis. It is possible that such mutations are not detectable at canl. We have found nonsense and missense mutations but have not identified either frameshifts or deletions. We cannot yet be sure that the cell can tolerate complete loss (deletion) of the canl gene product. For this reason we cannot be sure of detecting all frameshift and nonsense mutations. Further studies are necessary to describe the spectrum of mutations detectable at canl.
We thank JAMES MEADE for reading the manuscript and making numerous useful suggestions, and R. K. MORTIMER for the use of his facilities during part of this work.
LITERATURE CITED
FINK, G. R., 1966
FRIIS, J., F. FLURY and U. LEUPOLD, 1971
A cluster of genes controlling three enzymes of histidine biosynthesis in Saccharomyces cereuisiae. Genetics 53 : 445-459.
Characterization of spontaneous mutations of mitotic and meiotic origin in the ad-1 locus of Schizosaccharomyces pombe. Mutation Res. 11:
GOCKE, E., 1973 Analysis of radiation induced mutations of the arginine permease locus in yeast. M.S. thesis, Kansas State University, Manhattan, Kansas.
GOCKE, E. and T. R. MANNEY, 1979 Expression of radiation-induced mutations a t the arginine permease ( C A N l ) locus i n S. cereuisiae. Genetics 91 : 53-66.
GOTTLIEB, D. J. C. and R. C. VON BORSTEL, 1976 Mutators in Saccharomyces cereuisiae: mutl-1, mud-2 and mut2-I. Genetics 83: 655-466.
GRENSON, M., C. Hou and M. CRABEEL, 1970 Multiplicity of the amino acid permeases in Saccharomyces cerevisiae, IV. Evidence for a general amino acid permease. J. Bacteriol.
103 : 770-777.
Multiplicity of the amino acid permeases in Saccharomyces cereuisiae I. Evidence for a specific arginine-transporting system. Biochim. Biophys. Acta 127: 325-338.
HAWTHORNE, D. C., 1968 The selection of nonsense suppressors in yeast. Mutation Res. 7: 187.
HAWTHORNE, D. C. and U. LEUPOLD, 1974 Suppressor mutations in yeast. Curr. Top. Microbiol. Immunol. 64: 1-47.
JOHNSTON, J. R. and R. K. MORTIMER, 1959 Use of snail digestive juice in isolation of yeast spore tetrads. J. Bacteriol. 78: 292.
KITAGAWA, M. and T. TOMIYAMA, 1929 A new amino-compound in the jack bean and a corre- sponding new ferment. J. Biochem. (Tokyo) 11: 265-272.
373-390.
T H E C A N j LOCUS IN SACCHAROMYCES 51
KORCH, C. T., 1971 Genetical and biochemical studies of complementation i n the first gene for histidine biosynthesis in Saccharomyces cerevisiae. pp. 39-644. Ph.D. Thesis University of California, Davis.
Allelic complementation in the first gene for histidine bio- synthesis in Saccharomyces cerevisiae. I. Characteristics of mutants and genetic mapping in alleles. Genetics 74: 287-305.
LEA, D. E. and C. A. COULSON, 1939 Distribution of the numbers of mutants in bacterial POW- lations. J. Genet. 49: 264-285.
LURIA, S. E. and M. DELBRUCK, 1943 Mutations of bacteria from virus sensitivity to virus resistance. Genetics 28: 491-511.
MAGNI, G. E., 1963 The origin of spontaneous mutations during meiosis. Proc. Natl. Acad. Sci. U.S. 50: 975-980.
-,
1964 Origin and nature of spontaneous mutations in meiotic organisms. J. Cell. Comp. Physiol. 64: Suppl. 1, 165-172.MAGNI, G. E. and R. C. VON BORSTEL, 1962 Different rates of spontaneous mutations during
mitosis and meiosis in yeast. Genetics 47: 1097-1108.
MAGNI, G. E., R. C. VON BORSTEL and S. SORA, 1964 Mutagenic action during meiosis and
antimutagenic action during mitosis by 5-aminoacridine in yeast. Mutation Res. I: 227-230. MANNEY, T. R., 1964 Action of a super-suppressor in yeast in relation to allelic mapping and
complementation. Genetics 50: 109-121. - , 1968 Evidence for chain termination by super-suppressible mutants in yeast. Genetics 60 : 710-733.
MANNEY, T. R. and R. K. MORTIMER, 1964 Allelic mapping in yeast by X-ray induced mitotic reversion. Science 143: 581-583.
MOORE, C. and F. SHERMAN, 1975 Role of DNA sequences in genetic recombination in the iso-I-cytochrome c gene of yeast. I. Discrepancies between physical distance and genetic distance determined by fine mapping techniques. Genetics 79: 397-418. -, 1977 Role of DNA sequences in genetic recombination i n the iso-I-cytochrome c gene of yeast. 11. Comparison of mutants altered at the same or nearby base pairs. Genetics 85: 1-22.
Cytological and environmental factors related to the effects of radiation on yeast cells. Ph.D. Thesis, Univ. California, Berkeley.
Suppressors and suppressible mutations in yeast. Advan. Biol. Med. Phys. 12: 319-331.
Induction o l different classes of genetic defects i n yeast using heavy ions. Radiation Res. (Suppl.) 7: 172-181.
Fine-structure mapping and mutational studies of gene controlling yeast cytochrome c. Genetics 62 : 9-22.
Genetic and physiological characterization of met15 mutants of Saccharomyces cerevisiae: a selective system for forward and reverse mutations. Genetics
Spontaneous and chemically-induced mutations giving rise to canavanine
A critical evaluation of the nitrogen assimilation tests commonly used
Corresponding editor: F. SHERMAN KORCH, C. T. and R. SNOW, 1973
MORTIMER, R. K., 1953
MORTIMER, R. K. and R. A. GILMORE, 1968
NAKAI, S. and R. MORTIMER, 1967
PARKER, J. H. and F. SHERMAN, 1969
SINGH, A. and F. SHERMAN, 1975
81: 75-97. SRB, A. M., 1955
WICKERHAM, L. J., 1946
resistance in yeast. Compt. Rend. Lab Carlesberg Ser Physiol. 23: 363.