Coherence-based optical detection system’s receiver operating
characteristics (ROC) curves
Ricardo C. Coutinho
a,b, David R. Selviah
b, Hugh D. Griffiths
ba
Brazilian Navy Weapon Systems Directorate, Rua Primeiro de Março, 118, 20
oandar, Rio
de Janeiro, Brazil
b
Department of Electronic and Electrical Engineering, University College London, London
WC1E 7JE, United Kingdom
ABSTRACT
High detection probabilities with low false alarm rates, even in the presence of as much as – 28 dB signal to clutter can be obtained, if use is made of the coherence information contained in the input signal. Such a detection system is described and its Receiver Operating Curves (ROC) characterized from a reduced experimental set of data. The system has an input filter with a rectangular passband, an interferometer and a photodetector. The filter gives rise to a sinc function shaped interferogram envelope in optical path difference. The position of the interferogram´s first null depends on the effective bandwidth of the scene in the instrument’s field of view. The detection system is sensitive to the degree of coherence of the scene. The amount of the shift of the position of the first null is found to be a highly sensitive measure of the presence of a very narrow-band target within the instrument’s input bandpass filter. An important characteristic of this system is that the shift is still detected even when an intense wideband incoherent source, which may be considered to be clutter, is introduced into the input. We measured the ROC curves for the optical detection system using a He-Ne laser narrowband coherent source target with a tungsten halogen bulb wideband incoherent background clutter. We show that the target source can be detected even when it is substantially weaker than the clutter at – 28 dB signal to clutter. We compare the predictions of our theoretical model with the experimental results and show good agreement.
Keywords: Coherence detection, ROC curves, clutter rejection, contrast enhancement, detection algorithms.
1. INTRODUCTION
Most detection systems currently employed in military applications use the radiant intensity contrast between target and background as a discriminating feature. The recent widespread availability of cheap, simple use anti-aircraft weaponry led to the development of low observable (LO) technology1, comprising signature control and the use of active countermeasures2. This development, allied to the wish of obtaining longer detection ranges in order to increase reaction times, created a special interest in enabling technologies for the detection of low observable targets (counter low observable – CLO). In the quest for more sensitive detection systems, different figures of merit have been used, some examples being presented in table 1. Usually, these figures present the minimum detectable signal, or the amount of clutter that can be rejected, corresponding to a signal-to-clutter ratio (SCR) gain, some times neglecting or not mentioning the probabilities of detection (PD) and false alarm (PFA) that are found under the stated conditions. A more comprehensive way of
describing a receiver’s performance is the use of the Receiver Operating Characteristic (ROC)11, in which signal-to-noise or clutter ratio, probability of detection and probability of false alarm are directly related. The ROC curves have been used for the characterization of optical detection systems by some authors (see, for example, refs. 9,10,12 and 13).
Reference Figure-of-Merit Result Conditions 3 Clutter rejection 16.5 dB Simulated data 4 Minimum SNR 5 dB Simulated data
5 Minimum SCR 8.2 dB Simulated data, single frame
5 Minimum SCR 6 dB Simulated data, 4 frames, target maximum speed 1 pixel/frame
6 Minimum SNR -6.6 dB Simulated target, real background, Pfa=0.017, 20 frames,
20 sec delay
7 Minimum SCR 0 dB Laboratory data, 16 frames averaged
8 SNR gain 52 dB Field data – spatial, temporal and dual-band algorithm 9 SCR gain 15.5 dB Not clear
10 SCR gain 8 dB Two bands 10 SCR gain 17 dB Three bands 10 SCR gain 21 dB Four bands
Table 1 - Examples of figures of merit of detection systems
2. DETECTION SYSTEM DESCRIPTION
The detection system whose performance is assessed in this paper was described elsewhere14,15. It is an optical, interferometric system, implemented in the visible band, although any band where components are available can be used. The radiation from the scene is passed through a narrowband interference filter with a steep roll-off characteristic, resembling a top hat frequency response. The filtered radiation is fed to a Michelson interferometer, producing interference fringes modulated by a sinc (sin(x)/x) function, corresponding to the Fourier transform of the rectangular power spectrum. One of the interferometer’s mirrors is scanned longitudinally as happens in Fourier transform spectroscopy16, but limiting the length of the scan to the region of the first minimum of the sinc-shaped interferogram. The insertion of a target whose degree of coherence is higher than that resulting from the filtering process results in an increase in the target-filtered background net degree of coherence, causing a displacement in the path difference at which the first minimum of the interferogram occurs. By converting the optical interferogram signal continuously into an electrical signal using a photodetector, and calculating this displacement, a detection discriminant can be obtained. The sensitivity of the approach is increased as the accuracy in the position of this minimum is improved, and this is done by using an algorithm run in a computer, which operates an event marker that pinpoints this position by locating a steep phase transition that happens in the interferogram in the region of its minimum amplitude15. The algorithm calculates the instantaneous phase and frequency of the recorded interferograms and stores the position of the phase (or frequency) feature in the path difference axis with no target in the FOV as a reference, then repeats the process in any test interferogram, to decide whether a target is present or not. To obtain the phase, the algorithm uses a Matlab language built-in function that applies a Hilbert transform to the data to obtain its analytic signal, converts the result to baseband by multiplying it by a complex exponential with the fringe carrier frequency to obtain the complex envelope, calculates the phase angle of this envelope, and differentiates it to find the instantaneous frequency. The analytic signal17 is a complex function having the real part a replica of the original real signal, and the imaginary part the Hilbert transform of the same signal. In the time domain, the Hilbert transform of a sequence is a 90 degrees delayed version of the signal; in the frequency domain it represents the signal as a one sided spectrum with positive frequencies only, not presenting the redundant negative spectrum.
3. EXPERIMENTAL RESULTS
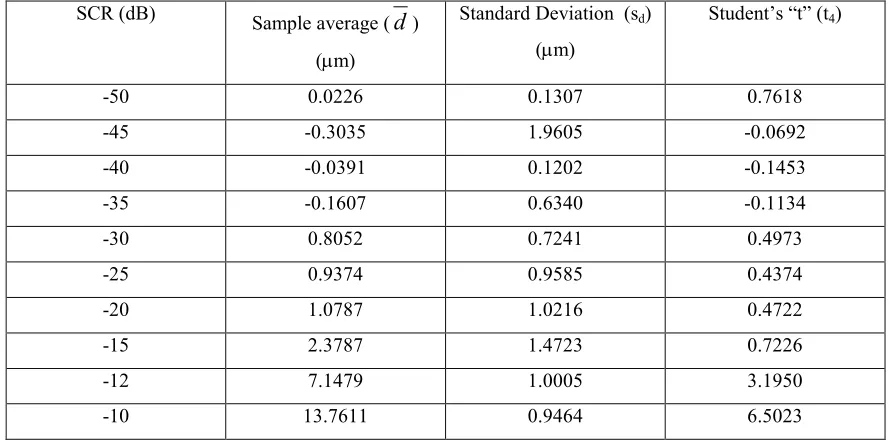
A silicon photodetector was placed at the exit of the interferometer, and its signal was sent for digitization in an oscilloscope, which recorded interferogram sections consisting of 1024 samples. The computer algorithm to measure the phase transition displacement was implemented in Matlab language, and produced the data presented in table 2. This table also contains a Student’s “t” parameter, which is explained later. With different neutral density filter combinations, ten different SCRs where achieved. For each SCR, five interferogram pairs where acquired, one with the target present in the FOV, another without the target, generating five displacements. The average and standard deviation of these five samples were calculated, and plotted in fig. 1, with one standard deviation vertical error bars. Two additional error bars are included in the plot to the sides of the vertical error bars, to indicate the uncertainty in the measurement of the SCR. The horizontal distance between the bars were calculated from the combination of factors that caused uncertainties in the target and background power measurements, which add to 1.47 dB. The dominant factor, of 1.34 dB, was caused by light losses within the interferometer, or light that, although measured in the power measurement plane (an iris placed at the entrance of the detection system), did not reach the interferometer’s mirrors due to the residual divergence of the beam caused by the finite length of the tungsten halogen bulb and imperfections in the collimating optics. Other factors were the power meter resolution (0.03 dB) and the combined effect of power fluctuation of the tungsten halogen bulb and He-Ne laser, detector and electronic noise (0.61 dB), calculated from three independent power measurements. The SCRs indicated in fig.1 were measured after optical filtering by the interference filter, which increases the SCR at the input of the detection system by approximately 18 dB. Thus, in order to obtain the system input SCRs, one has to subtract 18 dB from the number read in the abscissa axis. The reason for the use of this filtered SCR in the plot is to allow comparison with the theoretical plot, also included in fig. 1 and described later.
SCR (dB) Sample average (
d
)(µm)
Standard Deviation (sd)
(µm)
Student’s “t” (t4)
-50 0.0226 0.1307 0.7618
-45 -0.3035 1.9605 -0.0692
-40 -0.0391 0.1202 -0.1453
-35 -0.1607 0.6340 -0.1134
-30 0.8052 0.7241 0.4973
-25 0.9374 0.9585 0.4374
-20 1.0787 1.0216 0.4722
-15 2.3787 1.4723 0.7226
-12 7.1479 1.0005 3.1950
-10 13.7611 0.9464 6.5023
Table 2 - Results of the experiment of detection of a He-Ne laser in a tungsten halogen bulb background
background, which produce different fringe visibilities in the interferometer. The need for this factor is understood if one recalls that interference only occurs between the components of the interfering beams that have the same polarization18. Another improvement is the insertion in the theoretical model of the actual interference filter transmission response, as supplied by the manufacturer. It can be seen in fig. 1 that there is a reasonable agreement between the experimental results an the theory, although for higher SCRs the agreement is only marginal.
-55 -50 -45 -40 -35 -30 -25 -20 -15 -10 -5
-3 0 3 6 9 12 15
filtered signal-to-clutter ratio (dB) Ph
a s e t ra n sit io n d is pl a c e me nt ( mic
ro n s)
Figure 1 - Displacement of the phase transition as a function of SCR
4. CONSTRUCTION OF R.O.C. CURVES FROM EXPERIMENTAL DATA
In the detection theory field, the Receiver Operating Characteristic (ROC)11 is a set of curves usually employed to characterize a receiver, understood here as a decision rule, not as the physical device that implements it. It finds application in statistics, risk management and communication or detection systems. In this paper we will concentrate on the detection systems application, whose purpose is to decide whether a target is present (in the field of view of our optical system) or not. Furthermore, we will use the Neyman-Pearson decision criterion11, commonly applied to detection systems. This criterion consists in establishing an acceptable probability of false alarm, and adjust the detection threshold in order to maximize the probability of detection. In order to build a decision rule, the first step is to formulate the following set of hypothesis about a measured set of displacements in the interferogram phase transition:
H0:
d
=
0
,
it cannot be said that the displacement was caused by the presence of a target in the FOV; orH1:
d
>
0
,
it can be said that the displacement was caused by the presence of a target in the FOV.change cycle, the other components combine without any dominating contribution. Although no specific experiments were performed to assess this distribution, it is believed that a Gaussian distribution can reasonably be assumed in this case.
Following the selection of an appropriate PDF, a test parameter has to be selected. As the data was acquired in pairs, under the same conditions and almost at the same time, given the reduced number of samples, and considering the use of the sample variance as an estimator of the population variance, it is appropriate to use the Student´s t parameter with four degrees of freedom, given by19:
5
4d
s
d
t
=
where
d
and sd are, respectively, the average and standard deviation of the five displacements measured perSCR. A program in Matlab language was written to plot the ROC curves from the experimental data. The program uses the Gaussian distributions of target and background (built-in functions), with widths given by
the calculated standard deviations, and separated by
d
, given in table 2. It creates a variable threshold, and calculates the probabilities of detection and false alarm as a function of this threshold, by integration in the Gaussian curves, for each of the ten different SCRs. The two most popular types of ROC curves are plotted as follows: by eliminating the threshold, a curve displaying PFA versus PD can be plotted for each SCR; andre-parametrizing the data by PFA, curves of SCR versus PD are plotted for different PFAs.
5. DETECTION SYSTEM SENSITIVITY ASSESSMENT
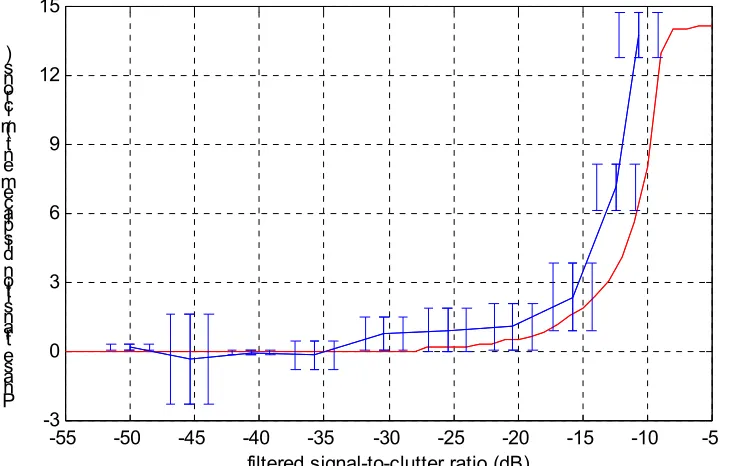
The ROC curves calculated for the detection system object of this paper are shown in figs. 2 and 3. In fig. 2, the probability of detection is presented as a function of the probability of false alarm, just for four filtered SCRs for clearliness (-10, -12, -30 and –45 dB). The performance of the receiver is as better as the curve approaches the upper left corner, in the limit corresponding to a PD of 1 (detection of all targets) with a null
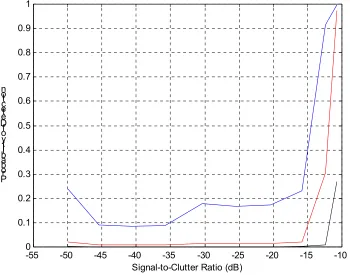
PFA. In fig. 2 it can be seen that the higher the SCR, the better the performance. Fig. 3 shows PD as a function
of SCR for PFA=0.1, 0.01 and 0.001. Additionally, it can be seen in fig. 2, as expected, that the higher the PFA
one can tolerate, the higher the PD. In fig. 3 we have replaced the t4 parameter, which usually appars in
textbooks as the signal-to-noise ratio (SNR) with the signal-to-clutter ratio experimentally measured. It is exactly this mapping process, from a phase transition displacement, dealing with path difference, to a standard detection problem, dealing with the amplitude of those displacements, that gives the detection system under study a very high sensitivity.
Finally, a more comprehensive statement about the performance of the detection system under investigation can be made by looking at the measured ROC curves. The point analyzed previously, where the error bars firstly depart from zero (input SCR=-48 dB) can be found in figs. 2 and 3 to correspond to a PD of 18%, and a PFA of 0.1, unacceptable for a detection system. A better figure of merit of the system would be formulated by saying that, if a probability of false alarm of 0.002 (or 0.2%) is acceptable, the system is able to detect a target with an input signal-to-clutter ratio of –28 dB, with a probability of detection of 70%. This figure compares favourably with the one from most systems presented in table 1, although, in many cases, a direct comparison cannot be made due to the lack of information about probabilties of detection and false alarm, and measurement conditions. If, otherwise, a PFA of 0.01 is acceptable, then this PD is increased to 97%. Although
10-5 10-4 10-3 10-2 10-1 100 0
0.1 0.2 0.3 0.4 0.5 0.6 0.7 0.8 0.9 1
Probability of False Alarm Pro
b a bili t y of De te cti o n
Figure 2 - Interferometric detection system ROC curves, with SCR as a parameter. The filtered SCRs are, from the left to the right: -10, -12, -30 and –45 dB.
-55 -50 -45 -40 -35 -30 -25 -20 -15 -10
0 0.1 0.2 0.3 0.4 0.5 0.6 0.7 0.8 0.9 1
Signal-to-Clutter Ratio (dB) Pro
b a bili t y of De te cti o n
Figure 3 - Interferometric detection system ROC curves, with PFA as a parameter. The PFAs are, from
6. CONCLUSION
A simple, quick method of calculating the ROC curves for a detection system from a reduced number of experimental samples was presented. The method was adapted from the literature, and allows a more comprehensive characterization of a detection system, giving its sensitivity and its relationship with the probabilities of detection and false alarm. An optical, interferometric detection system developed by the authors was characterized using the aforementioned method, showing very high sensitivities, allied to high probabilities of detection and low false alarm rates. These figures compare favourably with most detection systems reviewed, although the performance on the field has not yet been studied. It is expected that the system studied in this paper will, if prototyped for field use, display very good performances, even in spite of the expected degradation from the atmosphere. The experimental results presented showed good agreement with the theory.
7. ACKNOWLEDGEMENTS
The authors would like to thank Prof. Herbert A. French for useful discussions and guidance, Duleep Wickramasinghe and DERA Portsdown West for lending part of the equipment used in the experiments, and the Brazilian Navy for sponsoring the first author.
8. REFERENCES
1. Military Critical Technologies List, http://www.dtic.mil/mctl/.
2. Pointing the Heat. Journal of Electronic Defense, September 00, pp. 59-64, 2000.
3. A. Tartarovsky, R. Blazek. Effective adaptive spatial-temporal technique for clutter rejection in IRST.
Proceedings of the SPIE vol. 4048: 85-95, 2000.
4. E. Branlund, P. Davis, R. Lindgren. Infrared detection of low-contrast sea-skimming cruise missiles.
Proceedings of the SPIE vol. 2742: 196-207, 1996.
5. P. Wei, J. Zeidler, W. Ku. Analysis of multiframe target detection using pixel statistics. IEEE Transactions on Aerospace and Electronic Systems vol. 31, no.1: 238-247, 1995.
6. A. Tartarovsky, S. Kligys, A. Petrov. Adaptive sequential algorithms for detecting targets in a heavy IR clutter. Proceedings of the SPIE vol. 3809: 119-130, 1999.
7. M. Diani, A. Baldaci, G. Corsini. Novel background removal algorithm for Navy infrared search and track systems. Optical Engineering vol. 40, no. 8: 1729-1734, 2001.
8. J.B. Montgomery, R.B. Sanderson, F.O. Baxley. Tactical mid-infrared background suppression in heavy clutter environments. Proceedings of the SPIE vol. 4048: 23-34, 2000.
9. P.F. Singer. A performance model for unresolved target detection using multispectral infrared data.
Proceedings of the SPIE vol. 3373: 16-23, 1998.
10. C.R. Schwartz, M.T. Eismann, J.N. Cederquist. Thermal multispectral detection of military vehicles in vegetated and desert backgrounds. Proceedings of the SPIE vol. 2742: 286-297, 1996.
11. H. L. Van Trees. Detection, estimation, and modulation theory. John Wiley & Sons, New York, 1968. 12. K. J. McCamey, R. Marko, L. Garvin, T. Peli. Detection in clutter enhancement. Proceedings of the SPIE
vol. 2742: 225-235, 1996.
13. T. Peli, P. Monsen, R. Stahl, M. Pauli, K. McCamey. Signal processing improvements for infrared missile warning sensors. Proceedings IEEE 1997, vol. 2: 1052-1064, 1997.
14. R.C. Coutinho, H.A. French, D.R. Selviah, D. Wickramasinghe and H.D. Griffiths. Detection of Coherent Light in an Incoherent Background. Proceedings of the 12th Annual Meeting of the IEEE Lasers and Electro-Optical Society, San Francisco, USA, vol.1, pp. 247-248, 1999.
15. R. C. Coutinho, D.R. Selviah and H.A. French. Detection of Partially Coherent Optical Emission Sources. Optical Pattern Recognition XI, David P. Casasent, Tien-Hsin Chao, Editors, Proceedings of the SPIE Vol. 4043, pp. 238-248, 2000.
16. J. E. Chamberlain. The principles of interferometric spectroscopy. Wiley-Interscience, New York, 1979. 17. R.N. McDonough, A.D. Whalen. Detection of signals in noise. 2nd ed., Academic Press, New York, 1998. 18. E. Hecht. Optics - 3rd edition. Addison-Wesley, New York, 1998.