Environment Independent Speech Recognition System
using MFCC (Mel-frequency cepstral coefficient)
Kamalpreet kaur#1, Jatinder Kaur*2 #1, *2
Department of Electronics and Communication Engineering, CGCTC, Jhanjeri, Mohali, India
Abstract—- Speech recognition is a method of finding similarity between two sequences. Various researches have been done on it. In our research, we are trying to achieve the optimal accuracy during the recognition procedure. Here, we are extracting features of the voice sample before filtering it through a noise reduction filter. For each individual, there are number of features are taken using feature extraction algorithm called mel frequency cepstral co-efficient (MFCC). After extracting the features of all the training samples, we have taken the average. Now extracting the features of the testing sample, similarities are calculated using dynamic time warping . We are comparing the results of frame error, word error of the previous work with our research.
Keywords— Novel method, filtering, MFCC, DTW
I. INTRODUCTION
Advanced handling of discourse flag and voice acknowledgment calculation is critical for quick and precise programmed voice acknowledgment innovation. The voice is a sign of boundless data. A direct examination and combining the complex voice sign is because of as well much data contained in the sign. Consequently the advanced sign methods, for example, Feature Extraction and Feature Matching are acquainted with speak to the voice signal. The voice recognition is the method that calculates an optimal match between two given sequences with certain restrictions is called Dynamic time warping .The method is used to extract the input voice samples is called mel-frequency Capstral Coeffiecient.The sequences are "warped"non-linearly in the time dimension to determine a measure of their similarity independent of certain non-linear variations in the time dimension. The ability of a machine to recognize the spoken words and convert them to any desired form is called voice recognition. A. Novel method
Novel method is used to remove the unwanted noise from input samples.
B. MFCC (mel-frequency Cepstral Coefficients.)
An algorithm used to extract the features of input voice samples input voice samples is called MFCC.
C. DTW (dynamic time warping )
The method is used for measuring similarity between two temporal sequences which may change in time or speed is defined as DTW.
II. PROBLEM FORMULATION
Many researchers have done research on this system, But there are many problems related to this. In a wavelet transform there is no any algorithm used for measuring similarity between two temporal sequences which may vary in time or speed. There is no any technique is used to
of voice samples. It can be focused on improving the efficiency of the speaker recognition by introducing more effective sparsification techniques to reduce the trade-off factor. To overcome these problems we use purposed method which includes MFCC and DTW. Before applying MFCC Algorithm we use novel method to remove the noise. By applying purposed method we will achieved better results than the previous results.
III.RESEARCH METHODOLOGY
A . Flow chart of methodology
Fig. 1.Flow chart of research methodology
B.Research methodology includes three parts:
a. To propose a novel method to reduce the noise and unwanted signals from the input voice samples. b. Purpsed method includes two algorithms
MFCC(mel frequency cepstral co-efficient) : This algorithm is used for the extraction of voice samples and calculated the Frame error rate.
IV. RESULT AND DISCUSSION
we are working on WER (word error) and FER (Frame error) and comparing our results with previous paper In the other hand, the results below are also essential in our work.
Fig.2.Results are essential in work
We are comparing both of the above results in our work. At first, we are taking samples for to train our system. These samples are processed for both noisy and noiseless environments. Each sample category is subdivided to ‘Living room’, ‘Meeting room’, ‘Classroom’ depending on the level of noise present in each of them. We are showing bar graph of the above results.
In each case, we are further implementing feature extraction algorithm and matching algorithm.
The snapshots and characteristic of each is described with it below:
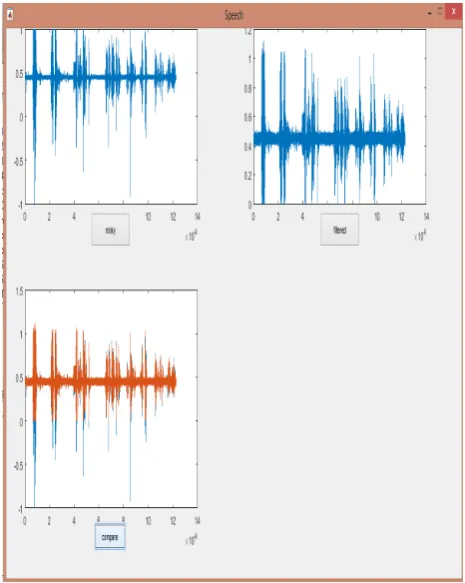
A. Novel Method is purposed to reduce noise and unwanted signals from the input voice samples.the results are shown below in fig.3-fig.5
Fig. 3. Visualization of the sample 1
Fig.4. Import and visualization of the filtered sample
Fig .5. Compare the noisy sample with the de-noised sample
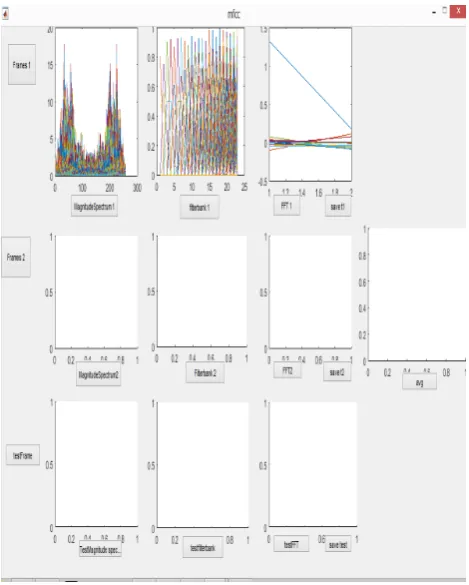
B. Working on feature extraction part ,i,e MFCC. Feature extraction of input samples is defined given below in fig.6-fig.13
Fig .6. Importing training sample 1
Fig .7. Magnitude spectrum, Graphical representation of the tribank filter and Visualization of the fast Fourier transform of training sample 1
Fig.8. Importing Training sample 2
Fig .9. Magnitude spectrum, visualization of filter bank and FFT of sample2
Fig .10. Frame error rate
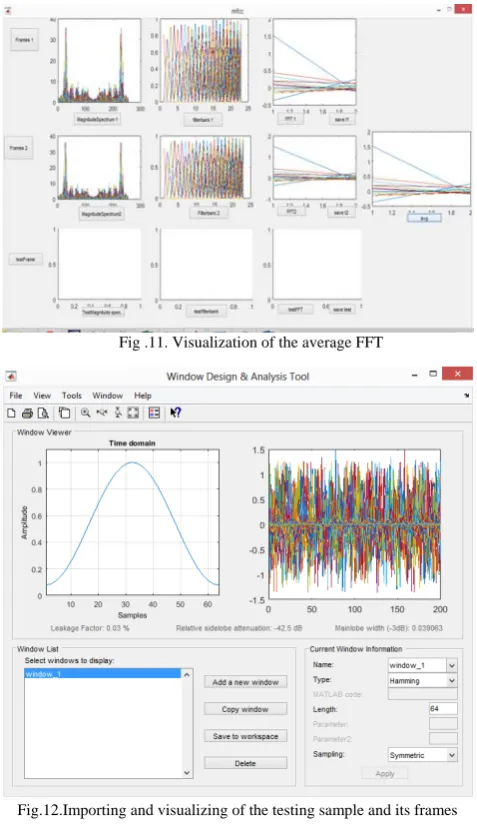
Fig .11. Visualization of the average FFT
Fig.12.Importing and visualizing of the testing sample and its frames
Fig .13. Visualizing the magnitude spectrum,test filter bank and FFT of the testing sample
C. Now we need to calculate the dynamic time warping and need to show the matching results.These are shown below:
Distance matrix and optimal path: The linearity in the graph shows the similarity between the training samples and the testing sample. The graph of warped signals is shown below in fig. 13.
Fig.14. Distance Matrix and optical path
Warped signals are shown below in fig.15
Fig .15. Warped signals
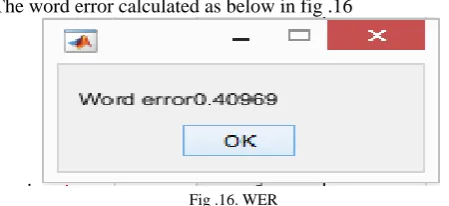
The word error calculated as below in fig .16
.
Fig .16. WER
The tables I. shown below describes the errors we have calculated and proves that our proposed method shows better results the previous one.
TABLE I EXPERIMENT RESULT
V.CONCLUSION
The intention of our research was to deliver a new method on speech recognition which should be independent of background noisy elements. Earlier, there were number of faults found in the speech recognition systems. We tried to minimize the errors using effective feature extraction as well as distance calculation algorithms. We mainly focused on mining the features of the samples while it is denoised to find out the optimum peaks of the sample. We have also made the windowing fix to wrap the signals inside a defined border. The samples were trained. The mean values of the training samples were taken. The testing sample also goes through the same method of feature extraction. The similarity matching part is done using t called dynamic time warping. We have talked over the matching factors by calculating the spectral differences, frame error as well as word error. The samples were trained in diverse locations; noisy and noiseless. They were sectioned into the samples taken in living room, meeting room, classroom. The results presents that our approach exhibits very minimal errors compared to the previous ones.
REFERENCES
[1] Yogesh Kumar Sen, R. K. Chaurasiya. IEEE International
Conference on voice rcoginition-june2014, vol.24, pp.58-95,2014. [2] Daubechies, I, “The wavelet transform, time-frequency localization
andsignal analysis”, IEEE Transformation and Information Theory,vol. 36,pp.961-1005,2014.
[3] Hasan Serhan Yavuz, Hakan Çevikalp, “A wavelet Tour of Signal Processing”, IEEE International Conference on signal processing june, vol.34,pp.19-445,2006.
[4] Tiecheng Yu,“ The Development State of the Voice Identification”, The Development communication world,vol.2,pp.56-59,2005. [5] Dian RetnoAnggraini, “The development of a voice recognition
system based on Principal Component Analysis (PCA) and unsupervised learning algorithm”proceeding on IEEE journal, vol.4,pp.35-58,2012.
[6] Jiqing Han, Lei Zhang, Tieran Zheng,“ Voice Signals
Processing”,[M].Beijing:TsinghuaUniversityPress,vol.3,pp.67-94 2004.
[7] L.R. Rabiner, “A tutorial on Hidden Markov Models and selected applications in Speech Recognition”, Proceedings of the IEEE Journal, Vol. 77, Issue. 2, Feb1989.
[8] Lindasalwa Muda, Mumtaj Begam and Elamvazuthi, “Voice
Recognition Algorithms using Mel Frequency Cepstral Coefficient (MFCC) and DTW Techniques”,Journal of Computing, Volume 2, Issue 3, March 2010.
[9] Remzi Serdar Kurcan, “Isolated word recognition from in-ear microphone data using hidden markov models (hmm)”, Master’s Thesis, 2006.
[10] Suma Swamy, Manasa S, Mani Sharma, Nithya A.S, Roopa K.S and K.V Ramakrishnan,“An Improved Speech Recognition System”,LNICSTspringer journal,2013
[11] Bassam A.Q.Al-Qatab and Raja.N.Aninon, “Arabic Speech
Recognition using Hidden Markov Model ToolKit (HTK)”, IEEE Information Technology (ITSim), pp. 557-562,2010.
[12] Ahsanul Kabir, Sheikh Mohammad Masudul Ahsan, “Vector
Quantization in Text Dependent Automatic Speaker Recognition using Mel- Frequency CepstrumCoefficient”, 6th WSEAS International Conference on circuits, systems, electronics, control & signal processing, Cairo, Egypt, pp. 352-355,2007.
[13] Claude Turner, Anthony Joseph, Murat Aksu, Heather Langdond, “The Wavelet and Fourier Transforms in Feature Extraction for Text-Dependent, Filterbank-Based Speaker Recognition”, Procedia Computer Science,Volume 6, Pages 124–129, 11 October 2011. [14] Mahdi Shaneh and Azizollah Taheri,”Voice Command Recognition
System based on MFCC and VQ Algorithms”, World Academy of Science, Engineering and Technology Journal, 2009.
System Frame error Word error Base paper
(Noisy) 30 11.7
Base paper
(Noiseless) 28.2 12.0
Proposed work
(Noisy) 19.443 2.3838
Proposed work