O R I G I N A L R E S E A R C H
Reproducibility of measurements and variability
of the classi
fi
cation algorithm of Stratus OCT
in normal, hypertensive, and glaucomatous patients
Alfonso Antón1,2,3
Marta Castany1,2
Marta Pazos-Lopez1,2
Ruben Cuadrado3
Ana Flores3
Miguel Castilla1
1Hospital de la Esperanza-Hospital del
Mar (IMAS), Barcelona, Spain;
2Institut Català de la Retina (ICR),
Barcelona, Spain. Glaucoma Department; 3Instituto Universitario
de Oftalmobiología Aplicada (IOBA), Universidad de Valladolid, Valladolid, España
Correspondence: Alfonso Antón Avenida Bogatell 1, 3-2, 08005, Barcelona, Spain
Tel +34 93 367 4159 Fax +34 93 221 7336 Email [email protected]
Purpose: To assess the reproducibility of retinal nerve fi ber layer (RNFL) measurements and the variability of the probabilistic classifi cation algorithm in normal, hypertensive and glauco-matous eyes using Stratus optical coherence tomography (OCT).
Methods: Forty-nine eyes (13 normal, 17 ocular hypertensive [OHT] and 19 glaucomatous) of 49 subjects were included in this study. RNFL was determined with Stratus OCT using the stan-dard protocol RNFL thickness 3.4. Three different images of each eye were taken consecutively during the same session. To evaluate OCT reproducibility, coeffi cient of variation (COV) and intraclass correlation coeffi cient (ICC) were calculated for average thickness (AvgT), superior average thickness (Savg), and inferior average thickness (Iavg) parameters.
The variability of the results of the probabilistic classifi cation algorithm, based on the OCT normative database, was also analyzed. The percentage of eyes with changes in the category assigned was calculated for each group.
Results: The 50th percentile of COV was 2.96%, 4.00%, and 4.31% for AvgT, Savg, and Iavg, respectively. Glaucoma group presented the largest COV for all three parameters (3.87%, 5.55%, 7.82%). ICC were greater than 0.75 for almost all measures (except from the inferior thickness
parameter in the normal group; ICC = 0.64, 95% CI 0.334–0.857).
Regarding the probabilistic classifi cation algorithm for the three parameters (AvgT, Savg, Iavg), the percentage of eyes without color-code category changes among the three images was as fol-lows: normal group, 100%, 84.6% and 92%; OHT group, 89.5%, 52.7%, 79%; and Glaucoma group, 82%, 70.6%, and 76.5%, respectively. A probabilistic category switch from pathologic to normal or vice versa was observed in three eyes (15.8%) of the glaucomatous group for the Savg parameter and in two eyes of the OHT group: one eye (5,9%) for the AvgT and one eye (5.9%) for the Savg parameter.
Conclusions: OCT RNFL measurements showed a good reproducibility in normal, OHT, and glaucoma eyes. The probabilistic classifi cation for the three main parameters showed certain variability, especially in glaucoma group and OHT group. Therefore, one isolated category result should be interpreted with caution before clinical classifi cation of the patient.
Keywords: optical coherence tomography, glaucoma, nerve fi ber layer, algorithm classifi cation, reproducibility
Introduction
Primary open-angle glaucoma (POAG) is an acquired progressive optic neuropathy, characterized by damage of retinal ganglion cells leading to loss of visual function.1
In clinical practice, the diagnosis of POAG and determination of glaucomatous progression are based on a characteristic appearance of the optic disc2 and typical visual
fi elds (VF) changes. There is evidence of a quantitative structure–function relation-ship,3 but this is not lineal and a relatively large proportion of ganglion cells must be
lost before the changes exceed the normal variability. In fact, only after 25% to 35%
Clinical Ophthalmology downloaded from https://www.dovepress.com/ by 118.70.13.36 on 21-Aug-2020
Antón et al
of ganglion cells have died a statistically signifi cant visual fi eld abnormality occurs.4 In this regard, some devices such
as optical coherence tomography (OCT) have been developed in order to detect and quantify early retinal nerve fi ber layer (RNFL) loss.
The third generation OCT, Stratus OCT (software version A2, Carl Zeiss Meditec Inc, Dublin, CA), is a noncontact and noninvasive imaging technique that obtains cross-sectional images of the retina with a resolution of 8–10 μm.5 Several
studies have reported that the Stratus OCT with its internal normative database shows high sensitivity and specifi city for diagnosing glaucoma.6–8 Recently, screening capability
of Stratus OCT 3 for diagnosing early glaucoma has also been evaluated,9 obtaining a moderate sensitivity with high
specifi city.
The following step to assess the clinical usefulness of an imaging device consists on determining its ability to detect progression, which is strongly dependent on the reproduc-ibility of the measurements obtained. No imaging device or functional test can detect changes that are smaller than its particular variability. Different studies have already evalu-ated the reproducibility of RNFL measurements using the previous generations of OCT10,11 and the Stratus OCT12–14
demonstrating excellent and only slightly different reproduc-ibility results for both instruments.
Moreover, the Stratus OCT software allows the compari-son of the RNFL thickness with a normative database and offers an automatic classifi cation of each parameter in four color-code categories: a white band (5% of normal population falls inside), a green band (90% of normal population falls inside), a yellow band (4% of normal population falls inside) and a red band (1% of normal population falls inside). Clini-cally, the white band is considered over normal limits, the green band inside normal limits, the yellow band borderline, and the red band outside normal limits. Since this color-coded classifi cation is widely used in clinical practice as a comple-mentary tool to diagnose and follow-up ocular hypertensive (OHT), glaucoma suspects, and glaucoma patients, it is useful and pertinent to know the variability of this classifi cation. The assessment of intraobserver and intrasession variability allows the evaluation of the instrument in steady conditions diminishing the potential infl uence of other external factors such as patient conditions, operator, or the disease itself. To the best of our knowledge the variability of the color-code classifi cation implemented in the currently available instru-ment, has not yet been reported.
The purpose of this study is to determine the intraobserver and intrasession reproducibility of RNFL measurements and
the variability of the probabilistic classifi cation algorithm offered by OCT Stratus for normal, OHT, and glaucoma patients.
Material and methods
Design
Cross-sectional study with prospective sampling.
Subjects
Forty-nine patients were consecutively recruited from the outpatient ophthalmic clinic. Informed consent was obtained from all participants and the study was approved by the Ethi-cal Committee of Universidad de Valladolid.
Three groups of subjects were enrolled in our study: normal, OHT, and glaucoma. One eye per patient (right eye) was selected for inclusion, with the exception of cases in which only one eye met our inclusion criteria. All subjects underwent a complete ophthalmic evaluation, including visual acuity testing, intraocular pressure measured by Goldman applanation tonometry, anterior biomicroscopy, gonioscopy, and posterior segment biomicroscopy under dilation (two drops 1% tropicamide ) and optic nerve head photography (Topcon IMAGEnet™ 2000 FA/ICG System, Topcon American Corporation, NJ).
Visual fi elds were performed with the Humphrey Visual Field Analyzer (Carl Zeiss Meditec, CA, USA) using 24–2 SITA Standard protocol. Inclusion criteria for normal subjects were a best-corrected visual acuity of 20/30 or better, intraocular pressure (IOP) under 21 mmHg, normal visual fi eld, normal appearing optic nerve head and absence of any ophthalmic diseases except for mild cataract. OHT patients had a best-corrected visual acuity of 20/30 or better, IOP over 21 mmHg on more than two occasions, normal slit-lamp examination, normal visual fi eld, normal optic disc, and no evidence of other ophthalmic diseases. A normal visual fi eld was defi ned as a mean deviation (MD) and pat-tern standard deviation (PSD) within 95% confi dence limits and a glaucoma hemifi eld test result “within normal limits”. Glaucoma patients were included if basal IOP was over 21 mmHg on more than two occasions and optic nerve and visual fi eld were glaucomatous. Optic nerve was considered glaucomatous if a rim notch, cup-to-disc ratio ⬎0.7 with alteration of inferior superior nasal temporal (ISNT) rule, disc hemorrhage, or RNFL defect were detected. Visual fi eld was defi ned as glaucomatous according to Anderson’s criteria,15 in which at least one of the following was present:
1) a cluster of at least three points in the pattern deviation probability plot, located in areas typical of glaucoma, having
Clinical Ophthalmology downloaded from https://www.dovepress.com/ by 118.70.13.36 on 21-Aug-2020
Reproducibility of the classifi cation algorithm of Stratus OCT
a probability level of p ⱕ 5%, with at least one point having a probability level of p ⱕ 1%; 2) a PSD with a probability level of p ⱕ 5%, and 3) glaucoma hemifi eld test results out-side normal limits. This condition had to be present in two consecutive reliable visual fi elds. Reliable criteria for visual fi elds include false–positive and false–negative responses of ⬍25% and fi xation losses of ⬍20%.
Exclusion criteria included: Subjects who presented a best-corrected visual acuity worse than 20/30, angle abnor-malities on gonioscopy, other intraocular eye diseases (secondary glaucoma, diabetic retinopathy, age-related macular degeneration, acute anterior segment diseases, etc), other diseases affecting the visual fi elds or history of intra-ocular surgery (except from uncomplicated cataract surgery). Subjects with unreliable visual fi elds or without good quality OCT images were not eligible.
OCT measurements
All eyes were scanned with Stratus OCT (model 3000, soft-ware version A2, Carl Zeiss Meditec Inc, Dublin, CA) using the protocol that measures RNFL thickness at a circumfer-ence of 3.4 mm in diameter centered at the disc by a single operator. Image acquisition was performed as follows: pupils were dilated with two instillations of 1% tropicamide; the subject received fi xation instructions; the 3.4 mm scan-circle was positioned around the disc by an experienced opera-tor and fi nally, the image was acquired and saved. Three different OCT images using Standard RNFL Scan protocol were obtained during the same visit, without breaks between each measurement. The quality of the image was checked by an independent observer using the following criteria: the fundus image had to be centered and clear enough to see the optic disc and the scan circle; the different retinal layers needed to be present in the image, specifi cally the red color band of RPE and RNF had to be visible, with no missing or blank area in the scan pattern. The OCT images were auto-matically analyzed with the Straus OCT software (v. A2) to
quantitatively assess retinal morphology. RNFL thickness was assessed globally (0°–359°) and in two retinal regions: superior (46°–135°) and inferior (226°–315°).
Statistical analysis
A repeated-measures analysis of variance was performed for each of the three RNFL parameters (superior average, inferior average, and average thickness). We determined the intraclass correlation coeffi cient (ICC) and coeffi cient of variation (COV) as measures of reproducibility for each variable and group. COV was calculated using the standard deviation divided by the mean thickness and compared among the groups with Wilcoxon/Kruskall–Wallis Test. The ICC was the ratio between the intersubject component of the variance to the total variance. Linear regression analysis was performed to assess the correlation between age and RNFL measurements of reproducibility. Finally, the percentage of cases of the three groups with changes observed in OCT probabilistic classifi cation algorithm was calculated for each parameter.
Results
Forty-nine eyes of 49 patients, 13 normal eyes, 17 OHT, and 19 with glaucoma were included in this study. There were 26 women and 23 men.
The mean (±SD) age of the normal group was 54.17 ± 13.03 years, for OHT group was 57.88 ± 13.44 years, and for the glaucoma group was 64.72 ± 14.38 years (non-statistically signifi cant differences).
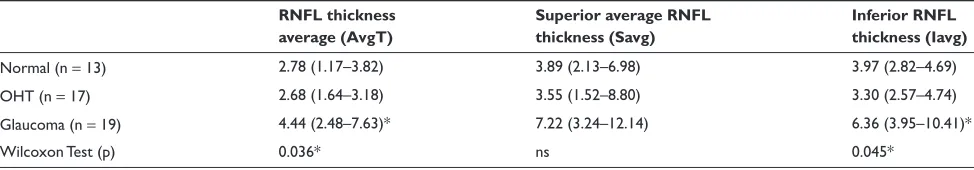
Mean RNFL thickness (±SD) in the three groups was signifi cantly thinner in glaucomatous eyes, 58.88 (±21.31) microns compared to 87.13 (±9.60) microns in OHT eyes and 91.82 (±10.24) microns in normal eyes (p ⬍ 0.001). RNFL thickness COVs for normal, OHT, and glaucoma-tous eyes are presented in Table 1. The 50th percentile of global COV was 2.96%, 4.00%, and 4.31% for average thickness (AvgT), superior average thickness (Savg) and
Table 1 Coeffi cient of variation by diagnosis (%) RNFL thickness average (AvgT)
Superior average RNFL thickness (Savg)
Inferior RNFL thickness (Iavg)
Normal (n = 13) 2.78 (1.17–3.82) 3.89 (2.13–6.98) 3.97 (2.82–4.69)
OHT (n = 17) 2.68 (1.64–3.18) 3.55 (1.52–8.80) 3.30 (2.57–4.74)
Glaucoma (n = 19) 4.44 (2.48–7.63)* 7.22 (3.24–12.14) 6.36 (3.95–10.41)*
Wilcoxon Test (p) 0.036* ns 0.045*
Notes: 50th percentile coeffi cient of variations with quartile 1 and quartile 3 in parenthesis; *Indicate values that are signifi cantly different of this group compared to the other two groups.
Abbreviations: OHT, ocular hypertension; RNFL, retinal nerve fi ber layer.
Clinical Ophthalmology downloaded from https://www.dovepress.com/ by 118.70.13.36 on 21-Aug-2020
Antón et al
inferior average thickness (Iavg), respectively. When we looked at potential differences of COV among groups using the Wilcoxon/Kruskal–Wallis test, we found that COV was signifi cantly higher among glaucoma eyes than in the other two groups for AvgT and Iavg, but not for Savg (p = 0.036, p = 0.045, p ⬎ 0.05, respectively). We also analyzed the potential relation between age and COV with Spearman test and we found statistically signifi cant linear correlation (p ⬍ 0.05) for Savg and Iavg (r = 0.379 and r = 0.336, light correlation).
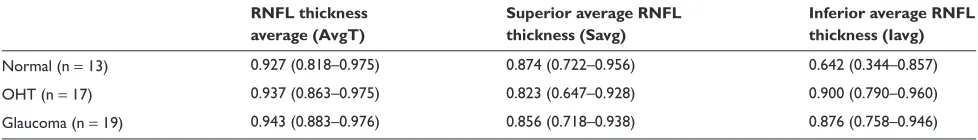
The ICCs for normal, OHT and glaucomatous eyes are presented in Table 2. ICCs were greater than 0.75 for almost all measures (except for the Iavg in the normal group; ICC = 0.64, 95% CI 0.334–0.857) and most were in the 0.80 to 0.90 range or higher.
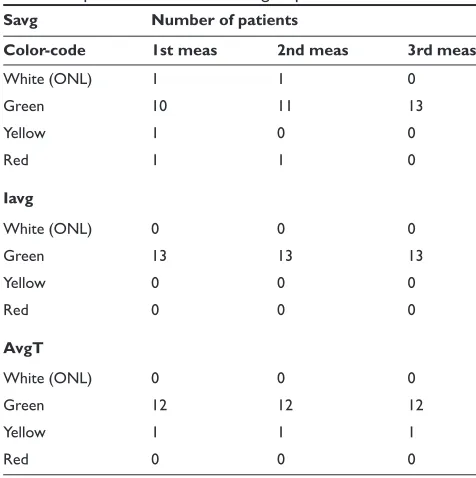
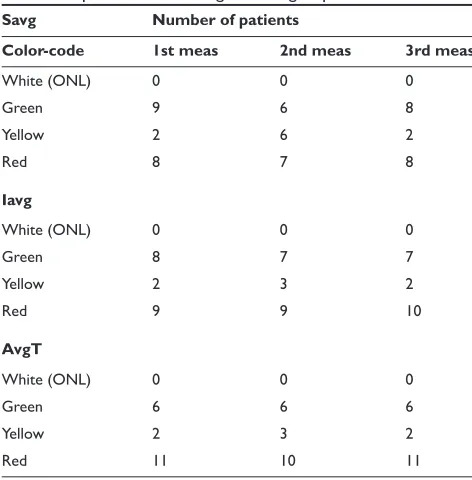
The distribution of the color code classifi cation in our three groups is shown in Table 3a, 3b, and 3c. In the normal and hypertensive group the most frequently observed category was green, while in the glaucoma group the color mostly showed by our patients was red. In the normal group we didn’t fi nd any patient with a red category in any param-eter, but we found two measurements with red category in the hypertensive group, one for SAvg parameter and one for AvgT parameter, respectively.
We also studied the variability of this probabilistic classifi cation performed by the OCT3 algorithm. Regarding AvgT parameter (Table 4a), in the normal group we didn’t fi nd any patient with a category change. In the OHT group and in the glaucoma group we found changes of one category (green to yellow or yellow to red, or vice versa) in 11.8% and 10.6% of patients, respectively. We also found a two-category switch (green to red or vice versa) in one patient from 17 of the OHT group. When we analyzed the Savg parameter (Table 4b) we found a high percentage of changes in the color-coded classifi cation in the glaucoma group: 31.6% of patients had a change of one category and 15.8% of two categories. The OHT group showed one category change in 23.6% of patients and two category changes in one patient. The normal group didn’t have category changes in 84.6% of
the patients. For the Iavg parameter (Table 4c), in the normal group the category classifi cation didn’t change in 92.3% of the patients. We observed one category change in 23.6% and 15.8% of patients for the OHT group and for the glaucoma group, respectively. The only change of two categories for the Iavg parameter was found in a patient from the glaucoma group (5.3%).
Discussion
Although OCT3 can measure RNFL thickness at a resolu-tion of 8 to 10 microns with established validity, its role in diagnosis of early glaucoma and in detection of progression is not clearly defi ned.
Reproducibility of RNFL measurements is the base for the applicability of Stratus OCT as a diagnostic tool in clini-cal practice. Several studies have evaluated the reproduc-ibility of Stratus OCT.12–14 Budenz and colleagues12 showed
high intraobserver and intrasession reproducibility of OCT RNFL thickness measurements, using a very similar method of image acquisition to the one applied in our study (three scans per patient during the same day) but with different inclusion criteria for the glaucoma group (it also included suspected glaucoma eyes). In this study, the ICC results were similar in normal and glaucomatous eyes and, although they obtained better results with standard scan than with fast scan protocol, even the lowest ICC (95% CI) was greater than 0.70 indicating excellent reproducibility of all measure-ments. We have obtained similar ICC results in almost all parameters, except for the inferior sector of normal group (ICC = 0.64, 95% CI 0.334–0.857); this difference could be attributed to the lower sampling of our study (49 versus 157 patients). In fact, Gurses-Ozden and colleagues16 showed
that reproducibility of RNFL measurements can be improved by increasing the sampling density or number of scans per-formed. In another reproducibility study performed with only ten normal eyes,13 the values of ICC obtained were of 0.83,
which are moderately lower, possibly due to the few number of patients included and to the fact that they measured the RNFL on three occasions that could be up to fi ve months
Table 2 Intraclass correlation coeffi cient by diagnosis RNFL thickness average (AvgT)
Superior average RNFL thickness (Savg)
Inferior average RNFL thickness (Iavg)
Normal (n = 13) 0.927 (0.818–0.975) 0.874 (0.722–0.956) 0.642 (0.344–0.857)
OHT (n = 17) 0.937 (0.863–0.975) 0.823 (0.647–0.928) 0.900 (0.790–0.960)
Glaucoma (n = 19) 0.943 (0.883–0.976) 0.856 (0.718–0.938) 0.876 (0.758–0.946)
Notes: ICCs, with lower 95% CI and higher 95% CI in parenthesis.
Abbreviations: CI, confi dence interval; ICC, intraclass correlation; OHT, ocular hypertension; RNFL, retinal nerve fi ber layer.
Clinical Ophthalmology downloaded from https://www.dovepress.com/ by 118.70.13.36 on 21-Aug-2020
Reproducibility of the classifi cation algorithm of Stratus OCT
apart. Whether fi ve months as a relatively short period of time is suffi cient or not to allow signifi cant RNFL thickness changes or if other factors are also responsible for the greater variability is not clear.
Although reproducibility of any device is indispensable, clinically we are concerned about the capability of the OCT to differentiate glaucoma versus normal patients, especially in early stages. OCT diagnostic accuracy depends on the comparison of the individual results with its database. Different studies have demonstrated the capability of differentiating healthy from glaucomatous eyes using an earlier-version OCT,8,17,18,19 and OCT Stratus6,8,9,20,21 to analyze
the sensitivity parameter. This sensitivity depends also on the disease stage of the glaucoma. In fact, Kim and colleagues20
demonstrated that in preperimetric RNFL damage Stratus OCT has a low sensitivity for almost all parameters. The highest sensitivity was only 40.8% and was achieved using the parameter of one hour abnormal at the 5% level. This study had a low sensitivity in contrast with previous studies with manifest VF defects.6
In clinical practice we use the color-coded classifi cation that allows a quicker, more intuitive and more convenient RNFL evaluation than the absolute micron thickness. Theo-retically, this algorithm classifi cation should be able to detect structural injury preceding visual fi eld defects and should be useful to detect some kind of structural progression, but this,
of course, will depend on its particular reproducibility and variability. Therefore, the following crucial step is to assess the reproducibility of the probabilistic classifi cation which depends on two main factors. Firstly, the proximity of each individual thickness value to the border of the category in which it fell. The algorithm uses specifi c cut points to classify a certain value as normal, borderline or glaucoma compar-ing it with a normative database. This normative database was derived from a measurement of 328 normal subjects comprising 205 (63%) white, 79 (24%) hispanic, 27 (8%) black, and 11 (3%) asian people and it is very important since the OCT classifi cation algorithm is based on it.5 This factor
is equally important and present in any device with a clas-sifi cation algorithm based in probabilistic criteria. Secondly, the variability of the measurements given by the instrument, this is specifi c for each imaging device. If the variability is large, the range of thickness measurements obtained is wider and the chance that those values have of jumping from one side of the cut-point to the other is proportionally greater, so then the comparison to the normative database and its probabilistic classifi cation would be variable and clinically less useful. Ideally, clinicians would like an instrument that always assigns the same category to a certain eye unless signifi cant progression occurs.
In our study, the AvgT was the most stable parameter in the color-code classifi cation for all the groups. In contrast,
Table 3a Color-code distribution for the three different measure-ments and parameters in the normal group
Savg Number of patients
Color-code 1st meas 2nd meas 3rd meas
White (ONL) 0 0 1
Green 15 16 14
Yellow 2 1 1
Red 0 0 1
Iavg
White (ONL) 0 1 1
Green 15 16 14
Yellow 2 0 2
Red 0 0 0
AvgT
White (ONL) 0 0 1
Green 16 17 15
Yellow 1 0 0
Red 0 0 1
Abbreviations: AvgT, average thickness; Iavg, inferior average; meas, measurements; Savg, superior average; ONL, over normal limits.
Table 3b Color-code distribution for the three different measure-ments and parameters in the OHT group
Savg Number of patients
Color-code 1st meas 2nd meas 3rd meas
White (ONL) 1 1 0
Green 10 11 13
Yellow 1 0 0
Red 1 1 0
Iavg
White (ONL) 0 0 0
Green 13 13 13
Yellow 0 0 0
Red 0 0 0
AvgT
White (ONL) 0 0 0
Green 12 12 12
Yellow 1 1 1
Red 0 0 0
Abbreviations: AvgT, average thickness; Iavg, inferior average; meas, measurements; Savg, superior average; ONL, over normal limits.
Clinical Ophthalmology downloaded from https://www.dovepress.com/ by 118.70.13.36 on 21-Aug-2020
Antón et al
Savg was the most variable parameter for all the groups, having the highest percentage of changes in two categories. When we analyzed the variability results for the different groups, we found that the normal group is the one that presented less category changes for any parameter. Glaucoma and OHT groups were more variable, only 52.7% of glau-coma patients were stable in their color-code category for the Savg parameter, three glaucomatous patients changed two categories for the Savg parameter, and one patient changed two categories for the AvgT parameter. Regarding the OHT group, we found changes in one category in four patients for the superior parameter and in four patients for the inferior parameter and in two categories in one patient for the supe-rior parameter and in one patient for the infesupe-rior parameter. Such changes could refl ect worsening, or even theoretical improvement, of the disease or may also be a consequence of instrument–algorithm variability. In the present study, since all three images were taken on the same day, the most likely explanation is the last one, although some variation in patient position between scans and the scan circle placement should be considered. A relatively frequent variation of categories exists at a short term, especially in glaucoma and OHT group, being this last one also very variable because of its intermediate situation that could include some preperimetri-cal glaucomas. One explanation for this variability could be the characteristic probabilistic database distribution, with
Table 3c Color-code distribution for the three different measure-ments and parameters in the glaucoma group
Savg Number of patients
Color-code 1st meas 2nd meas 3rd meas
White (ONL) 0 0 0
Green 9 6 8
Yellow 2 6 2
Red 8 7 8
Iavg
White (ONL) 0 0 0
Green 8 7 7
Yellow 2 3 2
Red 9 9 10
AvgT
White (ONL) 0 0 0
Green 6 6 6
Yellow 2 3 2
Red 11 10 11
Abbreviations: AvgT, average thickness; Iavg, inferior average; meas, measurements; Savg, superior average; ONL, over normal limits.
Table 4a Variability of color-coded classifi cation for average thickness parameter: category changes (number of patients in parenthesis)
No changes 1 category 2 categories
Normal (n = 13) 100% (13) 0% (0) 0% (0) OHT (n = 17) 82.4% (14) 11.8% (2) 5.9% (1) Glaucoma (n = 19) 89.5% (17) 10.6% (2) 0% (0) All eyes (n = 49) 89.8% (44) 8% (4) 2% (1)
Abbreviation: OHT, ocular hypertension.
Table 4b Variability of color-coded classifi cation for superior thickness parameter: category changes (number of patients in parenthesis)
No changes 1 category 2 categories
Normal (n = 13) 84.6% (11) 7.7% (1) 7.7% (1) OHT (n = 17) 70.6% (12) 23.6% (4) 5.9% (1) Glaucoma (n = 19) 52.7% (10) 31.6% (6) 15.8% (3) All eyes (n = 49) 67.3% (33) 22.2% (11) 10.1% (5)
Abbreviation: OHT, ocular hypertension.
Table 4c Variability of color-coded classifi cation for inferior thickness parameter: category changes (number of patients in parenthesis)
No changes 1 category 2 categories Normal (n = 13) 92.3% (12) 7.7% (1) 0% (0) OHT (n = 17) 76.5% (13) 23.6% (4) 0% (0) Glaucoma (n = 19) 79% (15) 15.8% (3) 5.3% (1) All eyes (n = 49) 81.5% (40) 16.2% (8) 2% (1)
Abbreviation: OHT, ocular hypertension.
a wide range of RNFL thickness micron values inside the 95% of normality, a narrow range for pathologic thickness measurements and even a narrower range for borderline ones. So, if the individual result falls close enough to the category cut-point, it is more likely that a small quantitative change may imply a big qualitative change: a category switch. In this regard, our study has two limitations: fi rst, the fact that the three images were taken on the same day and by the same operator may underestimate the variability found in clinical practice; second, at the time of the study the signal strength algorithm was not implemented in our instrument and for this reason it could not be used for image quality assessment. Nevertheless, quality assessment was carefully performed with the method described above.
Since there is considerable intra-session variability in the classifi cation algorithm, we have to be cautious when, at longer term, we fi nd a change in the classifi cation from
Clinical Ophthalmology downloaded from https://www.dovepress.com/ by 118.70.13.36 on 21-Aug-2020
Reproducibility of the classifi cation algorithm of Stratus OCT
normal to borderline or outside normal limits that could be interpreted as progression of the disease. For this reason, one isolated category result should be interpreted with caution before clinical classifi cation of the patient and a specifi c follow-up algorithm is needed to adequately assess RNFL thickness over time with Stratus OCT.
The found variability in the probabilistic classifi cation algorithm is compatible with a good reproducibility of RNFL thickness measurements and its clinical usefulness, but warrants caution when interpreting its results and supports the recommendation of confi rming results with more than one image. The specifi c number of images that is needed to confi rm the results would require another study with a different design.
Disclosure
The authors received fi nancial support from Asociación para la Investigación en Glaucoma. None of the authors have any proprietary interest.
References
1. Quigley HA. Neuronal death in Glaucoma. Prog Retin Eye Res. 1999;18:39–57.
2. Jonas JB, Budde WM, Panda-Jonas S. Ophthalmoscopic evaluation of the optic nerve head. Surv Ophthalmol. 1999;43:293–320.
3. Harwerth RS, Quigley HA. Visual fi eld defects and retinal ganglion cell losses in patients with glaucoma. Arch Ophthalmol. 2006;124:853–859. 4. KerriBaumrind LA, Quigley HA, Pease ME, et al. Number of gan-glion cells in glaucoma eyes compared with threshold visual fi eld tests in the same persons. Invest Ophthalmol Vis Sci. 2000;41:747–748. 5. Stratus OCT User Manual. 2002 Dublin, CA. Carl Zeiss Meditec; PN
55648 REV. A 4/03, 1-1-1-3.
6. Budenz DL, Michael A, Chang RT, et al. Sensitivity and specifi city of the StratusOCT for perimetric glaucoma. Ophthalmology. 2005;112:3–9. 7. Hoeing JW, Park KH, Kim TW, et al. Diagnostic ability of optical
coher-ence tomography with a normative database to detect lolalized retinal nerve fi ber layer defects. Ophthalmology. 2005;112:2157–2163.
8. Hougaard JL, Heijl A, Bengston B. Glaucoma detection using different Stratus optical coherence tomography protocols. Acta Ophthalmol Scand. 2007;85:251–256.
9. Parikh RS, Parikh S, Sekhar GC, et al. Diagnostic capability of optical coherence tomography (Stratus OCT 3) in early glaucoma. Ophthalmology. 2007;114:2238–2243.
10. Schuman JS, Hee MR, Puliafi to CA, et al. Quantifi cation of nerve fi ber thickness in normal and glaucomatous eyes using optical coherence tomography: a pilot study. Arch Ophthalmol. 1995;113:586–596. 11. Blumenthal EZ, Williams JM, Weinreb RN, Girkin CA, Berry CC,
Zangwill LM. Reproducibility of nerve fi ber layer thickness measure-ments by use of optical coherence tomography in normal and glauco-matous eyes. Ophthalmology. 2003;110:190–195.
12. Budenz DL, Chang RT, Huang X, et al. Reproducibility of retinal nerve fi ber thickness measurements using the Stratus OCT in normal and glaucomatous eyes. Invest Opthalmol Vis Sci. 2005;46:2440–2443. 13. Paunescu LA, Schuman JS, Price LL, et al. Reproducibility of nerve
fi ber layer thickness and optic nerve head measurements using Stratus OCT. Invest Ophthalmol Vis Sci. 2004;45:1716–1724.
14. Schuman JS, Pedut-Kloizman T, Hertzmark E, et al. Reproducibility of nerve fi ber layer thickness measurements using optical coherence tomography. Ophthalmology. 1996;103:1889–1898.
15. Anderson DR, Patella VM. Automated Static Perimetry. St. Louis, MO: Mosby; 1999. p. 152.
16. Gurses-Ozden, Ishikawa H, Hoh St, et al. Increasing sampling density improves reproducibility of optical coherence tomography measure-ments. J Glaucoma. 1999;8:238–241.
17. Bowd C, Weinreb RN, Wiliams JM, et al. The retinal nerve fi ber layer thickness in ocular hypertensives, normal and glaucomatous eyes with optical coherence tomography. Arch Ophthalmol. 2000;118:22–26. 18. Greaney MJ, Hoffman DC, Garway-Heath DF, et al. Comparison of
optic nerve imaging methods to distinguish normal eyes from those with glaucoma. Invest Ophthalmol Vis Sci. 2002;43:140–145. 19. Nouri-Madahvi K, Hoffman D, Tannenbaum DP, Law SK, Caprioli J.
Identifying early glaucoma with optical coherence tomography. Am J Ophthalmol. 2004;137:228–235.
20. Kim T, Park U, Park K, Kim DM. Ability of Stratus OCT to identify localized retinal nerve fi ber layer defects in patients with normal standard automated perimetry results. Invest Ophthalmol Vis Sci. 2007;48:1635–1641.
21. Anton A, Moreno-Montañes J, Blázquez F, Álvarez A, Martín B, Molina B. Usefulness of optical coherence tomography parameters of the optic disc and the retinal nerve fi ber layer to differentiate glaucomatous, ocular hypertensive, and normal eyes. J Glaucoma. 2007;16:1–8.
Clinical Ophthalmology downloaded from https://www.dovepress.com/ by 118.70.13.36 on 21-Aug-2020
Clinical Ophthalmology downloaded from https://www.dovepress.com/ by 118.70.13.36 on 21-Aug-2020