Article
Machine Learning Algorithm’s Measurement and
Analytical Visualization of
User’s Reviews for Google
Play Store
Abdul Karim1, Azhari Azhari1, Samir Brahim Belhaouri2, * and Ali Adil Qureshi3
1 Department of Computer Science and Electronics, University Gadjah Mada, Yogyakarta, Indonesia;
[email protected]; [email protected]
2 Division of Information & Computer Technology, College of Science & Engineering, Hamad Bin Khalifa
University, Doha, Qatar ; [email protected]
3 Department of Computer Science, Khwaja Fareed University of Engineering & Information Technology,
Rahim Yar Khan, Pakistan; [email protected]
* Correspondence: [email protected]
Abstract: The fact is quite transparent that almost everybody around the world is using android apps. Half of the population of this planet is associated with messaging, social media, gaming, and browsers. This online marketplace provides free and paid access to users. On the Google Play store, users are encouraged to download countless of applications belonging to predefined categories. In this research paper, we have scrapped thousands of users reviews and app ratings. We have
scrapped 148 apps’ reviews from 14 categories. We have collected 506259 reviews from Google play
store and subsequently checked the semantics of reviews about some applications form users to determine whether reviews are positive, negative, or neutral. We have evaluated the results by using different machine learning algorithms like Naïve Bayes, Random Forest, and Logistic Regression algorithm. we have calculated Term Frequency (TF) and Inverse Document Frequency (IDF) with different parameters like accuracy, precision, recall, and F1 and compared the statistical result of these algorithms. We have visualized these statistical results in the form of a bar chart. In this paper, the analysis of each algorithm is performed one by one, and the results have been compared. Eventually, We've discovered that Logistic Regression is the best algorithm for a review-analysis of all Google play store. We have proved that Logistic Regression gets the speed of precision, accuracy, recall, and F1 in both after preprocessing and data collection of this dataset.
Keywords: machine learning; preprocessing; semantic analysis; text mining; TF/IDF; scraping; Google Play Store
1. Introduction
The essential task of natural language processing is the classification of text strings or
documents into different categories that are the part of this process, which depends upon the content of the string. Text classification has a variety of application s, including detection of user
sentiments on comments or tweets, classification of an email as spam. Presently, text classification has gained vital importance in organizing online information [1]. User reviews and
the mobile program ecosystem have an abundance of information regarding expectations and user experience. Programmers and app store regulators can leverage the data to better
understand their audience. App stores enable users to search for, buy and install programs that are mobile and give comments in the form of evaluations and reviews. The rapid increase in the
number of applications and complete app store earning has accelerated opinion aggregation studies and app store data mining. There are now some academic studies centered on user
testimonials and mobile program stores, in addition to studies analyzing online product reviews. In this article, we used various algorithms, and text classification techniques with android app
reviews[2]. Application distribution platforms, or app stores, allow users to search, buy, and deploy software apps for mobile devices with a few clicks. These platforms also allow users to
share their opinion about the app in text reviews, where they can, e.g., express their satisfaction with a specific app feature or request a new feature [3]. Recent empirical studies have shown that
app store reviews include information that is useful to analysts and documentation of user experiences with specific app features. This feedback can represent the "voice of the users" and
be used to drive the development effort and improve forthcoming releases [4]. The main points of this research are the following:
1. We have scrapped recent android application reviews by using the scrapping technique. 2. The raw data we have scrapped from the Google Play store and we collect this data in
chunks and normalized the dataset for our analysis.
3. We have compared the accuracy of various machine learning algorithms and find the best algorithm according to the results.
4. Algorithms can check the polarity of sentiment based on review is positive, negativ e, and neutral as well as we can prove this using the word cloud corpus.
Text mining also referred to as text data mining, roughly equivalent to text analytics, is the process of deriving high-quality information from text. High-quality information is typically derived through the devising of patterns and trends using statistical pattern learning [5]. Text mining usually involves the process of structuring the input text parsing, along with the addition of some derived linguistic features and the removal of others, and subsequent insertion into a database, deriving patterns within the structured data, and finally evaluation and interpretation of the output [6]. 'High quality' in text mining usually refers to some combination of relevance, novelty, and interest. Typical text mining tasks include text categor ization, text clustering, concept/entity extraction, production of granular taxonomies, sentiment analysis, document summarization, and entity relation modeling, i.e., learning relations between named entities [7].
There are several limitations which prevent analysts and development teams from using the information in the reviews. First, app stores include many reviews, which r equire a significant effort to be analyzed. A recent study has confirmed that iOS users submit on average, 22 reviews per day per app [8]. Top-rated apps, such as Facebook get more than 4000 reviews per day. Second, the quality of the reviews varies widely, from helpful advice to sardonic comments. Third, a review is nebulous, concerning different app features, making it challenging to filter positive and negative feedback or retrieve the feedback for specific features. The usefulness of the star ratings in the reviews is limited for development teams since a rating represents an average for the whole app and can combine both positive and negative evaluations of the single features [9].
specific to linguistic and cultural contexts, to the extent that such a project is possible [10]. The elements of idiom and figurative speech, being cultural, are often also converte d into relatively invariant meanings in semantic analysis. Semantics, although related to pragmatics, is distinct in that the former deals with word or sentence choice in any given context, while pragmatics consider the unique meaning derived from context or tone. In different terms repetition, semantics is about universally coded meaning, and pragmatics, the meaning encoded in words that are then interpreted by an audience [11].
In information retrieval, TF/IDF, short for Term Frequency-Inverse Document Frequency, is a numerical statistic that is intended to reflect how important a word is to a document in a collection or corpus. It is often used as a weighting factor in searches of information retrieval, text mining, and user modeling. The TF/IDF value increases proportionally to the number of times a word appears in the document and the number of documents in the corpus that contain the word, which helps to adjust for the fact that some words appear more frequ ently in general [12]. TF/IDF is one of the most popular term-weighting schemes today; 83% of text-based recommender systems in digital libraries use TF/IDF. Using of common words in TF/IDF e.g., articles receive a significant weight even if they contribute no real information about common words. In TF/IDF, the more familiar a word is in the corpus, the smaller weight it receives. Thus, common words like articles receive small weights but rare words, that it is assumed to carry more information, receive larger weights [13].
Beautiful Soup is a Python library for pulling data out of HTML and XML files. It works with the favorite parser to provide idiomatic ways of navigating, searching and modifying the parse tree [14]. RE-module is the core of text processing. The RE-module provides sophisticated ways to create and use regular expressions [15]. A regular expression is a kind of formula that
specifies patterns in text strings. The name “regular expression” comes from the earlier
mathematical treatment of “regular sets. We are still stuck with the phrase. Regular expressions
give us a simple way to specify a set of related strings by describing the pattern they have in common. We write a pattern to summarize some set of matching strings. This pattern string can be compiled into an object that efficiently determines if and where a given string matches the pattern [16, 17].
2. Literature Review
Regarding user satisfaction, authors can observe that, despite the star rating being a good measure of evaluation, the Sentiment Analysis technique is more precise in capturing the sentiment transmitted by the user using comment [19].
Authors discussed Sentiment Analysis of App Reviews. In this study, result shows sentiment analysis of App Reviews approaches that is helpful for the developers. With these approaches, the developer can accumulate, filter, and examine user reviews. In this research, use of simple language techniques to recognize fine-grained app features in the reviews. In this extract, the user gives an opinion about the recognized features by giving a typical score to all reviews [20]. By using topic modeling techniques, authors can group fine-grained features into more comfortable and meaningful features. Authors compared the result and analyzed the 7 applications taken from the Apple app store and Google play store. In this way, the app developer can systematically examine the user opinion about a single feature and filter view. Authors got the accuracy of up to 91% and recall up to 73% [21].
Text mining techniques have been recently employed to classify and summarize user reviews on mobile application stores. However, due to the inherently diverse and unstructured nature of user-generated online textual data, text-based review mining techniques often produce excessively complicated models that are prone to overfitting. In this paper, authors proposed approach, based on frame semantics, for review mining [22]. Semantic frames help to generalize from the raw text (individual words) to more abstract scenarios (contexts). This representation of text is expected to enhance the predictive capabilities of review mining techniques and reduce the chances of overfitting [23]. First, authors investigate the performance of semantic frames in classifying informative user reviews into various categories of software requests about maintenance. Second, the authors propose and evaluate the performance of multiple summarization algorithms in generating concise and representative summaries of informative reviews. Three different datasets of app store reviews, sampled from a broad range of application domains, have been used to conduct experimental analysis [24]. The results have shown that semantic frames can enable an efficiently quick and precise review classification process. However, in reviewing summarization tasks, our deductions claim that text-based summarization generates more comprehensive summaries than frame-based summarization. In closing, authors have introduced MARC 2.0, a review classification and summarization suite that implements the algorithms investigated in the analysis [25].
User review is a crucial component of open mobile app markets such as the Google Play Store. The question arises: How do authors automatically summarize millions of user reviews and make sense out of them? Unfortunately, beyond simple summaries such as histograms of user ratings, few analytic tools can provide insights into user reviews [29]. In this paper, authors proposed a system
“Wiscom” that can analyze millions of user ratings and comments in mobile app markets at three different levels of detail. This system is able to (a) discover inconsistencies in reviews; (b) identify reasons why users like, or dislike a given app, and provide an interactive, zoomable view of how users' reviews evolve over time; and (c) provide valuable insights into the entire app market, identifying users' significant concerns and preferences of different types of apps. Results using a techniques and are reported on a 32GB dataset consisting of over 13 million user reviews of 171,493 Android apps in the Google Play Store [30]. Three operator such as Google as well as individual app developers and end-users [31]. The products on “Amazon.com”, the mobile apps are continuously
evolving, with newer versions rapidly superseding the older ones. Many app stores still use an Amazon-style rating system, which aggregates every rating ever assigned to an app into one store rating [32]. To examine whether the store rating captures the fickle user-satisfaction levels regarding new app versions, researchers mined the store ratings of more than 10,000 mobile apps in Google Play, every day for a year. Even though many apps' version ratings rose or fell, their store rating was resilient to fluctuations once they had gathered a substantial number of raters. The conclusion is that current store ratings are not dynamic enough to capture changing user satisfaction levels. This resilience is a significant problem that can discourage developers from improving app quality [33].
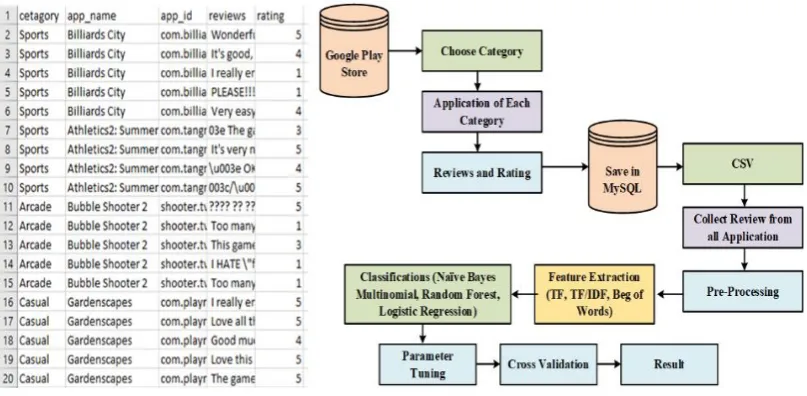
3. The methodology
of Analytical Measurement and Visualization of Users’ Reviews
Figure 1. Flow of Google Play Store Application Reviews Classification
4. The Methodology of Data Collection Process
The advancement in technology, Mobile applications can become a part of our daily life. Half-million applications were introduced in 2011, and in October 2012, 0.675 million applications were accessible on the Google Play store. Now a day's Android app is being used by lots of peoples; people use different Android apps, like messengers, social media, games and browsers. This online marketplace provides free and paid access for mobile users to over a million mobile applications also
find other strings or sets of strings, using a specific syntax held in a pattern. After using the Re-library, use the Beautiful Soup library. Beautiful Soup library is used to extract data from the HTML and XML files. This library works quickly and saves the programmer's time, as shown in Table. 1.
Figure 2. Methodology diagram of data collection and sample shot of dataset
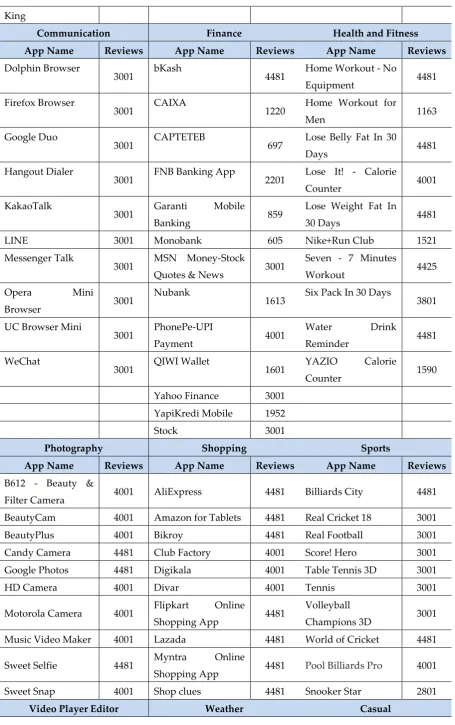
Table 1. Detail measurements of dataset scrapped
Action Arcade Card
App Name Reviews App Name Reviews App Name Reviews
Bush Rush 4001 29 Card Game 4001 Angry Bird Rio 4481
Gun Shot Fire War 3001 Blackjack 21 1601 Bubble Shooter 2 4001
Metal Soldiers 4001 Blackjack 4481 Jewels Legend 4001
N.O.V.A Legacy
4364 Callbreak
Multiplayer 4001
Lep World 2
3001
Real Gangster
Crime 4001
Card Game 29
3066 Snow Bros 3001
Shadow Fight 2
4481 Card Words
Kingdom 4472
Sonic Dash
4481
Sniper 3D Gun
Shooter 4481
Gin Rummy
3616 Space Shooter 4401
Talking Tom Gold
Run 4001
Spider Solitaire
2801 Subway Princes
Runner 3001
Temple Run 2 3001 Teen Patti Gold 4481 Subway Surfers 4481
Warship Battle
4001 World Series of
poker 4001
Super Jabber Jump 3
2912
Zombie Frontier 3 4001
King
Communication Finance Health and Fitness
App Name Reviews App Name Reviews App Name Reviews
Dolphin Browser
3001 bKash 4481 Home Workout - No
Equipment 4481
Firefox Browser
3001 CAIXA 1220 Home Workout for
Men 1163
Google Duo
3001 CAPTETEB 697 Lose Belly Fat In 30
Days 4481
Hangout Dialer
3001 FNB Banking App 2201 Lose It! - Calorie
Counter 4001
KakaoTalk
3001 Garanti Mobile
Banking 859
Lose Weight Fat In
30 Days 4481
LINE 3001 Monobank 605 Nike+Run Club 1521
Messenger Talk
3001 MSN Money-Stock
Quotes & News 3001
Seven - 7 Minutes
Workout 4425
Opera Mini
Browser 3001
Nubank
1613 Six Pack In 30 Days 3801
UC Browser Mini
3001 PhonePe-UPI
Payment 4001
Water Drink
Reminder 4481
3001 QIWI Wallet 1601 YAZIO Calorie
Counter 1590
Yahoo Finance 3001
YapiKredi Mobile 1952
Stock 3001
Photography Shopping Sports
App Name Reviews App Name Reviews App Name Reviews
B612 - Beauty &
Filter Camera 4001 AliExpress 4481 Billiards City 4481
BeautyCam 4001 Amazon for Tablets 4481 Real Cricket 18 3001
BeautyPlus 4001 Bikroy 4481 Real Football 3001
Candy Camera 4481 Club Factory 4001 Score! Hero 3001
Google Photos 4481 Digikala 4001 Table Tennis 3D 3001
HD Camera 4001 Divar 4001 Tennis 3001
Motorola Camera 4001 Flipkart Online
Shopping App 4481
Volleyball
Champions 3D 3001
Music Video Maker 4001 Lazada 4481 World of Cricket 4481
Sweet Selfie 4481 Myntra Online
Shopping App 4481 Pool Billiards Pro 4001
Sweet Snap 4001 Shop clues 4481 Snooker Star 2801
App Name Reviews App Name Reviews App Name Reviews
KIneMaster 1441 NOAA Weather
Radar & Alerts 3601 Angry Bird POP 4481
Media Player 2713 The Weather
Channel 4001 BLUK 3281
MX Player 3001 Transparent
Weather & Clock 1441 Boards King 4481
Power Director
Video Editor App 1641
Weather & Clock
Weight for Android 4481 Bubble Shooter 4481
Video Player All
Format 1041
Weather & Radar -
Free 3601 Candy Crush Saga 4481
Video Player KM 3001 Weather Forecast 1681 Farm Heroes Super
Saga 4481
Video Show 1321 Weather Live Free 1721 Hay Day 4481
VivaVideo 4190 Weather XL PRO 1401 Minion Rush 4481
You Cut App 1241 Yahoo Weather 4361 My Talking Tom 4481
YouTube 1201 Yandex. Weather 1045 Pou 4481
Shopping Mall Girl 4481
Gardens capes 4481
Medical Racing
App Name Reviews App Name Reviews
Anatomy Learning 2401 Asphalt Nitro 4481
Diseases &
Dictionary 3201 Beach Buggy Racing 4481
Disorder & Diseases
Dictionary 2401 Bike Mayhem Free 4481
Drugs.com 2401 Bike Stunt Master 2745
Epocrates 1001 Dr. Driving 2 4481
Medical Image 1423 Extreme Car
Driving 4481
Medical
Terminology 1448 Hill Climb Racing 2 3801
Pharmapedia
Pakistan 4134 Racing Fever 4481
Prognosis 2401 Racing in Car 2 4481
5. Results and Experiments
The results have been evaluated by fetching the reviews of different categories. Perform a series of steps which predict the sentiment reviews of different categories. The usage of Python's Scikit-Learn Library because this library provides different features like classification, Regression, clustering, and model validation. Different methods and features that are perform are as follows: Import the data, Feature Extraction, Convert the text into Numbers, Training and testing sets, Training text classification model and predicting sentiments and Evaluating model.
6. Analytical Measurement and Visualization After Preprocessing
These are the statistical information of different algorithm on the base of the different parameters after preprocessing; compare and find the best algorithm that uses for the analysis and classification of reviews.
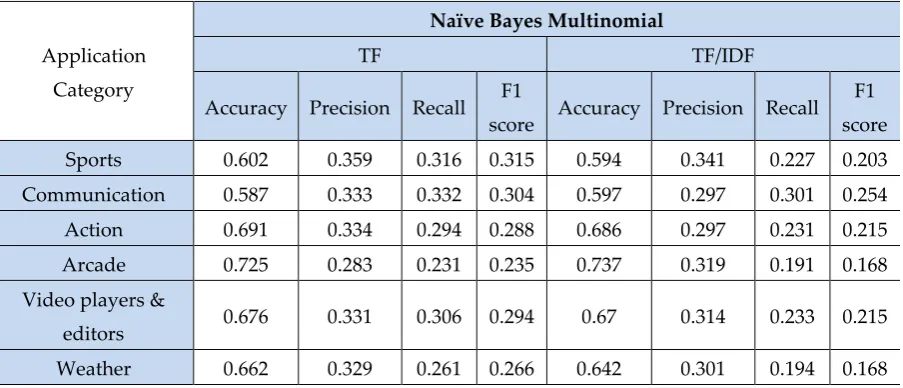
6.1 Naïve Bayes Multinomial
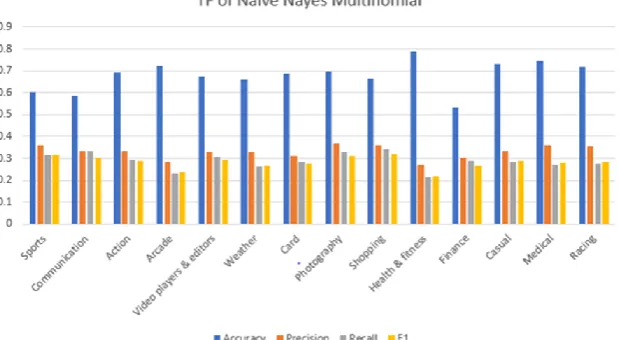
Naïve Bayes is used for classification. It assumes that the occurrence of a specific feature is independent of the occurrence of other features. It is fast to make models and make predictions. We have scraped 148 apps reviews form 14 categories from Google play store. There are 40 reviews on one page, we have collected a total of 506259 reviews from Google play store applications. Apply the Naïve Bayes algorithm for classification on that dataset of reviews and find different information on different parameters concerning TF and TF/IDF. Find the accuracy of classification of each category application and in statistical information find precision, recall, and F1 score these all parameters use to measure the accuracy of the dataset is shown in Table. 2. Also, bar chart visualization of Naïve Bayes algorithm in which series1 shows the accuracy of Naïve Bayes algorithm, series2 shows the precision, series3 shows the recall and series4 shows the F1 score measurement as shown in Figure. 3.
Table 2. Statistical information of Naïve Bayes Multinomial algorithm on TF and TF/IDF bases after preprocessing
Application
Category
Naïve Bayes Multinomial
TF TF/IDF
Accuracy Precision Recall F1
score Accuracy Precision Recall F1
score
Sports 0.602 0.359 0.316 0.315 0.594 0.341 0.227 0.203
Communication 0.587 0.333 0.332 0.304 0.597 0.297 0.301 0.254
Action 0.691 0.334 0.294 0.288 0.686 0.297 0.231 0.215
Arcade 0.725 0.283 0.231 0.235 0.737 0.319 0.191 0.168
Video players &
editors 0.676 0.331 0.306 0.294 0.67 0.314 0.233 0.215
Card 0.689 0.31 0.285 0.276 0.68 0.28 0.227 0.209
Photography 0.696 0.367 0.327 0.31 0.705 0.362 0.276 0.248
Shopping 0.667 0.358 0.341 0.321 0.678 0.299 0.316 0.289
Health & fitness 0.788 0.273 0.212 0.218 0.811 0.208 0.194 0.177
Finance 0.532 0.301 0.287 0.266 0.557 0.284 0.258 0.226
Casual 0.73 0.334 0.285 0.288 0.745 0.334 0.205 0.182
Medical 0.745 0.359 0.272 0.279 0.753 0.338 0.204 0.181
Racing 0.718 0.357 0.278 0.285 0.72 0.331 0.218 0.201
Figure 3(a). Bar chat visualization of TF Naïve Bayes Multinomial algorithm after preprocessing
Figure 3(b). Bar chat visualization of TF/IDF Naïve Bayes Multinomial algorithm after preprocessing
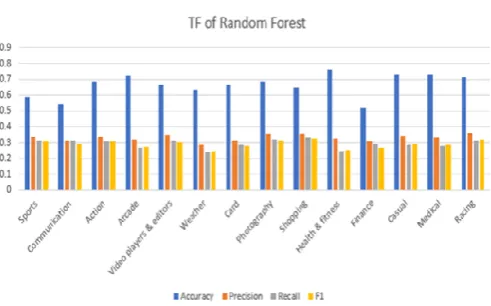
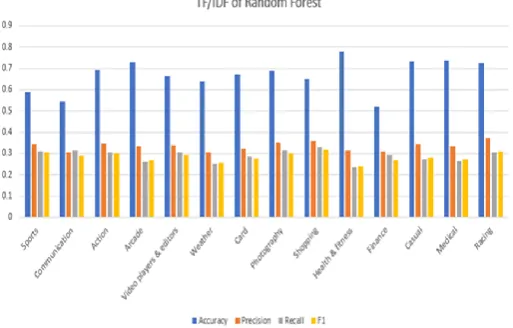
6.2 Random Forest Algorithm
information on different parameters concerning TF and TF/IDF. Find the accuracy of classification of each category application and in statistical information find precision, recall, and F1 score these all parameters use to measure the accuracy of the dataset is shown in Table. 3. Also, bar chart visualization of Random Forest algorithm in which series1 shows the accuracy of Random Forest algorithm, series2 shows the precision, series3 shows the recall and series4 shows the F1 score measurement as shown in Figure. 4.
Table 3. Statistical information of Random Forest algorithm on TF and TF/IDF bases after
preprocessing
Figure 4(a). Bar chat visualization of TF Random Forest algorithm after preprocessing
Application Category
Random Forest
TF TF/IDF
Accuracy Precision Recall F1
score Accuracy Precision Recall F1 score
Sports 0.585 0.34 0.312 0.308 0.589 0.344 0.308 0.304
Communication 0.544 0.314 0.313 0.294 0.545 0.307 0.312 0.288
Action 0.683 0.338 0.31 0.308 0.691 0.347 0.306 0.302
Arcade 0.721 0.32 0.27 0.274 0.729 0.334 0.262 0.269
Video players
&editors 0.664 0.347 0.313 0.304 0.664 0.34 0.304 0.295
Weather 0.632 0.285 0.243 0.248 0.638 0.305 0.252 0.255
Card 0.665 0.312 0.285 0.279 0.673 0.321 0.284 0.277
Photography 0.683 0.353 0.32 0.312 0.69 0.352 0.315 0.301
Shopping 0.648 0.354 0.333 0.324 0.653 0.359 0.33 0.316
Health & fitness 0.765 0.324 0.248 0.254 0.779 0.315 0.235 0.24
Finance 0.517 0.309 0.291 0.27 0.52 0.31 0.293 0.27
Casual 0.728 0.341 0.284 0.292 0.732 0.342 0.274 0.28
Medical 0.729 0.33 0.28 0.285 0.739 0.336 0.265 0.271
Figure 4(b). Bar chat visualization of TF/IDF Random Forest algorithm after preprocessing
6.2 Logistic Regression Algorithm
According to the statistics, the logistic product can be reliable statistical version, in which its essential type that runs on the logistic functionality to simulate a binary determining factor; lots complex extensions where exist. Back in Regression investigation, Logistic Regression will be estimating the parameters of the logistic version; it is an application for binomial Regressions. Apply the Logistic Regression algorithm for classification on dataset for reviews and find different information on different parameters concerning TF and TF/IDF. Find the accuracy of classification of each category application and in statistical information find precision, recall, and F1 score these all parameters use to measure the accuracy of the dataset is shown in Table. 4. Also, bar chart visualization of Logistic Regression algorithm in which series1 shows the accuracy of Logistic Regression algorithm, series2 shows the precision, series3 shows the recall and series4 shows the F1 score measurement as shown in Figure. 5.
Table 4.Statistical information of Logistic Regression algorithm on TF and TF/IDF bases after preprocessing
Application Category
Logistic Regression
TF TF/IDF
Accuracy Precision Recall F1
score Accuracy Precision Recall F1 score
Sports 0.622 0.414 0.343 0.343 0.621 0.404 0.319 0.315
Communication 0.585 0.349 0.329 0.32 0.599 0.352 0.327 0.301
Action 0.707 0.395 0.312 0.313 0.71 0.38 0.299 0.293
Arcade 0.744 0.353 0.262 0.266 0.747 0.351 0.25 0.252
Figure 5(a). Bar chat visualization of TF Logistic Regression algorithm after preprocessing
Figure 5(b). Bar chat visualization of TF/IDF Logistic Regression algorithm after preprocessing
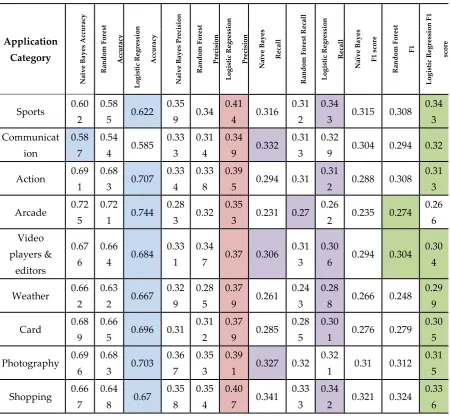
7. Different Machine Learning Algorithm Comparison After Preprocessing
editors
Weather 0.667 0.379 0.288 0.299 0.667 0.421 0.262 0.265
Card 0.696 0.379 0.301 0.305 0.698 0.344 0.283 0.271`
Photography 0.703 0.391 0.321 0.315 0.71 0.405 0.311 0.297
Shopping 0.67 0.407 0.342 0.336 0.682 0.444 0.332 0.315
Health & fitness 0.796 0.38 0.278 0.295 0.801 0.391 0.23 0.235
Finance 0.592 0.352 0.311 0.303 0.593 0.353 0.298 0.276
Casual 0.747 0.381 0.29 0.302 0.753 0.364 0.277 0.28
Medical 0.754 0.401 0.277 0.288 0.759 0.459 0.244 0.245
Google Play Store is an online market place that provided free and paid access to users. Google Play store, users can choose from over a million apps from various predefined categories. In this
research, scrapped thousands of users’ review and app ratings. We evaluated the results by using
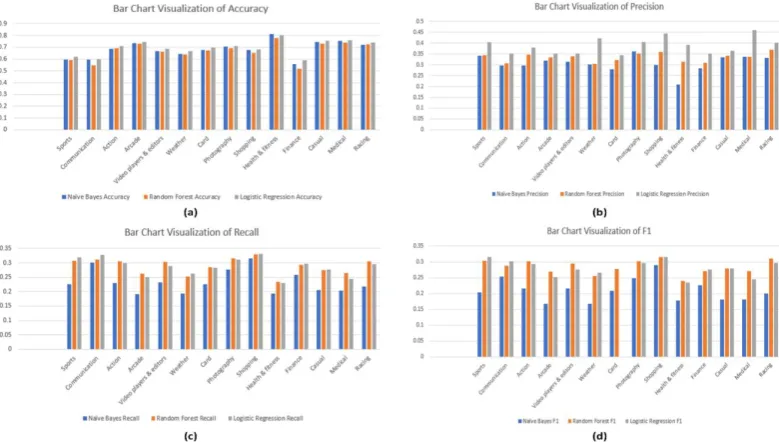
different machine learning algorithms like Naïve Bayes, Random Forest, and Logistic Regression algorithm that can check the semantics of reviews about some applications form users that their reviews are good, bad, normal and so on. Calculated Term Frequency (TF) and Inverse Document Frequency (IDF) with different parameters like accuracy, precision, recall, and F1 score after the preprocessing of the Raw reviews in the concluded results compared the statistical result of these algorithms. Visualized these statistical results in the form of a bar chart, as shown in Figure. 6. After comparison, analyzed that the Logistic Regression algorithm is the best algorithm for checking the
semantic analysis of any Google application users’ reviews on both TF and TF/IDF bases. As in
sports category in TF base, showed that Logistic Regression algorithm has 0.622% accuracy, 0.414% precision, 0.343% recall and 0.343% F1 score and the statistical information with another category of application as shown in Table. 10. Also, in TF/IDF base showed that Logistic Regression algorithm has 0.621% accuracy, 0.404% precision, 0.319% recall and 0.315% F1 score and the statistical information with another category of application is shown in Table. 5.
Table 5. Different machine learning algorithm comparison of on TF based after preprocessing
Application Category N aï v e B a y es Acc u rac y R an d o m F o res t Acc u rac y Lo g is ti c R eg res si o n Acc u rac y N aï v e B a y es P rec is io n R an d o m F o res t P rec is io n Lo g is ti c R eg res si o n P rec is io n N aï v e B a y es R ec al l R an d o m F o res t R ec al l Lo g is ti c R eg res si o n R ec al l N aï v e B a y es F 1 sc o re R an d o m F o res t F1 Lo g is ti c R eg res si o n F 1 sc o re
Sports 0.60 2
0.58
5 0.622 0.35
9 0.34 0.41
4 0.316 0.31
2 0.34
3 0.315 0.308 0.34 3 Communicat ion 0.58 7 0.54
4 0.585 0.33
3 0.31
4 0.34
9 0.332 0.31
3 0.32
9 0.304 0.294 0.32
Action 0.69 1
0.68
3 0.707 0.33
4 0.33
8 0.39
5 0.294 0.31 0.31
2 0.288 0.308 0.31
3
Arcade 0.72 5
0.72
1 0.744 0.28
3 0.32 0.35
3 0.231 0.27 0.26
2 0.235 0.274 0.26 6 Video players & editors 0.67 6 0.66
4 0.684 0.33
1 0.34
7 0.37 0.306 0.31
3 0.30
6 0.294 0.304 0.30
4
Weather 0.66 2
0.63
2 0.667 0.32
9 0.28
5 0.37
9 0.261 0.24
3 0.28
8 0.266 0.248 0.29
9
Card 0.68 9
0.66
5 0.696 0.31 0.31
2 0.37
9 0.285 0.28
5 0.30
1 0.276 0.279 0.30
5
Photography 0.69 6
0.68
3 0.703 0.36
7 0.35
3 0.39
1 0.327 0.32 0.32
1 0.31 0.312 0.31
5
Shopping 0.66 7
0.64
8 0.67 0.35
8 0.35
4 0.40
7 0.341 0.33
3 0.34
2 0.321 0.324 0.33
Health & fitness
0.78 8
0.76
5 0.796 0.27
3 0.32
4 0.38 0.212 0.24
8 0.27
8 0.218 0.254 0.29
5
Finance 0.53 2
0.51
7 0.592 0.30
1 0.30
9 0.35
2 0.287 0.29
1 0.31
1 0.266 0.27 0.30
3
Casual 0.73 0.72
8 0.747 0.33
4 0.34
1 0.38
1 0.285 0.28
4 0.29 0.288 0.292 0.30
2
Medical 0.74 5
0.72
9 0.754 0.35
9 0.33 0.40
1 0.272 0.28 0.27
7 0.279 0.285 0.28
8
Racing 0.71 8
0.71
4 0.737 0.35
7 0.35
9 0.42
8 0.278 0.31
7 0.31
2 0.285 0.319 0.31
8
Figure 6. Bar chat visualization of different machine learning algorithm comparison on TF based after preprocessing
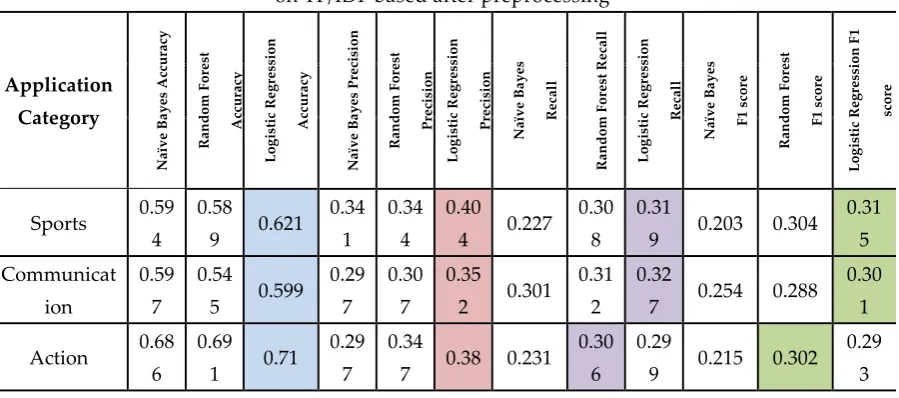
Table 6. Different machine learning algorithm comparison of on TF/IDF based after preprocessing
Application Category N aï v e B a y es Acc u rac y R an d o m F o res t Acc u rac y Lo g is ti c R eg res si o n Acc u rac y N aï v e B a y es P rec is io n R an d o m F o res t P rec is io n Lo g is ti c R eg res si o n P rec is io n N aï v e B a y es R ec al l R an d o m F o res t R ec al l Lo g is ti c R eg res si o n R ec al l N aï v e B a y es F 1 sc o re R an d o m F o res t F 1 sc o re Lo g is ti c R eg res si o n F 1 sc o re
Sports 0.59 4
0.58
9 0.621 0.34
1 0.34
4 0.40
4 0.227 0.30
8 0.31
9 0.203 0.304 0.31 5 Communicat ion 0.59 7 0.54
5 0.599 0.29
7 0.30
7 0.35
2 0.301 0.31
2 0.32
7 0.254 0.288 0.30
1
Action 0.68 6
0.69
1 0.71 0.29
7 0.34
7 0.38 0.231 0.30
6 0.29
9 0.215 0.302 0.29
Arcade 0.73 7
0.72
9 0.747 0.31
9 0.33
4 0.35
1 0.191 0.26
2 0.25 0.168 0.269 0.25
2
Video players &
editors
0.67 0.66
4 0.687 0.31
4 0.34 0.35
2 0.233 0.30
4 0.28
9 0.215 0.295 0.27
6
Weather 0.64 2
0.63
8 0.667 0.30
1 0.30
5 0.42
1 0.194 0.25
2 0.26
2 0.168 0.255 0.26
5
Card 0.68 0.67
3 0.698 0.28 0.32
1 0.34
4 0.227 0.28
4 0.28
3 0.209 0.277 0.27
1`
Photography 0.70
5 0.69 0.71 0.36
2 0.35
2 0.40
5 0.276 0.31
5 0.31
1 0.248 0.301 0.29
7
Shopping 0.67 8
0.65
3 0.682 0.29
9 0.35
9 0.44
4 0.316 0.33 0.33
2 0.289 0.316 0.31 5 Health & fitness 0.81 1 0.77
9 0.801 0.20
8 0.31
5 0.39
1 0.194 0.23
5 0.23 0.177 0.24 0.23
5
Finance 0.55
7 0.52 0.593 0.28
4 0.31 0.35
3 0.258 0.29
3 0.29
8 0.226 0.27 0.27
6
Casual 0.74 5
0.73
2 0.753 0.33
4 0.34
2 0.36
4 0.205 0.27
4 0.27
7 0.182 0.28 0.28
Medical 0.75 3
0.73
9 0.759 0.33
8 0.33
6 0.45
9 0.204 0.26
5 0.24
4 0.181 0.271 0.24
5
Racing 0.72 0.72
4 0.74 0.33
1 0.37 0.40
1 0.218 0.30
6 0.29
5 0.201 0.311 0.29
7
8. Analytical Measurement and Visualization Without Preprocessing of Dataset
These are the statistical information of different algorithm on the base of the different parameters after data collection; compare and find the best algorithm that uses for the analysis and classification of reviews.
8.1 Naïve Bayes Multinomial
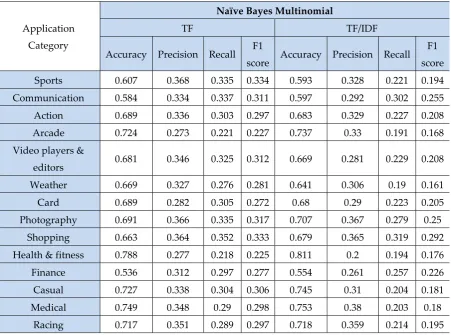
Naïve Bayes is commonly used classifcation algorithm. Naïve Bayes assumes that the occurrence of a specific feature is independent of the occurrence of other features. It is fast to make models and make predictions. Apply the Naïve Bayes algorithm for classification on that dataset of reviews and find different information on different parameters concerning TF and TF/IDF. Find the accuracy of classification of each category application and in statistical information find precision, recall, and F1 score these all parameters use to measure the accuracy of the dataset is shown in Table 7. Also, bar chart visualization of Naïve Bayes algorithm in which series1 shows the accuracy of Naïve Bayes algorithm, series2 shows the precision, series3 shows the recall and series4 shows the F1 score measurement as shown in Figure. 8.
Table 7. Statistical information of Naïve Bayes Multinomial algorithm on TF and TF/IDF based without preprocessing of the dataset
Application
Category
Naïve Bayes Multinomial
TF TF/IDF
Accuracy Precision Recall F1
score Accuracy Precision Recall F1
score
Sports 0.607 0.368 0.335 0.334 0.593 0.328 0.221 0.194
Communication 0.584 0.334 0.337 0.311 0.597 0.292 0.302 0.255
Action 0.689 0.336 0.303 0.297 0.683 0.329 0.227 0.208
Arcade 0.724 0.273 0.221 0.227 0.737 0.33 0.191 0.168
Video players &
editors 0.681 0.346 0.325 0.312 0.669 0.281 0.229 0.208
Weather 0.669 0.327 0.276 0.281 0.641 0.306 0.19 0.161
Card 0.689 0.282 0.305 0.272 0.68 0.29 0.223 0.205
Photography 0.691 0.366 0.335 0.317 0.707 0.367 0.279 0.25
Shopping 0.663 0.364 0.352 0.333 0.679 0.365 0.319 0.292
Health & fitness 0.788 0.277 0.218 0.225 0.811 0.2 0.194 0.176
Finance 0.536 0.312 0.297 0.277 0.554 0.261 0.257 0.226
Casual 0.727 0.338 0.304 0.306 0.745 0.31 0.204 0.181
Medical 0.749 0.348 0.29 0.298 0.753 0.38 0.203 0.18
Figure 8(a). Bar chat visualization of TF Naïve Bayes Multinomial algorithm based without preprocessing of
data
Figure 8(b). Bar chat visualization of TF/IDF Naïve Bayes Multinomial algorithm based without preprocessing of data
8.2 Random Forest Algorithm
Random Forests Classifier is the class of all methods that are designed explicitly for decision tree. It develops a lot of decision tree based on a random selection of data and a random selection of variables. Apply the Random Forest algorithm for classification on that dataset of reviews and find different information on different parameters concerning TF and TF/IDF. Find the accuracy of classification of each category application and in statistical information find precision, recall, and F1 score these all parameters use to measure the accuracy of the dataset is shown in Table. 8. Also, bar chart visualization of Random Forest algorithm in which series1 shows the accuracy of Random Forest algorithm, series2 shows the precision, series3 shows the recall and series4 shows the F1 score measurement as shown in Figure. 9.
Table 8. Statistical information of Random Forest algorithm on TF and TF/IDF based without preprocessing of the dataset
Application
Category
Random Forest
TF TF/IDF
Accuracy Precision Recall F1
score Accuracy Precision Recall F1 score
Communication 0.559 0.321 0.314 0.296 0.555 0.32 0.309 0.29
Action 0.686 0.35 0.307 0.308 0.695 0.369 0.306 0.307
Arcade 0.725 0.338 0.265 0.275 0.729 0.336 0.256 0.265
Video players &
editors 0.665 0.351 0.311 0.308 0.665 0.335 0.306 0.298
Weather 0.641 0.335 0.273 0.282 0.647 0.323 0.255 0.264
Card 0.666 0.325 0.28 0.281 0.669 0.322 0.274 0.273
Photography 0.689 0.372 0.328 0.321 0.69 0.363 0.318 0.308
Shopping 0.654 0.37 0.333 0.325 0.653 0.361 0.328 0.315
Health & fitness 0.778 0.299 0.215 0.22 0.788 0.354 0.22 0.225
Finance 0.532 0.311 0.292 0.276 0.529 0.317 0.294 0.272
Casual 0.735 0.345 0.273 0.284 0.739 0.346 0.267 0.277
Medical 0.737 0.342 0.276 0.284 0.743 0.351 0.259 0.268
Racing 0.719 0.361 0.311 0.317 0.726 0.383 0.307 0.317
Figure 9 (a). Bar chat visualization of TF Random Forest algorithm based without preprocessing of data
Figure 9 (b). Bar chat visualization of TF Random Forest algorithm based without preprocessing of data
8.3 Logistic Regression Algorithm
each category application and in statistical information find precision, recall, and F1 score these all parameters use to measure the accuracy of the dataset is shown in Table. 9. Also, bar chart visualization of Logistic Regression algorithm in which series1 shows the accuracy of Logistic Regression algorithm, series2 shows the precision, series3 shows the recall and series4 shows the F1 score measurement as shown in Figure. 10.
Table 9. Statistical information of Logistic Regression algorithm on TF and TF/IDF based without preprocessing of the dataset
Application Category
Logistic Regression
TF TF/IDF
accuracy Precision recall F1
score accuracy Precision recall F1 score
Sports 0.623 0.416 0.35 0.353 0.629 0.416 0.331 0.328
Communication 0.588 0.355 0.334 0.326 0.602 0.361 0.334 0.312
Action 0.71 0.405 0.32 0.324 0.712 0.398 0.304 0.299
Arcade 0.744 0.369 0.271 0.278 0.747 0.349 0.246 0.247
Video Players &
Editors 0.69 0.39 0.323 0.323 0.693 0.375 0.3 0.291
Weather 0.674 0.386 0.303 0.316 0.674 0.384 0.275 0.282
Card 0.697 0.373 0.306 0.31 0.699 0.359 0.288 0.281
Photography 0.707 0.403 0.332 0.328 0.714 0.422 0.322 0.309
Shopping 0.674 0.411 0.351 0.346 0.686 0.444 0.339 0.324
Health & Fitness 0.794 0.369 0.28 0.295 0.803 0.363 0.232 0.239
Finance 0.595 0.363 0.319 0.314 0.604 0.401 0.308 0.29
Casual 0.747 0.385 0.3 0.314 0.755 0.385 0.28 0.285
Medical 0.757 0.41 0.295 0.31 0.759 0.468 0.246 0.249
Racing 0.738 0.419 0.317 0.325 0.74 0.391 0.295 0.297
Figure 10 (b). Bar chat visualization of TF/IDF Logistic Regression algorithm based without preprocessing of data
9. Different Machine Learning Algorithm Comparison Without Preprocessing of Dataset
Using the Google Play store, users can choose from over a million apps from various predefined categories. Evaluate the results by using different machine learning algorithms like Naïve Bayes, Random Forest, and Logistic Regression algorithm that can check the semantics of reviews about some applications form users that their reviews are good, bad, normal and so on. Calculate Term Frequency (TF) and Inverse Document Frequency (IDF) with different parameters like accuracy, precision, recall, and F1 score after the data collection of the Raw reviews in the concluded results compared the statistical result of these algorithms. Visualized these statistical results in the form of a bar chart, as shown in Figure. 11. After comparison, analyze that the Logistic Regression algorithm is the best algorithm to check the semantic analysis of any Google application users’ reviews on both
TF and TF/IDF bases. As in sports category in TF base, show that Logistic Regression algorithm has 0.623% accuracy, 0.416% precision, 0.35% recall, and 0.353% F1 score and the statistical information with another category of application is shown in Table. 15. Also, in TF/IDF base show that Logistic Regression algorithm has 0.629% accuracy, 0.416% precision, 0.331% recall, and 0.328% F1 score and the statistical information with another category of application is shown in Table. 10.
Table 10. Different machine learning algorithm comparison on TF based without preprocessing of the dataset
Application Category N aï v e B a y es Acc u rac y R an d o m F o res t Acc u rac y Lo g is ti c R eg res si o n Acc u rac y N aï v e B a y es P rec is io n R an d o m F o res t P rec is io n Lo g is ti c R eg res si o n P rec is io n N aï v e B a y es R ec al l R an d o m F o res t R ec al l Lo g is ti c R eg res si o n R ec al l N aï v e B a y es F 1 sc o re R an d o m F o res t F 1 sc o re Lo g is ti c R eg res si o n F 1 sc o re
Sports 0.60 7
0.58
9 0.623 0.36
8 0.35
9 0.41
6 0.314 0.31
4 0.35 0.334 0.314 0.35 3 Communicat ion 0.58 4 0.55
9 0.588 0.33
4 0.32
1 0.35
5 0.296 0.29
6 0.33
4 0.311 0.296 0.32
6
Action 0.68 9
0.68
6 0.71 0.33
6 0.35 0.40
5 0.308 0.30
8 0.32 0.297 0.308 0.32
4
Arcade 0.72 4
0.72
5 0.744 0.27
3 0.33
8 0.36
9 0.275 0.27
5 0.27
1 0.227 0.275 0.27 8 Video players & editors 0.68 1 0.66
5 0.69 0.34
6 0.35
1 0.39 0.308 0.30
8 0.32
3 0.312 0.308 0.32
3
Weather 0.66 9
0.64
1 0.674 0.32
7 0.33
5 0.38
6 0.282 0.28
2 0.30
3 0.281 0.282 0.31
Card 0.68 9
0.66
6 0.697 0.28
2 0.32
5 0.37
3 0.281 0.28
1 0.30
6 0.272 0.281 0.31
Photography 0.69 1
0.68
9 0.707 0.36
6 0.37
2 0.40
3 0.321 0.32
1 0.33
2 0.317 0.321 0.32
8
Shopping 0.66 3
0.65
4 0.674 0.36
4 0.37 0.41
1 0.325 0.32
5 0.35
1 0.333 0.325 0.34 6 Health & fitness 0.78 8 0.77
8 0.794 0.27
7 0.29
9 0.36
9 0.22 0.22 0.28 0.225 0.22 0.29
5
Finance 0.53 6
0.53
2 0.595 0.31
2 0.31
1 0.36
3 0.276 0.27
6 0.31
9 0.277 0.276 0.31
4
Casual 0.72 7
0.73
5 0.747 0.33
8 0.34
5 0.38
5 0.284 0.28
4 0.3 0.306 0.284 0.31
4
Medical 0.74 9
0.73
7 0.757 0.34
8 0.34
2 0.41 0.284 0.28
4 0.29
5 0.298 0.284 0.31
Racing 0.71 7
0.71
9 0.738 0.35
1 0.36
1 0.41
9 0.317 0.31
7 0.31
7 0.297 0.317 0.32
5
Figure 11. Bar chat visualization of different machine learning algorithm comparison on TF based without preprocessing of data
Table 11. Different machine learning algorithm comparison on TF/IDF based without preprocessing of the dataset
Application Category N aï v e B a y es Acc u rac y R an d o m F o res t Acc u rac y Lo g is ti c R eg res si o n Acc u rac y N aï v e B a y es P rec is io n R an d o m F o res t P rec is io n Lo g is ti c R eg res si o n P rec is io n N aï v e B a y es R ec al l R an d o m F o res t R ec al l Lo g is ti c R eg res si o n R ec al l N aï v e B a y es F 1 sc o re R an d o m F o res t F 1 sc o re Lo g is ti c R eg res si o n F 1 sc o re
Sports 0.59 3
0.59
5 0.629 0.32
8 0.35
2 0.41
6 0.221 0.30
7 0.33
Communica tion
0.59 7
0.55
5 0.602 0.29
2 0.32 0.36
1 0.302 0.30
9 0.33
4 0.255 0.29 0.312
Action 0.68 3
0.69
5 0.712 0.32
9 0.36
9 0.39
8 0.227 0.30
6 0.30
4 0.208 0.307 0.299
Arcade 0.73 7
0.72
9 0.747 0.33 0.33
6 0.34
9 0.191 0.25
6 0.24
6 0.168 0.265 0.247
Video players & editors 0.66 9 0.66
5 0.693 0.28
1 0.33
5 0.37
5 0.229 0.30
6 0.3 0.208 0.298 0.291
Weather 0.64 1
0.64
7 0.674 0.30
6 0.32
3 0.38
4 0.19 0.25
5 0.27
5 0.161 0.264 0.282
Card 0.68 0.66
9 0.699 0.29 0.32
2 0.35
9 0.223 0.27
4 0.28
8 0.205 0.273 0.281
Photograph y
0.70
7 0.69 0.714 0.36
7 0.36
3 0.42
2 0.279 0.31
8 0.32
2 0.25 0.308 0.309
Shopping 0.67 9
0.65
3 0.686 0.36
5 0.36
1 0.44
4 0.319 0.32
8 0.33
9 0.292 0.315 0.324
Health & fitness
0.81 1
0.78
8 0.803 0.2 0.35
4 0.36
3 0.194 0.22 0.23
2 0.176 0.225 0.239
Finance 0.55 4
0.52
9 0.604 0.26
1 0.31
7 0.40
1 0.257 0.29
4 0.30
8 0.226 0.272 0.29
Casual 0.74 5
0.73
9 0.755 0.31 0.34
6 0.38
5 0.204 0.26
7 0.28 0.181 0.277 0.285
Medical 0.75 3
0.74
3 0.759 0.38 0.35
1 0.46
8 0.203 0.25
9 0.24
6 0.18 0.268 0.249
Racing 0.71 8
0.72
6 0.74 0.35
9 0.38
3 0.39
1 0.214 0.30
7 0.29
5 0.195 0.317 0.297
10. Semantic Analysis of Google Play Store Applications Reviews Using Logistic Regression
Algorithm
After checking the different paraments, analyze that Logistic Regression algorithm is the best algorithm having the highest accuracy. In this section, performed analysis and classify all reviews in different classes positive, negative, and neutral. Set target value if the value of the comment is positive, it is equal to 1 if the review is negative, and it is equal to 0. Also, analyze the neutral class with the confidence rate if the confidence rate is between the 0 and 1 then classify this to neutral class. Different parameters in our dataset like the category of application, Application Name, Application ID, Reviews, and rating, as shown in Figure. 13. However, for checking the semantics of each review, these parameters are more enough. That is why we select only reviews of all application.
Figure 13. Sample screenshot of the original dataset that scrapped
11. Data Preparation and Cleaning of Reviews steps
HTML Decoding
To convert HTML encoding into text, and in the start or ending up in the text field as ‘&,’‘\amp’
& ‘quot.’
Data Preparation 2: ‘# ’ Mention
“#” carries import information that must deal with is necessary.
Remove all URL’s that appears in reviews remove them.
UTF-8 BOM (Byte Order Mark)
For patterns of characters like “\xef\xbf\xbd,” these are UTF-8 BOM. It is a sequence of bytes
(EF,BB,BF) that allows the reader to identify a file as being encoded in UTF-8.
Hashtag / Numbers
Hashtag text can provide useful information about the comment. It might be a bit tough to get rid of
all the text together with the “#” or with a number or with any other unique character needs to deal.
Negation Handling
~ is the factor that is not suitable in the review remove them.
Tokenizing and Joining
Parse the whole comment into small pieces/segments and then merge again. After applying the above rules on cleaning, the reviews cleaned form of reviews, as shown in Figure. 14.
12. Find Null Entries from Reviews
It seems there are about 700-800 null entries in the reviews column of the dataset. Which might happen during the cleaning process to remove the null entries with using commands as shown below.
<class ‘pandas.core.frame.DataFrame’>
Int64Index: 400000 entries, 0 to 399999 Data columns (total 2 columns):
text 399208 non-null object target 400000 non-null int64
dtypes: int64(1), object (1) memory usage: 9.2 + MB
13. Negative and Positive Words Dictionary
By using word cloud corpus, made negative and positive words dictionary based on the occurrence of words in a sentence to get the idea of what kind of words are frequent in the corpus as shown in Figure. 16.
(a) (b)
Figure 15. (a) Positive (b) Negative word dictionary by using the word cloud corpus
14. Semantic Analysis of Google Play Store Applications Reviews Using Logistic Regression
Algorithm
Figure 16. Final sentiment analysis results on Google Play reviews using Logistic Regression Algorithm
15. Conclusion and Future Work
On the Google Play store, users may download more than one million applications from
different categorized groups. In this research, we have built hundreds and thousands of user’s
application reviews. We have 14 categories and download 148 app reviews. Accumulate 506259 reviews out of Google play store. Assessed the outcome using unique machine learning algorithms such as Naïve Bayes, Random Forest, and Logistic Regression algorithm, which will assess the semantics of application users’ reviews are equally positive, negative, and neutral. Calculate
Time-Frequency (TF) and Inverse Document Frequency (IDF) using various parameters such as precision, accuracy, recall, and F1 score and about the statistical effect of those calculations. Using
section performs analysis and classifies all reviews in different classes positive, negative, and neutral. Set target value if the value of the comment is positive, it is equal to 1 if the review is negative, and it is equal to 0. Analyze the neutral class with the confidence rate if the confidence rate is between the 0 and 1 then classify this to neutral class.
In the future, increase the category of applications and increase the number of reviews. Compare the Logistic Regression algorithm accuracy results with different algorithms. Generate clusters and check the relationship between reviews and ratings of the application that can analyze each application more precisely.
Refrences
[1] Y. Goldberg, "Neural network methods for natural language processing," Synthesis Lectures on Human Language Technologies, vol. 10, no. 1, pp. 1-309, 2017.
[2] N. Genc-Nayebi and A. Abran, "A systematic literature review: Opinion mining studies from mobile app store user reviews," Journal of Systems and Software, vol. 125, pp. 207-219, 2017.
[3] E. Cambria, B. Schuller, Y. Xia, and B. White, "New avenues in knowledge bases for natural language processing," Knowledge-Based Systems, vol. 108, no. C, pp. 1-4, 2016.
[4] M. M. S. Missen et al., "OpinionML—Opinion Markup Language for Sentiment Representation," Symmetry, vol. 11, no. 4, p. 545, 2019.
[5] C. Gao, Y. Zhao, R. Wu, Q. Yang, and J. Shao, "Semantic trajectory compression via multi-resolution synchronization-based clustering," Knowledge-Based Systems, 2019.
[6] K. Santo, S. S. Richtering, J. Chalmers, A. Thiagalingam, C. K. Chow, and J. Redfern, "Mobile phone apps to improve medication adherence: a systematic stepwise process to identify high-quality apps," JMIR mHealth and uHealth, vol. 4, no. 4, p. e132, 2016.
[7] P. Barlas, I. Lanning, and C. Heavey, "A survey of open source data science tools,"
International Journal of Intelligent Computing and Cybernetics, vol. 8, no. 3, pp. 232-261, 2015. [8] Y. Man, C. Gao, M. R. Lyu, and J. Jiang, "Experience report: Understanding cross-platform
app issues from user reviews," in 2016 IEEE 27th International Symposium on Software Reliability Engineering (ISSRE), 2016, pp. 138-149: IEEE.
[9] J. R. Saura and D. R. Bennett, "A Three-Stage method for Data Text Mining: Using UGC in Business Intelligence Analysis," Symmetry, vol. 11, no. 4, p. 519, 2019.
[10] F. Benedetti, D. Beneventano, S. Bergamaschi, and G. Simonini, "Computing inter-document similarity with context semantic analysis," Information Systems, vol. 80, pp. 136-147, 2019. [11] J. S. Sachs, "Recognition memory for syntactic and semantic aspects of connected discourse,"
Perception & Psychophysics, vol. 2, no. 9, pp. 437-442, 1967.
[12] T. Zhang and S. S. Ge, "An Improved TF-IDF Algorithm Based on Class Discriminative Strength for Text Categorization on Desensitized Data," in Proceedings of the 2019 3rd International Conference on Innovation in Artificial Intelligence, 2019, pp. 39-44: ACM.
[13] Y. Zhang, W. Ren, T. Zhu, and E. Faith, "MoSa: A Modeling and Sentiment Analysis System for Mobile Application Big Data," Symmetry, vol. 11, no. 1, p. 115, 2019.
[15] C. Chapman and K. T. Stolee, "Exploring regular expression usage and context in Python," in
Proceedings of the 25th International Symposium on Software Testing and Analysis, 2016, pp. 282-293: ACM.
[16] H. Chivers, "Optimising Unicode regular expression evaluation with previews," Software: Practice and Experience, vol. 47, no. 5, pp. 669-688, 2017.
[17] M. G. Coutinho, M. F. Torquato, and M. A. Fernandes, "Deep Neural Network Hardware Implementation Based on Stacked Sparse Autoencoder," IEEE Access, 2019.
[18] A. Di Sorbo et al., "What would users change in my app? summarizing app reviews for recommending software changes," in Proceedings of the 2016 24th ACM SIGSOFT International Symposium on Foundations of Software Engineering, 2016, pp. 499-510: ACM.
[19] M. Colhon, Ş. Vlăduţescu, and X. Negrea, "How Objective a Neutral Word Is? A
Neutrosophic Approach for the Objectivity Degrees of Neutral Words," Symmetry, vol. 9, no. 11, p. 280, 2017.