IJEDR1401027 International Journal of Engineering Development and Research ( www.ijedr.org) 156
Simulation of Security Constraint Optimal Power
Flow Using Power World Simulator
1
Thirumalai Kumar.K,
2Muthu Kumar.K
1PG Student, 2Assistant Professor1Department of EEE, Paavai Engineering College, Namakkal, India 2
Department of EEE, Paavai Engineering College, Namakkal, India 1[email protected], 2[email protected]
Abstract— This paper presents an efficient approach to find Security Constraint Optimal Power Flow (SCOPF) determining the dispatch schedule of power generators with minimum cost. Satisfying system constraints, transmission constraints along with mandates to ensure optimal power flow has led to SCOPF. Revenue paid for electricity will be reduced considerably while the generation cost is reduced. Power world simulator employs linear programming method for finding optimal power flow. The proposed method has been tested and examined on ieee-7 bus system. Results shows advantageous than other conventional methods for solving OPF with security constraint for the same case.
Index Terms—Power World Simulator, Optimal power Flow, security Constraint Optimal Power Flow, Economic Dispatch
I.INTRODUCTION
In power systems, operation and planning needs operators to make decisions with respect to different objectives. Several tools have been developed to assist operators in this aspect. Optimal Power Flow (OPF) is one of them which help the operators in running the system optimally under specific constraints. Operating power systems at minimum cost without maintaining the security is no longer the sufficient criterion for dispatching electric power and therefore suitable control measures should be made. This has led to Security Constraint Optimal Power Flow. As the power industry moves into a more competitive environment, use of Optimal Power Flow will become increasingly more important in maximizing the capability of the existing transmission system asset. A typical OPF solution adjusting the appropriate control variables, so that a specific objective in operating a power system network is optimized (maximizing or minimizing) with respect to the power system constraints, dictated by the electrical network and with security constraints is solved in this paper. Security constrained optimal power flow takes into account outages of certain transmission lines or equipment. A SCOPF solution is secure for all credible contingencies or can be made secure by corrective means. Due to the computational complexity of the problem, more work has been devoted to obtaining faster solutions requiring less storage. Several classical methods has been used in solving OPF for decades and here one of it ,linear programming is used to find the optimal solution for this problem as it is the fast method among the classical methods for solving SCOPF.
II. PROBLEM FORMULATION
The optimal power flow is a constrained optimization problem requiring the minimization of: F=(x,u)
Subject to constraints
Gi (x, u) = 0, i=0, 1, 2, 3….m (equality constraints) Hi(x, u) ≤ 0, i=0, 1, 2, 3….m (inequality constraints) umin ≤ u ≤ umax
xmin ≤ x ≤ xmax Here
f(x,u) is the scalar objective function,
g(x,u) represents nonlinear equality constraints (power flow equations), h(x,u) is the nonlinear inequality constraints.
u and x represents set of controllable and dependent variables respectively.
The Vector X Contains Dependent Variables Consisting Of Bus Voltage Magnitudes And Phase Angles, As Well As The Mvar Output Of Generators Designated For Bus Voltage Control And Fixed Parameters Such As The Reference Bus Angle, Non- Controlled Generator Mw And Mvar Outputs, Non-Controlled Mw And Mvar Loads, Fixed Bus Voltages, Line Parameters, etc. A. Objective function
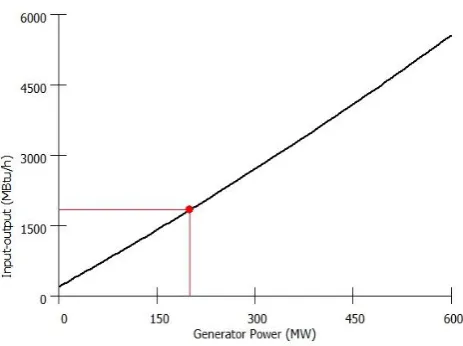
IJEDR1401027 International Journal of Engineering Development and Research ( www.ijedr.org) 157 Figure 1: Typical Input-output Curve of a Generator
It specifies the relationship between how much heat must be input to the generator and its resulting MW output. In allpractical cases, the cost of generator i can be represented as
Ci = (ai+biPi +ci Pi 2) * fuel cost
Where Pi is the real power output of generator i, and ai, bi, ci are the cost coefficients.
Typical incremental cost curve is shown below in figure 2 B. Control Variables
The control variables in an optimal power flow problem are the quantities whose value can be adjusted directly to help minimize the objective function and satisfy the constraints. The control variables can be given as:
1. Real power and reactive power generation. 2. Phase-shifter angles
3. Net interchange
4. Load MW and MVAr (load shedding) 5. DC transmission line flows
6.
Control voltage settings7.
LTC transformer tap settingsC. Dependent Variables
These variables are the optimal power flow variables that are not controlled. These include all type of variables that are free, within limits, to assume value to solve the problem. The main dependent variables are complex bus voltage angles and magnitude.
D. Constraints
IJEDR1401027 International Journal of Engineering Development and Research ( www.ijedr.org) 158 A commercially available OPF normally offers a facility to relax limits in case of unfeasibility. Once a solution is obtained for the relaxed problem, the OPF will provide means to investigate how the original limits had caused convergence difficulties. Such a mechanism may provide valuable information concerning the power system being modelled. For instance, a region which requires relaxation of voltage limits may have implications of requiring new reactive compensation sources.
Some OPF programs require users to give them guidance as to which limits can be relaxed and in what sequence. This flexibility in fact places much burden on the users who need to appreciate how an OPF algorithm performs before the preferred strategy for constraint relaxation can be formalized as input to the program.
E. Equality constraint
The equality constraints of the OPF reflect the physics of the power system as well as the desired voltage set points throughout the system. The physics of the power system are enforced through the power flow equations which require that the net injection of real and reactive power at each bus sum to zero. This can be achieved by active and reactive power analysis
Pi =P Load + P Loss Q i = Q Load + Q Loss Where
Pi & Q i are the active and reactive power outputs. P Load & Q Load is the active and reactive load power. P Loss & Q Loss is the active and reactive power loss. The power flow equations of the network can be given as:
G (V, δ) =0 Where
Pi (V, δ) –Pi net
G (V, δ) = {Qi (V, δ) – Qi net Pm (V, δ)-Pm net
Pi & Qi are the calculated real and reactive power at PQ bus
V & δ are the magnitude and phase angle of voltage at different buses.
G. Inequality Constraints.
In a power system components and devices have operating limits & these limits are created for security constraints. Thus the required objective function can be minimized by maintaining the network components within the security limits.
Pgi min ≤ Pgi ≤ Pgi max Qgi min ≤ Qgi ≤ Qgi max ΣPgi -PD- PLoss = 0 Where
Pgi is the amount of generation in MW at generator i. Qgi is the amount of generation in MVAR at generator i. The inequality constraints on voltage magnitude V of each PQ bus
Vi min ≤ Vi ≤ Vi max Where
Vi min & Vi max are the minimum and maximum values of voltages at bus i. The inequality constraints on phase angle δ of voltages at all buses i
δi min ≤δi ≤δi max Where
δi min & δi max are the minimum and maximum values of phase angle at bus i
III.AUTOMATICVOLTAGECONTROL
Automatic generation control (AGC) is the name given to a control system having three major objectives: 1. To hold system frequency at or very close to a specified nominal value
2. To maintain the correct value of interchange power between control 3. To maintain each unit's generation at the most economic value.
Modern implementation of automatic generation control (AGC) schemes usually consists of a central location where information pertaining to the system is telemetered. Control actions are determined in a digital computer and then transmitted to the generation units via the same telemetry channels. To implement an AGC system, one would require the following information at the control center.
1. Unit megawatt output for each committed unit.
2.Megawatt flow over each tie line to neighboring systems. 3. System frequency.
IJEDR1401027 International Journal of Engineering Development and Research ( www.ijedr.org) 159
IV.SOLVINGSCOPF
Before solving for security constraint optimal power flow base case should be solved, this can be either by normal power flow or optimal power flow. Here the initial base case is solved using optimal power flow and then the constraint is added to the base case to solve for SCOPF
V. SIMULATION AND RESULTS
An IEEE 7-bus power system is considered for SCOPF Simulation. For the same bus system OPF and SCOPF is solved .Figure-3 in this paper is from Power World Simulator. IEEE- 7 bus system is divided into three areas. Top area contains generator 1, 2, 3, and left area contains generator 4 and right area contains generator 5.
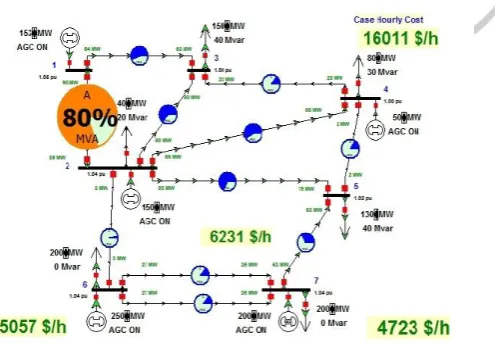
Figure 3: IEEE 7 bus system solved for OPF
Figure 3 shows a 7 bus IEEE system solved for OPF . it can be noted that line from bus 1 to bus 3 and line from bus 2 to bus 5 are loaded 86 % and 84 %. This is a threat to security of the power system as it could reduce the reliability of the transmission system. Thus to ensure security of the system by reducing the burden on the transmission line for the same system, security constraint optimal power flow is solved and the simulation is shown in figure 4 .
Figure 4: IEEE 7 bus system solved for SCOPF
IJEDR1401027 International Journal of Engineering Development and Research ( www.ijedr.org) 160
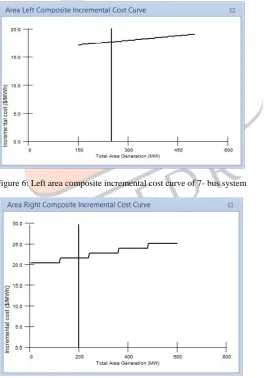
Figure 5: Top Area composite incremental cost curve of 7- bus system.
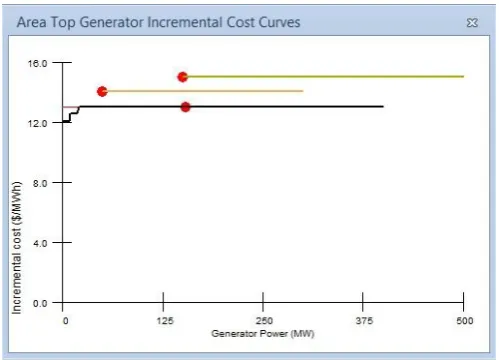
Figure -8 shows generator 1,2,3 incremental cost curve in top Area in 7 bus system. Figure -8 shows generator 4 incremental cost curve in left area.Figure-11 shows generator 5 incremental cost curve in right area in 7-bus system. The optimum value for operation of generator 4 is at 250 MW with incremental cost of 17.5$/MWhr. The optimum value for operation of generator 5 is at 200 MW with incremental cost of 22$/MWhr. The optimal value for operation of generator 1, 2, 3 is at 353 MW with an incremental cost of 13$/MWhr.
Figure 6: Left area composite incremental cost curve of 7- bus system
IJEDR1401027 International Journal of Engineering Development and Research ( www.ijedr.org) 161 Figure 8: Top Area Generator incremental cost curves of 7 bus system.
Figure 9: Top Area Generator incremental cost curves of 7 bus system.
Table 1: Showing percentage how transmission line loaded in 7-bus system while solving OPF and SCOPF
Line
Load While Solving
OPF
Load While Solving
SCOPF
1-2
49.0%
80%
1-3
86.2%
55.4%
2-3
63.6%
63.7%
2-5
83.9%
67.8%
2-6
21.6%
2.1%
3-4
14.5%
12.8%
4-5
18.5%
16.7%
5-7
28.5%
31.6%
6-7(1)
10.9%
13.4%
6-7(2)
10.9%
13.4%
Table 1 shows the difference in percentage of line loading for the 7-bus system while solving OPF and SCOPF. From the table it can be noted that line from bus 1 to bus 3 and line from bus 2 to bus 5 is loaded 86.2% and 83.9% respectively while solving for base OPF. While solving SCOPF for the same case line from bus 1 to bus 2 alone is loaded to 80%.
IJEDR1401027 International Journal of Engineering Development and Research ( www.ijedr.org) 162 Table 2: Showing the area cost for the system while solving OPF and SCOPF
Area
Cost While
Solving OPF
($/h)
Cost While Solving
SCOPF($/h)
Top
7989 $/h
6231 $/h
Left
4187 $/h
5057 $/h
Right
4711 $/h
4723 $/h
Total cost
16887 $/h
16011 $/h
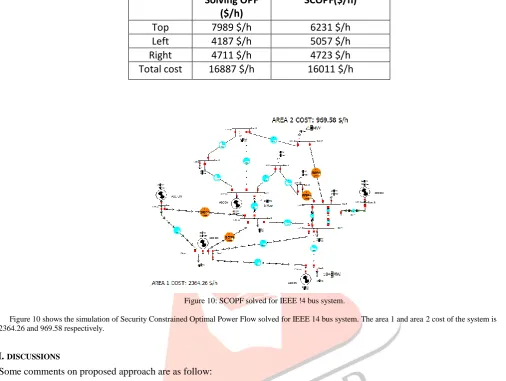
Figure 10: SCOPF solved for IEEE !4 bus system.
Figure 10 shows the simulation of Security Constrained Optimal Power Flow solved for IEEE 14 bus system. The area 1 and area 2 cost of the system is 2364.26 and 969.58 respectively.
VI. DISCUSSIONS
Some comments on proposed approach are as follow:
Non Linear Programming method is a fast method for solving OPF and provides optimal result in less computation time. Power World Simulator employs a Nonlinear programming (NLP) OPF implementation. It determines the optimal
solution by iterating between solving a standard power and then solving a linear program to change the system controls to remove any limit violations.
It is now possible to optimally dispatch the generation in an area or group of areas while simultaneously enforcing the transmission line and interface limits. Simulator OPF can then calculate the marginal price to supply electricity to a bus (also known as the locational marginal price), taking into account transmission system congestion.VII. CONCLUSIONS
In this work, an attempt is made to find optimum power solution for 7bus system and IEEE-14 bus system. Different objectives are considered to solve the problem and to minimize the cost of operation. The proposed method is used to consider different cases by varying MVAR load and the cost of operation is compared. Larger power systems can be considered in order to obtain more realistic results. Larger systems will allow for better flexibilities in OPF analysis. The SCOPF problem solved using power world simulator has ability to display the SCOPF results on system one-line diagrams and contour the results for ease of interpretation. By solving security constraint OPF the stability and reliability of the system is maintained.
VIII.FUTURESCOPE
The future scope is to implement this method to large power systems and to introduce FACTS device into the system for reactive power compensation and also to find the optimal location of FACTS devices in to the system.
IX.REFERENCES
A. D. Wood, B. F. Wollenberg, Power System Generation and Control, John Wiley & Sons, Inc, 1996.
IJEDR1401027 International Journal of Engineering Development and Research ( www.ijedr.org) 163
X. Tong and M. Lin, “Semi smooth Newton type algorithms for solving optimal power flow problems”, in Proc. of IEEE/PES Transmission and Distribution Conference, Dalian, China, pp.1-7,2005
A.J Wood and B.F. Wollenberg, “Power generation operation and control”, John Wiley and Sons, New York, 1984.
Pathak Smita, Prof. B.N.Vaidya, “Optimal Power Flow by Particle Swarm Optimization for Reactive Loss Minimization”, International Journal of Scientific & Technology Research Volume 1,Issue 1,Feb 2012.
J. Hazra and A. K. Sinha ,”A multi-objective optimal power flow using”, European transactions on electrical power, (2010) particle swarm optimization[3]M. Huneault and F. D. Galiana, “A survey of the optimal power flow literature,” IEEE Trans. Power Syst., vol. 6, no. 2, pp. 762– 770, May 1991.
J. D. Glover and M. Sarma, “Introduction Power System Analysis & Design, 2nd Edition ", PWS Publishing Company, Boston, 1994, pp. 1-12. R. H. Miller and J. H. Malinowski, “Economic Operation of Power Systems,” Power System Operation, 3rd Edition, McGraw-Hill, New York, 1970, pp. 63-82.
M. Huneault and F. D. Galiana, “A Survey of the Optimal Power Flow Literature,” IEEE Transactions on Power Systems, Vol. 6, No. 2, May 1991, pp. 762-770.
D. I. Sun, B. Ashley, B. Brewer, A. Hughes and W. F. Tinney, “Optimal Power Flow By Newton Approach,” IEEE Transaction on Power Apparatus and Systems, Vol. PAS-103, No. 10, October 1984, pp. 2864- 2880.
H. H. Happ, “Optimal Power Dispatch – A Comprehensive Survey,” IEEE Transactions on Power Apparatus and Systems, Vol. PAS-96, No. 3, May/June 1977, pp. 841-854.
H. W. Dommel and W. “Optimal Power Flow Solutions,” IEEE Transactions on Power Apparatus and Systems, Vol. PAS-87, October 1968, pp. 1866-1876.
J. A. Momoh, M. E. El-Hawary and R. Adapa, “A Review of Selected Optimal Power Flow Literature to 1993 Part I: Nonlinear and Quadratic Programming Approaches,” IEEE Transaction on Power Systems, Vol. 14, No. 1, February 1999, pp. 96-104.
J. A. Momoh, M. E. El-Hawary and R. Adapa, “A Review of Selected Optimal Power Flow Literature to 1993 Part II: Newton, Linear Programming and Interior Points Methods,” IEEE Transaction on Power Systems, Vol. 14, No. 1, February 1999, pp. 105-111.
J. A. Momoh, R. J. Koessler and M. S. Bond, “Challenges to Optimal Power Flow,” IEEE Transactions on Power Systems, Vol. 12, No. 1, February 1997, pp. 444-455.
R. C. Burchett, H. H. Happ, and K. A. Wirgau, “Large Scale Optimal Power Flow,” IEEE Transactions on Power Apparatus and Systems, Vol. PAS- 101, No. 10, October 1982, pp. 3722-3732.
H. Sadat, Power System Analysis, McGraw-Hill, Boston, 1999.