1 Evaluation of process parameters for fiber alignment of electrospun tubular nanofibrous
matrices: a DoE approach
Rossella Dorati1,5, Enrica Chiesa1, Silvia Pisani2, Ida Genta1,5, Tiziana Modena1,5, Giovanna
Bruni3, Chiara R.M. Brambilla1, Marco Benazzo4, Bice Conti1,5
1Department of Drug Sciences and 3Department of Chemistry, University pf Pavia, V.le
Taramelli 12/14, 27100 Pavia, Italy.
2 Department of Paediatric Oncoaematology IRCCS Policlinico S.Matteo, Pavia, P.zzle Golgi
1, 27100 Pavia, Italy
4Department of Otholaryngology Head Neck Surgery, University of Pavia and IRCCS
Policlinico S.Matteo, P.zzle Golgi 1, 27100 Pavia, Italy.
5Polymerix srl, V.le Taramelli 20, 27100 Pavia
Abstract
Electrospinning is known to be an effective and straightforward technique to fabricate polymer
non woven matrices made of nano and microfibers. Micro patterned morphology of electrospun
matrices results to be outmost advantageous in the biomedical field, since it is able to mimic
extracellular matrix (ECM), and favors cell adhesion and proliferation. Controlling electrospun
fibers alignment is crucial for the regenerative purposes of certain tissues, such as neuronal and
vascular. In this study we investigated the impact of electrospinning process parameters on
fiber alignment in tubular nanofibrous matrices made of Poly (L-lactide-co-ε-caprolactone)
(PLA-PCL); a Design of Experiments (DoE) approach is here proposed in order to statistically
set up the process parameters. The DoE was studied keeping constants the previously set
material and environmental parameters; voltage, flow rate and mandrel rotating speed were the
process parameters here investigated as variables. Orientation analysis was based on ImageJ
and plugin Orientation J analysis of SEM images. The results show that voltage combined with
flow rate has significant impact on electrospun fiber orientation, and the greatest orientation is
achieved when all the three input parameters (voltage, flow rate and mandrel rotation speed)
are at their maximum value.
Keywords:
Nanomaterials; Electrospun nanofibers; biodegradable 3D scaffolds; Electrospinning;
Design of Experiments.
2 1. Introduction
Electrospinning is known to be an effective and straightforward technique to fabricate polymer
non woven matrices made of nano and microfibers. The technique is based on interfacial
phenomena rising when an electric field is applied to a polymer solution. The electric field
generates a charge in the polymer solution, and when the electric force overcomes the solution
surface tension, a polymeric jet, making a typical Taylor cone, is generated from the surface
tension and travels towards the collector [1, 2]. Viscosity of the polymer solution and its surface
tension are interconnected since high viscosity stabilizes the forming fiber, while low surface
tension promotes its stretching. Electrospun nanofibrous matrix forms due to deposition of
entangled polymer fibres on the collector; polymer solvent evaporation from is provided in
jet pathway between needle and collector.
Electrospinning technique has been applied to several fields such as filtration, electronic and
photonic technology, and it has drawn particular attention in the biomedical area of tissue
engineering because the electrospun matrices, made of suitable biodegradable and
biocompatible polymers, can be seeded with cells and act as scaffold for tissue regeneration.
An important advantage of the electrospun matrices is their micro patterned morphology that
mimic extracellular matrix (ECM), thus favouring cell adhesion and proliferation. It has been
demonstrated in the literature that aligned nanofibers are able to orient cells in a specific
direction needed to provide the anisotropy encountered in certain organs including blood
vessels, muscular tunic of esophagus, urethra, and in general of any hollow organ or tubular
structure, and in tissues such as neuronal tissue [3-8]. Thus, the electrospinning parameters
should be profitably adjusted in order to control diameter, alignment of fibers, meanwhile
keeping suitable spinnable regimen of the polymer solution.
These parameters can be classified as follows: i) process parameters (electric field, polymer
solution flow rate, syringe needle gauge, mandrel rotating speed), ii) material parameters
(polymer solution viscosity, surface tension and ionic conductivity, polymer molecular weight)
and iii) environmental parameters (relative humidity (RH) and temperature of electrospinnng
chamber). Several authors account material parameters to be the most decisive factors for
spinnability and uniform shape of the fibers, while environmental parameters are derived
thereof. Eventually, once fixed the materials and environmental parameters, process
3
topic drawn interest for several years, and it still is of interest for those scientists working in
the area of tissue engineering, as demonstrate the papers found in the literature [12-17].
Aim of this work was study the electrospinning process parameters through a quality by design
approach. A Design of Experiments (DoE) was set up in order to statistically evaluate which
electrospinnig process parameters affect nanofiber alignment in electrospun tubular matrices
made of Poly (L-lactide-co-ε-caprolactone) (PLA-PCL).
PLA-PCL was selected because it is a biodegradable and biocompatible polymer whose
properties, such as long biodegradation time and elasticity, make it suitable for application in
regeneration of blood vessel and other hollow tubular human organs. The copolymer can also
be used in combination with other biodegradable polymers such as Polylactide or
Polylactide-co-glycolide. However, a lot of studies in the literature characterize these last polymers, while
less investigation has been performed on PLA-PCL copolymer, highlighting there is room for
studies on PLA-PCL addressed to regeneration purposes [17-20].
Quality by design approach is quite common in the pharmaceutical industry and it was applied
to electrospinning process with interesting results towards different variables and diverse
polymers [21][22]
Data processing: ImageJ software was used in this work to measure the orientation distribution
function of the fibers in a plane environment. This post processing technique is based on digital
imaging and takes advantages of using algorithm method to measure fiber orientation. The
technique finds consolidated application more in general with quality target product design
and more specifically for fiber alignment evaluation in particular in electrospinning [23][24,
25]
The investigated electrospun matrices are intended for tissue engineering applications, namely
vascular grafts or esophagus reconstruction, for this reason in this work attention was focused
on a biodegradable biocompatible polymer already approved by FDA for use in the human
4 2. Materials and methods
2.1.Materials
Poly (L-lactide-co-ε-caprolactone) 70:30, Mw 160241 Da (PLA-PCL, RESOMER LC 703 S)
was from Evonik Industries (Evonik Nutrition & Care GmbH, 64275 Damstadt, Germany).
Methylen chloride (MC) 99,9% purity and N,N-Dimethylformammide (DMF) 99,8% purity
were from Carlo Erba (Carlo Erba SpA, Milano, Italia).
2.2.Methods
2.2.1. Choice of polymer solvent and polymers ratio/concentration (material parameters)
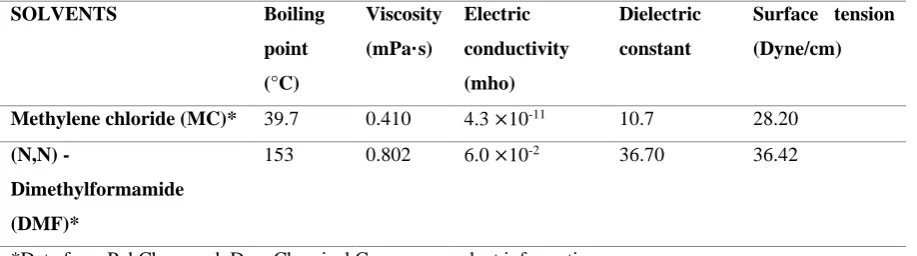
The solvents used in electrospinning process should have low boiling points, in order to
evaporate on the way to the electrospinning collector, and high dielectric constant in order to
promote fiber stretching. PLA-PCL is soluble in several organic solvents such as methylene
chloride, chloroform, carbon tetrachloride, dimethylformamide, tetrahydrofuran. The solvents
selected to solubilize PLA-PCL were Methylene chloride (MC) and Dimethylformamide
(DMF). MC was chosen because, is the one showing the lowest boiling point, i.e. 40 °C, among
the polymer solvents. However, its dielectric constant is 8.93, very low, and mixing with DMF,
whose dielectric constant is 36.7, although its high boiling point is 153 °C, permits to rise the
dielectric constant of polymer solution, improving nanofiber formation process. The properties
of the selected polymer solvents, to be considered for electrospinning process, are summarized
in Table 1.
Table 1: Properties of the polymer solvents (Boiling point, Viscosity, Electric conductivity,
Dielectric constant and Surface tension) selected for electrospinning process
SOLVENTS Boiling
point
(°C)
Viscosity
(mPa·s)
Electric
conductivity
(mho)
Dielectric
constant
Surface tension
(Dyne/cm)
Methylene chloride (MC)* 39.7 0.410 4.3 ×10⁻¹¹ 10.7 28.20
(N,N) -
Dimethylformamide
(DMF)*
153 0.802 6.0 ×10⁻² 36.70 36.42
5
Polymer concentration in the solvent mixture, and the solvents ratio was determined by
evaluating the crossover point between surface tension and viscosity curves of the copolymer
solutions at fixed concentration and different solvent ratios. According to the literature [16] this
corresponds to the best condition for electrospinning, since it is the point of lowest surface
tension and highest viscosity (namely high viscosity stabilizes the forming fiber and low
surface tension favors its stretching).
Surface tension of PLA-PCL 10 % and 15 % w/v solutions in the solvent mixtures of MC:DMF
60:40, 70:30, 75:25, 80:20 v/v ratios, were measured by Du Nouy's tensiometer with a manual
force tensiometer K6 (KRÜSS GmbH – Hamburg, Germany). The method involves slowly
lifting a platinum ring from the surface of a liquid. The force required to raise the ring from
the liquid's surface is directly proportional to its surface tension (γ) according to the following
Equation (1):
γ = F×k
2×Φ Equation (1)
where F is the force, k is the correction factor and Φ is the ring's circonference.
Viscosity values of the PLA-PCL solutions at 10% and 15 % w/v in solvent mixtures of
MC:DMF 60:40, 70:30, 75:25, 80:20 v/v ratios were measured by Rheometer Kinexus Pro
Malvern (Alfa Test, Cinisello Balsamo, Italy) with cone-plate geometry, constant share rate
100 s -1, 25 °C and solvent trap. The share rate value was chosen because it simulates the one
that develops inside electrospinning apparatus during ejection process.
2.2.2 Electrospinning of PLA-PCL
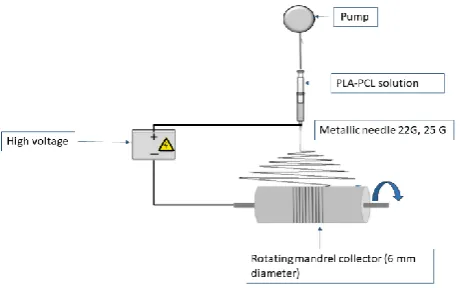
Figure 1 – Scheme of basic electrospinning set up equipped with pump, high voltage supply
6
Electrospinning apparatus Nanon-01A (MECC Instruments, Ltd, Ogo-shi, Fukuoka, Japan)
equipped with a dehumidifier system (196-1 Fukudo Ogori-Shi, Japan) was used.
Electrospinning process schematized in Figure 1 works as follows. Polymer solution is loaded
in a 5 mLLuer lock plastic syringe (Luer lock syringe, DB) and it is pumped through the syringe
needle, across an electric field generated by application of high voltage between the syringe
needle (primary electrode) and the collector (counter electrode). The electrospinning spinneret
set is vertical and moves with 50 mm/s fixed speed, a rotating mandrel was chosen as collector,
whose diameter was 6.0 mm, and 46.5 cm2 surface area. The gap between nozzle and the
rotating mandrel collector was maintained at 15 cm. Fiber deposition is driven by both electric
field and mandrel rotation, this latter developing a centripetal force on fibers. Electrospinning
time was 15 minutes for all samples. This time was chosen because it allows to form entangled
matrices completely coating the rotating mandrel surface independently of rotating mandrel
speed. The electrospinning time was fixed and it was not considered a variable, as long as
electrospinning temperature and relative humidity (RH%) that were 25 °C and 40%
respectively.
2.2.3 Design of experiment (DoE)
DoE is a systematic method to determine the relationship between variables affecting a process
and the output of that process. It is a statistical driven powerful data collection and analysis tool
that has been recognized useful in order to set up and optimize process parameters [20].
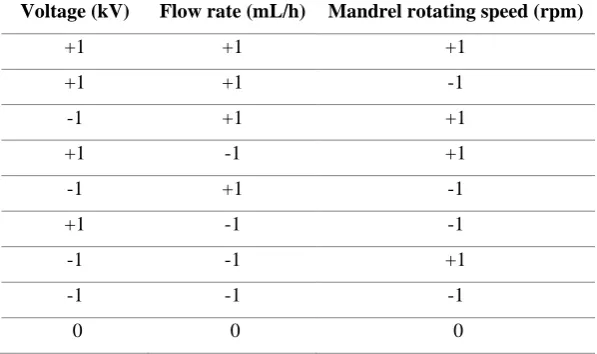
A DoE full factorial experimental design was applied, applied voltage (kV), mandrel rotating
speed (rpm) and polymer solution flow rate (mL/h) were the input variables (process
parameters), and fiber orientation was the output parameter analyzed as summarized in Table
2. The design matrix for the evaluated variables took into account all the possible combinations
of maximum and minimum values for each input variable, as reported in Table 3. Maximum
value was defined +1 and minimum value -1, intermediate value 0. Number of possible
combinations depends on number of input variables considered and was 2n, where n
corresponded to the number of input variables evaluated. Table 4 reports the design matrix of
the 9 possible combinations of the 3 input variables considered in this work.
The experiments were executed in random order as protection against dormant variables; two
degree of freedom were available to evaluate the experimental error. Response surface analysis
7
experiments was mapped to generate mathematical equations that describe how factors affect
the response. Materials parameters, i.e. PLA-PCL solution concentration and solvent mixture
composition were set following the results of preliminary evaluation on surface tension and
rheology measurements, and they were not considered input variables of DoE.
Table 2: DoE matrix set up
Number of input variables 3
Number of output parameters 1
Number of runs 9, including one central point per block
Degree of freedom 2
Randomized Yes
Table 3: Minimum, maximum and intermediate values of set input parameters
Table 4: Screening design matrix of the 9 possible combinations of the 3 input variables
considered.
Minimum value
(-1)
Intermediate value
(0)
Maximum value
(+1)
Voltage (kV) 22 26 30
Flow rate (mL/h) 1 3 5
Mandrel rotation speed
(rpm)
1000 1750 2500
Voltage (kV) Flow rate (mL/h) Mandrel rotating speed (rpm)
+1 +1 +1
+1 +1 -1
-1 +1 +1
+1 -1 +1
-1 +1 -1
+1 -1 -1
-1 -1 +1
-1 -1 -1
8
Starting from the matrix reported in Table 4, preliminary electrospinning tests were carried out
in order to select which could be the highest and the lowest value of each parameter achieving
a stable polymer jet in the electrospinning process, i.e. able to generate a Taylor cone. Please
note that the maximum voltage value corresponded to the maximum value allowed by the
apparatus specifications. The values of set input parameters derived from these preliminary
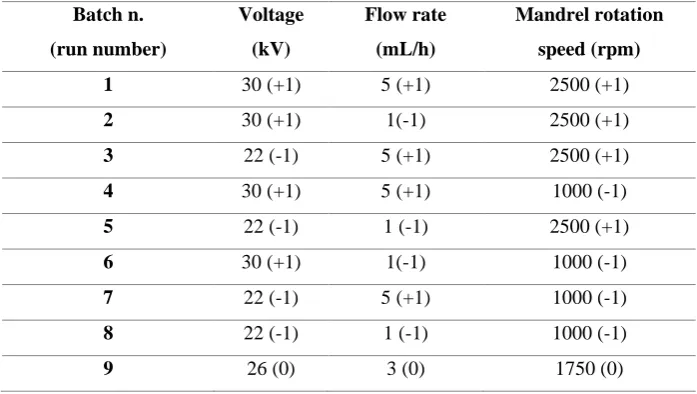
tests are listed in Table 3,and the consistently built design matrix is reported in Table 5.
Table 5: DoE design matrix derived from the values in Tables 3 and 4
Batch n.
(run number)
Voltage
(kV)
Flow rate
(mL/h)
Mandrel rotation
speed (rpm)
1 30 (+1) 5 (+1) 2500 (+1)
2 30 (+1) 1(-1) 2500 (+1)
3 22 (-1) 5 (+1) 2500 (+1)
4 30 (+1) 5 (+1) 1000 (-1)
5 22 (-1) 1 (-1) 2500 (+1)
6 30 (+1) 1(-1) 1000 (-1)
7 22 (-1) 5 (+1) 1000 (-1)
8 22 (-1) 1 (-1) 1000 (-1)
9 26 (0) 3 (0) 1750 (0)
Input and output factors were statistically processed by Statgraphics XVIII software (ANOVA,
regression coefficient R2), in order to avoid false positive and to get statistically significant
results. Voltage was set up as Factor A, flow rate was Factor B and mandrel rotation speed was
Factor C. The effect of the 3 factors was evaluate in 9 runs according to the matrix reported in
Table 5. Experiments execution was completely randomized in order to protect from effect of
dormant variables. Only 2 degree of freedom were involved in the evaluation of experimental
error.
2.2.4 Characterization of the electrospun nanofibrous matrices
All electrospun samples were analyzed by Scanning Electron Microscopy (SEM) with a Zeiss
EVO MA10 apparatus (Carl Zeiss, Oberkochen, Germany). All samples were dried and gold
9
Morphometric analysis of the electrospun nanofibers was quantitatively perfomed processing
SEM images by ImageJ software. This is an image processing program designed for scientific
multidimensional images and based on plugin series Diameter J Segment e Diameter J 1-018.
Diameter J Segment plugin algorithm works by segmenting SEM image and allows selection
of images. Selected segmented image/or images to best represent a sample should have the
following characteristics: absence of partial fibers, fiber intersection shouldn’t contains black
spots/hole. When two or more images of the sample are very similar, best choice should be the
one containing highest number of fibers. Super Pixel is the plugin that calculate mean fibers’
diameter, using a super pixel determination (the scale length set was 202 pixels for 1 cm). Mean
fibers’ diameter was determined by Histogram Mean, fitting a Gaussian Curve to the radius
data and finding the curves mean value. Histogram SD, delineates the standard deviation of the
Gaussian fit of the radius histogram. Histogram Mode and Histogram Median determine
respectively the most occurring fiber diameter in the histogram and the middle fiber diameter.
Histogram Min. Diam. and Histogram Max. Diam defines the smallest and the largest diameter
measured. Histogram Integrated Density calculates the product of length of the fibers and the
average radius, then Histogram Raw Integrated Density determines the sum of the radii at all
pixels in the image or selection. Diameter Skewness measures the third order moment about the
mean; Diameter Kurtosis the fourth. All analyzed data were then plotted by using Microsoft
Excel.
The values of orientation were obtained analyzing SEM images with ImageJ and plugin
Orientation J software , that analysed the degree of fiber orientation distribution from −90° to
+90°, of each SEM image using Fast Fourier transform (0° angle corresponded to the horizontal
orientation parallel to mandrel axis and increased counter-clockwise). Analysis was performed
on 6 SEM images for each electrospun matrix sample. Fiber alignment is expressed as
frequency %, calculated by taking how many times same + 90 ° fiber orientation repeats during
analysis of the same area of sample divided by the total number of total counted fibers in the
area and multiplied by 100. The greater frequency % value the more oriented are the
electrospun fibers.
Yield of process was determined for each sample from the following Equation (2)
𝑌𝑖𝑒𝑙𝑑 𝑜𝑓 𝑝𝑟𝑜𝑐𝑒𝑠𝑠 =𝑊𝑠
10
Where Ws is the sample weight and Wi is the amount of polymer in the starting polymer
solution, and it is calculated following Equation 3:
Wi= 15g
100 mL× mL of electrospun solution making a sample Equation (3)
Samples were prepared in triplicate and yield process variability evaluated in terms of mean ±
standard deviation (sd).
3. Results and discussion
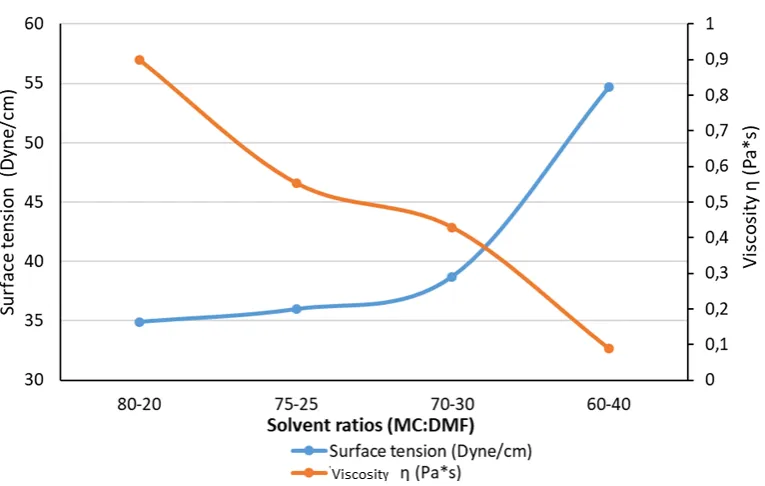
Figure 2 – Surface tension and viscosity curves of PLA-PCL 15 % w/v as a function of different
MC:DMF ratios .
The results of preliminary evaluation carried out to set up the material parameters are reported
in Figure 2 and show that PLA-PCL 15 % w/v solution increases its surface tension as long as
DMF content increases, while viscosity decreases in the same conditions. The crossover point
of the two curves resides between 70:30 and 60:40 solvent ratios. Similar result was obtained
for PLA-PCL 10 % w/v solution (curves not reported). Considering this result, two intermediate
solvent ratios 65:35 and 68:32 were selected and the PLA-PCL solutions were electrospun at
2500 rpm mandrel rotation speed. The preliminary set of tests were carried out in order to select
11
ratio between those that could be suitable. The results of SEM analyses (data not reported) show
that electrospinning of PLA-PCL 10% w/v solutions did not reach satisfactory results
independently of MC-DMF ratios tested; the fibers did not form regularly and some of them
were melted together originating irregular cluster inside the matrix. Electrospinning of
PLA-PCL 15 % w/v solutions gave better results in terms of regular fibers formation originating a
network with homogeneous structure. Starting from these results only electrospun matrices
obtained from PLA-PCL 15 % were processed further.
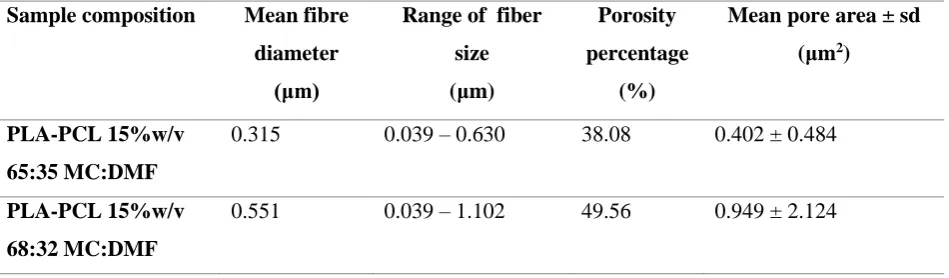
Table 6: Results in terms of fiber diameter and porosity obtained by software ImageJ, plugin
Diameter J and plugin Diameter J 1-018.
Sample composition Mean fibre
diameter
(μm)
Range of fiber
size
(μm)
Porosity
percentage
(%)
Mean pore area ± sd
(μm2)
PLA-PCL 15%w/v
65:35 MC:DMF
0.315 0.039 – 0.630 38.08 0.402 ± 0.484
PLA-PCL 15%w/v
68:32 MC:DMF
0.551 0.039 – 1.102 49.56 0.949 ± 2.124
SEM images referred to electrospun matrix obtained starting from 15 % w/v PLA-PCL
solutions in 65:35 and 68:32 MC-DMF blends, were processed by software ImageJ, and mean
fiber diameter, rank of fiber diameter porosity percentage, mean and standard deviation of pore
area were determined. The results reported in Table 6 highlight that mean diameter of
electrospun fibers is significantly smaller (0.314 µm with respect to 0.551 µm), and with
narrower range of fiber diameter (0.0394-0.6299 μm with respect to 0.0394 – 1.1024 μm),
when the solvent mixture MC:DMF 65:35 % v/v was used. However, the samples obtained
from 65:35 MC:DMF solution show lower porosity percentage and mean pore area with respect
to samples obtained from 68:32 v/v MC:DMF solution (38.08 % with respect to 49.56 %, and
0.4020 ± 0.484 μm2 with respect to 0.9492 ± 2.124 μm2 respectively ). Moreover, the matrices
obtained from 65:35 MC:DMF solution are more reproducible in these parameters, with lower
standard deviation.
These results led to select 65:35 v/v MC:DMF solvent ratio as the composition giving the
12
All SEM images show random orientation of the electrospun fibers. Starting from the set
material parameters, following DoE was addressed to achieve the best conditions to get fiber
alignment.
The results of input and output variables processed by Statgraphics XVIII ANOVA in order to
analyze which variable or couple of variables mostly affect fiber orientation, are reported in
Table 7.
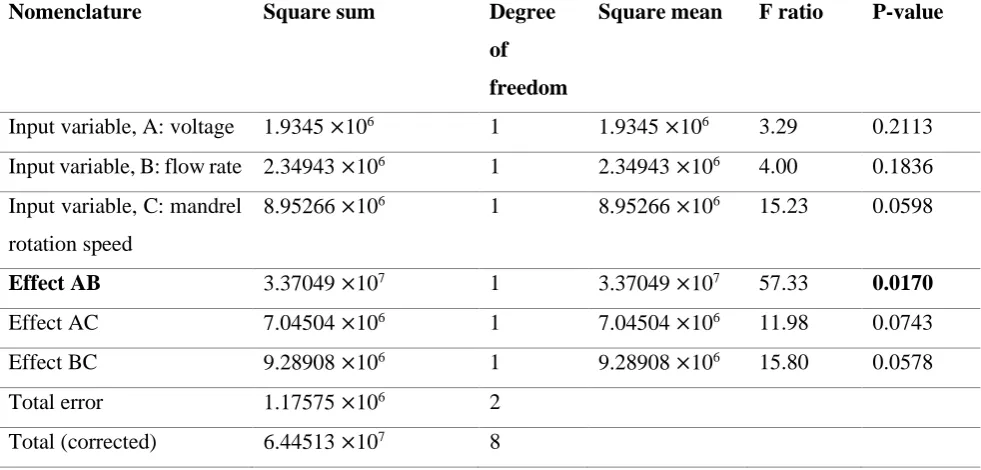
Table 7: Analysis of variance (ANOVA) on the three input variables (A, B, C) vs orientation
(output variable)
Nomenclature Square sum Degree
of
freedom
Square mean F ratio P-value
Input variable, A: voltage 1.9345 ×10⁶ 1 1.9345 ×10⁶ 3.29 0.2113
Input variable, B: flow rate 2.34943 ×10⁶ 1 2.34943 ×10⁶ 4.00 0.1836
Input variable, C: mandrel
rotation speed
8.95266 ×10⁶ 1 8.95266 ×10⁶ 15.23 0.0598
Effect AB 3.37049 ×10⁷ 1 3.37049 ×10⁷ 57.33 0.0170
Effect AC 7.04504 ×10⁶ 1 7.04504 ×10⁶ 11.98 0.0743
Effect BC 9.28908 ×10⁶ 1 9.28908 ×10⁶ 15.80 0.0578
Total error 1.17575 ×10⁶ 2
Total (corrected) 6.44513 ×10⁷ 8
ANOVA Table (Table 7) splits out orientation variability for each effect (made of couple of
variables) and verifies the statistic significance of each effect by comparing the square mean
with an evaluation of experimental error.
R-squared (R2) analysis indicated that the adjusted model fits 98.1758 % of variability in
orientation. R2 adjusted to degree of freedom, that better compares models with independent
variables and different numbers, resulted to be 92.703 %. R2 adjusted and R2 adjusted to degree of freedom resulted of same rank order and confirmed the dependent variable is well explained
by the independent variables and that the model was statistically significant. The standard error
of the estimated (residual standard deviation) was 766.729; mean absolute error (MAE) was
284.55 and corresponded to residues mean value. Based on the regression coefficients derived,
the following second degree equation (4) was applied to evaluate how each input variable or
13 Fiber Orientation = 42263.2 − 1440.07 × A − 7657.09 × B − 8.8776 × C +
256.573 × A × B + 0.312806 × A × C + 0.718373 × B × C Equation(4)
When the result of equation (4) is a positive value it indicates orientation of electrospun fibre,
whereas a negative result indicates lack of fibre orientation. Each number multiplied for the
value of each variable or couple of variables, indicates how each variable, or variables
interaction, affect fiber orientation. A greater value corresponds to stronger effect, and a lower
value to a weaker one.
The results in Table 7 and Figure 3 show that only AB effect (voltage and flow rate)
significantly affected electrospun fibers orientation with P-value lower than 0.05 indicating that
this effect significantly differs from 0 with a level of confidence of 95.0 %.
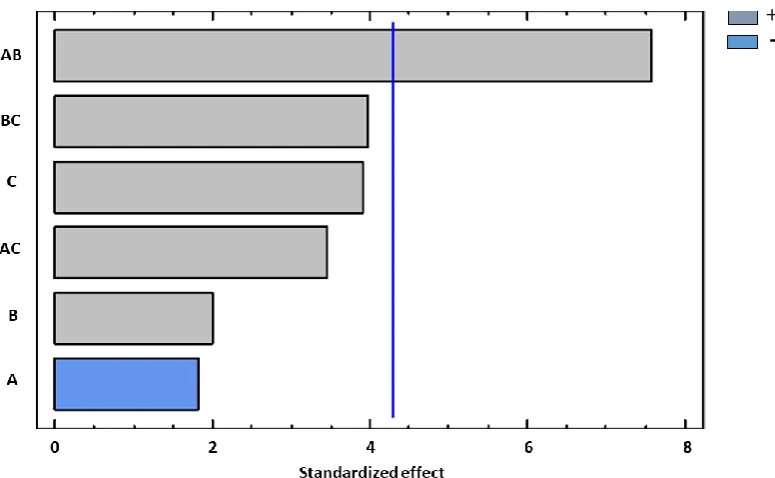
Moreover, Pareto chart in Figure 3 clearly show that each single input variable is not able to
significantly affect fiber orientation; voltage is the input variable with lower effect on
electrospun fiber orientation; only the combination of input variables voltage (A) and flow rate
(B) significantly affects electrospun fiber orientation.
Figure 3 – Pareto chart: influence of the input variables and combination of input variables on
14
The effect of each single input variable and of their interactions was decomposed and analysed
in the charts reported in Figure 4 .
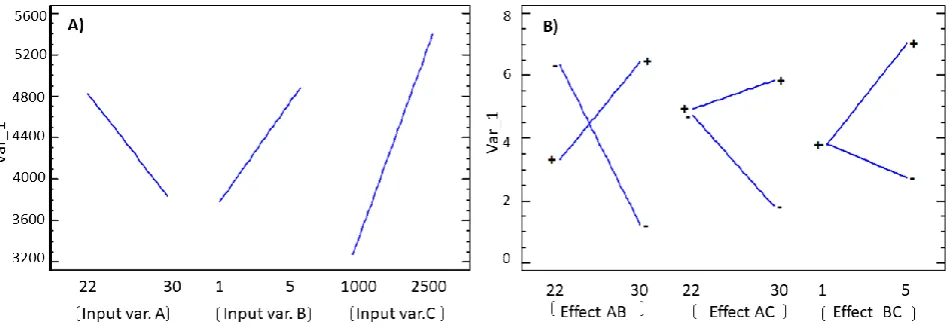
Figure 4 – Graphical representation of DoE results: A) effect of the single input variable on
electrospun fiber orientation (output variable); B) Effect of input variables interactions on
output variable.
Figure 4A shows that electrospun fiber orientation is promoted by low voltage (20 kV), high
flow rates (up to 5 mL/h) and high mandrel rotation speeds (2500 rpm).
As long as the interaction between input variables is concerned, three input variables
combination ( AB, AC, BC) were investigated and the results in Figure 4B confirm that main
interaction is voltage/flow rate (AB) that significantly affects fiber orientation degree (Figure
3). High voltage should be combined with low flow rate and vice versa, in order to achieve
high orientation degree. AC interaction show that high mandrel rotation speed always favors
high orientation degree, independently from the voltage applied. BC interaction indicates that
either low or high mandrel rotation speed can be combined to low flow rates in order to get high
fiber orientation, whereas in case of high flow rates, high mandrel rotation speed should be
applied for better fiber orientation.
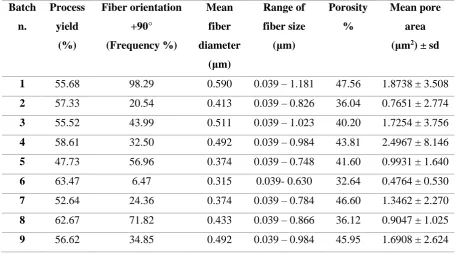
The values of electrospun fiber orientation obtained from ImageJ and plugin Orientation J
analysis of SEM images are reported in Table 8, and they confirm that the highest degree of
the electrospun fiber orientation (98.29 % frequency) is achieved for batch n. 1, i.e. when all
the three input parameters (Voltage (A), flow rate (B) and mandrel rotation speed (C)) are at
their maximum value. The results confirm those obtained by DoE statistical analysis.
15
three input variables are at minimum value, as confirmed by Figure 5 showing SEM images
of batches 1 and 8. Mandrel rotation speed demonstrated to be a crucial factor to fibre
alignment, but the combination of the three input variables also plays a significant role in fiber
alignment when electrospinning PLA-PCL copolymer. Most of the results of other authors
reported in the literature are in keeping with the influence of mandrel rotating speed on fibre
alignment Anyway, when comparing results found in the literature it should be taken into
account that, set up of mandrel rotation speed depends on type of electrospinning apparatus,
namely horizontal or vertical electrospinning, its brand, and the rotating mandrel diameter in
addition to the type of polymer and solvents used. [26] [27].
The same 9 runs data were analysed and processed by ImageJ software plugins Diameter J
1-018 and the results in Table 8 compared to those of fiber orientation highlighted no correlation
among fibers orientation, mean fiber diameter, range of fiber diameter and porosity. These
results are keeping with those of other authors found in the literature such as H.Wang ad coll
[5] who performed wet electrospinning process parameters evaluation on High amylose maize
starch (HAMS), and Choi and coll. [28] who evaluated electrospinning parameters on
poly(ε-caprolactone)/ collagen. In agreement with the literature diameter of electrospun fibers is
mainly governed viscous forces surface tension and electric field that determine jet elongation
and Taylor con stability.
Process yield was always lower than 64% (Table 8), and it did not result to be related to
electrospun fiber orientation. The result represent a drawback of the electrospinning process
16 Table 8: Results of Electrospun fibers characterization by ImageJ, plugin Diameter J 1-018 and
plugin Orientation J software on the 9 batches obtained in the conditions selected from DoE
design matrix
Batch
n.
Process
yield
(%)
Fiber orientation
+90°
(Frequency %)
Mean
fiber
diameter
(μm)
Range of
fiber size
(μm)
Porosity
%
Mean pore
area
(μm2) ± sd
1 55.68 98.29 0.590 0.039 – 1.181 47.56 1.8738 ± 3.508
2 57.33 20.54 0.413 0.039 – 0.826 36.04 0.7651 ± 2.774
3 55.52 43.99 0.511 0.039 – 1.023 40.20 1.7254 ± 3.756
4 58.61 32.50 0.492 0.039 – 0.984 43.81 2.4967 ± 8.146
5 47.73 56.96 0.374 0.039 – 0.748 41.60 0.9931 ± 1.640
6 63.47 6.47 0.315 0.039- 0.630 32.64 0.4764 ± 0.530
7 52.64 24.36 0.374 0.039 – 0.784 46.60 1.3462 ± 2.270
8 62.67 71.82 0.433 0.039 – 0.866 36.12 0.9047 ± 1.025
9 56.62 34.85 0.492 0.039 – 0.984 45.95 1.6908 ± 2.624
Figure 5 - SEM images of: A) batch 1 and B) batch 8.
5. Conclusions
The results of this study permit to identify from a statistical stand point the values of some
process parameters affecting electrospun fiber orientation, when the polymer is PLA-PCL
solubilized in the solvent mixture MC plus DMF. Namely, high voltage combined to high flow
17
collector and with a standard electrospinning apparatus. These set process parameters are
strictly dependent on the type of polymer and polymer solvents processed.
Author Contributions
Rossella Dorati supervised experimental plan, Enrica Chiesa carried out DoE, Silvia Pisani
performed data processing, Ida Genta supervised the manuscript, Tiziana Modena and Marco
Benazzo contributed to funding acquisition, Giovanna Bruni carried out SEM analysis, Chiara
R.M. Brambilla carried out electrospinning and ImageJ analysis, Bice Conti supervised the
research and wrote the final version of the manuscript
Funding information
The research received funding from the project “An hybrid approach to the repair of esophageal
defects: from bio scaffolds engineering to in vivo validation in the porcine model” supported
by Ricerca Corrente 2017 grant # 12835 coordinated by Prof. Marco Benazzo, IRCCS
Policlinico S.Matteo. Pavia, Italy.
Conflict of interest
The authors report no conflict of interest. The authors alone are responsible for the content and
writing of this article.
References
1. Cisquella-Serra, A.; Magnani, M.; Gual-Mosegui, Á.; Holmberg, S.; Madou, M.; Gamero-Castaño, M., Study of the electrostatic jet initiation in near-field electrospinning. Journal of colloid and interface science 2019, 543, 106-113.
2. Liu, S.; Reneker, D. H., Droplet-jet shape parameters predict electrospun polymer nanofiber diameter. Polymer 2019, 168, 155-158.
3. Choi, J. S.; Lee, S. J.; Christ, G. J.; Atala, A.; Yoo, J. J., The influence of electrospun aligned poly(ɛ-caprolactone)/collagen nanofiber meshes on the formation of self-aligned skeletal muscle myotubes. Biomaterials 2008, 29, (19), 2899-2906.
18 5. Wang, L.; Wu, Y.; Hu, T.; Ma, P. X.; Guo, B., Aligned conductive core-shell biomimetic
scaffolds based on nanofiber yarns/hydrogel for enhanced 3D neurite outgrowth alignment and elongation. Acta Biomater 2019, 96, 175-187.
6. Zhang, C.; Wang, X.; Zhang, E.; Yang, L.; Yuan, H.; Tu, W.; Zhang, H.; Yin, Z.; Shen, W.; Chen, X.; Zhang, Y.; Ouyang, H., An epigenetic bioactive composite scaffold with well-aligned nanofibers for functional tendon tissue engineering. Acta Biomater 2018, 66, 141-156. 7. Xue, J.; Wu, T.; Xia, Y., Perspective: Aligned arrays of electrospun nanofibers for directing cell
migration. APL Materials 2018, 6, (12), 120902.
8. Xia, H.; Xia, Y., An in vitro study of non-aligned or aligned electrospun poly(methyl
methacrylate) nanofibers as primary rat astrocytes-loading scaffold. Mater Sci Eng C Mater Biol Appl 2018, 91, 228-235.
9. Beachley, V.; Wen, X., Effect of electrospinning parameters on the nanofiber diameter and length. Materials science & engineering. C, Materials for biological applications 2009, 29, (3), 663-668.
10. Bhardwaj, N.; Kundu, S. C., Electrospinning: a fascinating fiber fabrication technique. Biotechnology advances 2010, 28, (3), 325-47.
11. Subbiah, T.; Bhat, G. S.; Tock, R. W.; Parameswaran, S.; Ramkumar, S. S., Electrospinning of nanofibers. Journal of Applied Polymer Science 2005, 96, (2), 557-569.
12. Young, R. E.; Graf, J.; Miserocchi, I.; Van Horn, R. M.; Gordon, M. B.; Anderson, C. R.; Sefcik, L. S., Optimizing the alignment of thermoresponsive poly(N-isopropyl acrylamide) electrospun nanofibers for tissue engineering applications: A factorial design of experiments approach. PLOS ONE 2019, 14, (7), e0219254.
13. Tsai, S.-W.; Yu, Y.-L.; Hsu, F.-Y., Fabrication of polycaprolactone tubular scaffolds with an orthogonal-bilayer structure for smooth muscle cells. Materials Science and Engineering: C
2019, 100, 308-314.
14. Domaschke, S.; Zündel, M.; Mazza, E.; Ehret, A., A 3D computational model of electrospun networks and its application to inform a reduced modelling approach. International Journal of Solids and Structures 2018, 158.
15. Yao, Z.-C.; Wang, J.-C.; Ahmad, Z.; Li, J.-S.; Chang, M.-W., Fabrication of patterned three-dimensional micron scaled core-sheath architectures for drug patches. Materials Science and Engineering: C 2019, 97, 776-783.
16. Tan, S. H.; Inai, R.; Kotaki, M.; Ramakrishna, S., Systematic parameter study for ultra-fine fiber fabrication via electrospinning process. Polymer 2005, 46, (16), 6128-6134.
17. Pisani, S.; Dorati, R.; Conti, B.; Modena, T.; Bruni, G.; Genta, I., Design of copolymer PLA-PCL electrospun matrix for biomedical applications. Reactive and Functional Polymers 2018, 124, 77-89.
18. Pisani, S.; Dorati, R.; Chiesa, E.; Genta, I.; Modena, T.; Bruni, G.; Grisoli, P.; Conti, B., Release Profile of Gentamicin Sulfate from Polylactide-co-Polycaprolactone Electrospun Nanofiber Matrices. Pharmaceutics 2019, 11, (4), 161.
19. Dorati, R.; Pisani, S.; Maffeis, G.; Conti, B.; Modena, T.; Chiesa, E.; Bruni, G.; Musazzi, U. M.; Genta, I., Study on hydrophilicity and degradability of
chitosan/polylactide-co-polycaprolactone nanofibre blend electrospun membrane. Carbohydrate Polymers 2018,
199, 150-160.
20. Dorati, R.; DeTrizio, A.; Genta, I.; Grisoli, P.; Merelli, A.; Tomasi, C.; Conti, B., An experimental design approach to the preparation of pegylated polylactide-co-glicolide gentamicin loaded microparticles for local antibiotic delivery. Mater Sci Eng C Mater Biol Appl 2016, 58, 909-17. 21. Abdelhakim, H. E.; Coupe, A.; Tuleu, C.; Edirisinghe, M.; Craig, D. Q. M., Electrospinning
Optimization of Eudragit E PO with and without Chlorpheniramine Maleate Using a Design of Experiment Approach. Mol Pharmaceut 2019, 16, (6), 2557-2568.
19 23. Gadala-Maria, F.; Parsi, F., Measurement of fiber orientation in short-fiber composites using
digital image processing. Polymer Composites 1993, 14, (2), 126-131.
24. Nazari, K.; Mehta, P.; Arshad, S.; Ahmed, S.; Andriotis, E.; Singh, N.; Qutachi, O.; Chang, M.-W.; Ahmad, Z., Quality by Design Micro-Engineering Optimisation of NSAID-Loaded Electrospun Fibrous Patches. Pharmaceutics 2019, 12, 21.
25. Ayres, C.; Bowlin, G. L.; Henderson, S. C.; Taylor, L.; Shultz, J.; Alexander, J.; Telemeco, T. A.; Simpson, D. G., Modulation of anisotropy in electrospun tissue-engineering scaffolds: Analysis of fiber alignment by the fast Fourier transform. Biomaterials 2006, 27, (32), 5524-5534.
26. Wang, H., Aligned wet-electrospun starch fiber mats. Food hydrocolloids 2019, v. 90, pp. 113-117-2019 v.90.
27. Selatile, M. K.; Ray, S. S.; Ojijo, V.; Sadiku, R., Correlations between Fibre Diameter, Physical Parameters, and the Mechanical Properties of Randomly Oriented Biobased Polylactide Nanofibres. Fibers and Polymers 2019, 20, (1), 100-112.
28. Choi, J. S.; Lee, S. J.; Christ, G. J.; Atala, A.; Yoo, J. J., The influence of electrospun aligned poly(epsilon-caprolactone)/collagen nanofiber meshes on the formation of self-aligned skeletal muscle myotubes. Biomaterials 2008, 29, (19), 2899-906.