2255
Intelligent Heart Disease Diagnosis System
Using Distance Based Outlier Detection With
Gradient Tree Boosting Algorithm
R. Bhuvaneeswari, P. Sudhakar, R. P. Narmadha
Abstract— Generally, outlier detection techniques recognize the abnormal data instances which deviates from most of the data in the dataset. In this paper, we present a new distance based outlier detection (DOD) model from the given patient’s care particularly heart disease, where every patient-management action are mainly based on the condition of the patient. This method intends to recognize the patient-management actions for a provided patient data which is highly abnormal with respect to previous patients with condition(s) which are identical to the ones that the provided patient suffers from. When a variation is identified, it might be employed to classify the patient data to identify heart disease. For classification purposes, gradient boosting tree (GBT) classifier is employed. To ensure the correctness of the presented DOD-GBT model, a set of two benchmark dataset namely Heart-Statlog and Cleveland heart disease dataset under several performance measures. The presented DOD-GBT classifier achieves a maximum of 96.70% accuracy whereas the GBT classifier without outlier identification attains a maximum of only 95.19% accuracy.
Index Terms—Heart disease; Outlier; Gradient boosting tree; Classification.
————————————————————
1 I
NTRODUCTIONIn medical domain, the existence of medical errors stays as a severe and constant problem [1,2] against the large enhancements in health-care domain. The popular Institute of Medicine’s report "To Err Is Human – constructing a safe Health System" has estimated over 98,000 and 44,000 Americans die every year due to the medical errors. The patient count who suffers from morbidities because of that error is calculated as high. A study in the year of 1999 computes that the total number of injuries cost for each year because of medical errors is 17 billion dollars minimally and avoid injuries while hospital care influence 2% patients in hospitals. When compared to the above estimations, recent studies aid that the original medical errors rate might be higher [3]. While hospitalizing, 2010 report [4] computes that adverse events have experienced by hospitalized Medicare beneficiaries at 13.5% and 44% events were avoidable who gains 6% as medical error rate. A survey is done in the hospitals at North Carolina which gives the medical error rate of about 6% and 16% [5]. The scope and emergence to solve the medical errors problem have induced the solutions development to support physicians in removing those errors. For monitoring the patients, the present computer tools are knowledge-based primarily.
The capability of monitoring data based on represented computer knowledge and derived a priori from medical experts.
These systems are time taking to construct and medical coverage is restricted quietly. A novel data-driven monitoring is represented in this paper which depends on saved medical data of history over statistical techniques for clinical outlier recognition. It offers an extensive method description and actual results [6]. The assumption is anomaly movement detection of patient unusual actions would aid to recognize medical errors. Knowledge-based alerting system usage is complemented through outlier-based monitoring and alerting method, which enhances the entire clinical alerting coverage. This novel method can acts as standard model in medical sub-areas wherever the knowledge-based alerting is still not available.
The abnormal data instances is recognized by typical outlier detection techniques which deviate from main instances of dataset [7, 8]. To recognize outliers in those settings, we construct distance based outlier detection (DOD) techniques [6, 8]. For the applied patient, this method focuses to recognize patient-management activities in order to previous condition of patients which are same to each other that the applied patient condition suffers. It might be employed to produce a patient-specific alert for clinician consideration when deviation is detected those who care for patients. With respect to medical errors, we need to comprise entire statistical outliers ideally. Therefore, this detection might tend to helpful medical alerts. Practically, patient-management activity which is abnormal from a statistical view does not correspond to useful medical alert always. The belief is that through outlier detection techniques, we can recognize errors to alert upon abnormal patient-management activities. The examination of relationship among the outliers finds helpful to alert medically. The outcomes from the conducted experiments over data exhibited that statistical outlier detection is correlated positively with classifying the heart disease datasets.
The electronic health records (EHRs) hospital use frequently the patient alerting and monitoring systems as an ————————————————
R. Bhuvaneeswari, Research Scholar, Department of Computer Science and Engineering, Faculty of Engineering and Technology, Annamalai University, Chidambaram, India. [email protected].
P. Sudhakar, Assistant Professor, Department of Computer Science and Engineering, Faculty of Engineering and Technology, Annamalai University, Chidambaram, India. [email protected]
2256 enhancement in patient care. With a view to recognize the
conditions or events, these systems quickly examine the patient data instances which it needs the clinical personnel attention. In case of event presence, the notifications are given as alerts or reminders. One significant alert class focuses to recognize the errors in patient management potentially. Instances involve alerts which are modeled to recognize significant medication omission, inconsistency in medication prescription, significant laboratory test with patient’s care and condition. The present computer systems which recognize alerts and errors in occurrence are knowledge-based typically. The medical knowledge that is derived from medical experts are codified and presented as rules that are used to patient data to detect detrimental events and conditions [9, 10]. For a medical decision support range, rule-based alerting models has been modeled like automated dosing guidelines, finding specific adverse drug reactions [11], drug-allergy checking. Those models had been modeled for other medical conditions involving, treatment protocols monitoring of infectious diseases, deviations detection from those protocols [12], growth disorders detection [13,14] and significant event detection medically in chronic conditions management like congestive heart failure. Various advantages are comprised by rule-based systems. They depend on clinical knowledge and probably, they are helpful medically. The automation of these rules is simple and might be used towards patient data readily which are accessible through electronic format. Human expert's inputs are needed by the rule creation that takes more time and complex one. The constrained coverage of huge potential adverse events space is accessed by rules majorly that is composite adverse events particularly. Rule based alerting models are composite and inflexible to adjust acceptable performance medically in environments they are adapted. Because of unacceptable huge false alert rates, it is unusual for alert rules to be turned off [15]. The produced alerts might be avoided because of huge false alert fatigue [16] even though those rules stay active.
This paper discusses the evaluation and development of outlier detection and classification model depends on recognizing the outliers in clinical care and classifying it. Outliers are the activities which are uncommon and might denote errors in the patient-management. The benefits of this methods are (i) to model a detection system, it does not need expert input (ii) empirically, the relative medical outliers are extracted by employing a huge set of history of patient cases and updated continuously to denote common practice patterns and iii) coverage of alert might be deep and extensive. For positive and extensive impact over medical care, this novel method comprises major potential. In this paper, we present a new distance based outlier detection (DOD) model from the given patient’s care particularly heart disease, where every patient-management actions are mainly based on the condition of the patient. This method intends to recognize the patient-management actions for a provided patient data which is highly abnormal with respect to
previous patients with condition(s) which are identical to the ones that the provided patient suffers from. When a variation is identified, it might be employed to classify the patient data to identify heart disease. For classification purposes, gradient boosting tree (GBT) classifier is employed. To ensure the correctness of the presented DOD-GBT model, a set of two benchmark dataset namely Heart disease Statlog and Cleveland dataset under several performance measures.
2
T
HEP
ROPOSEDM
ETHOD2.1 Distance based Outlier Detection (DOD) using kNN Graph
We describe K-nearest neighbour (kNN) graph as weighted directed graph, in that each vertex denotes a single vector, and the edge correspond to adjacent vector pointers. Towards k- nearest vectors, each vertex comprises of k edges exactly in order to provided distance function. The distance among vectors vi and vj is the edge weight that is denoted through edge ei. In computational geometry, the problem of producing kNN graph is represented as entire kNN problem. Through wide search, the graph might be built assuming entire pairwise distances at O(N)2 time cost. In O(kN+NlogN) time, the entire nearest neighbor problem might be resolved. For resolving the problem of clustering, the kNN graph might be employed.
Detecting Outliers with kNN Graph
For outlier detection, the kNN graph might be employed. Mutual k-Nearest Neighbour (MkNN) employs the particular kNN graph case. It describes an undirected proximity graph, that comprises of edge among vertices vj and vi when kNN graph comprise an edge from both vj to vi and from vi to vj.
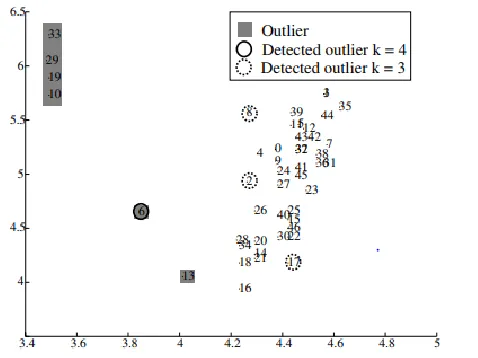
The associated elements form the cluster within data and associated elements with one vertex is described as outlier. An outlier is near to inlier which might be misclassified with particular problem definition. From Fig. 2, 13 and 16 are adjacent to each other, and it is not outliers in order to MkNN technique. In the definition of outlier, we require some additional flexibility. RRS method is projected that estimates kNN sparseness for entire dataset S vectors.
In an ascending order, the vectors are arranged in order to vector distance towards its kth neighbor. In the ordered list, the outliers are described as final n vectors. The instinctive idea is while kth vector distance is huge, vector is in sparse area, and is probably an outlier. The disadvantage of RRS is that user needs to know how many outliers exist in dataset in advance. Using kNN graph, we project the DOD and mean DIST algorithms in algorithm 1 and algorithm 2 respectively.
2257 Fig. 1. Overall process of the DOD-GBT method
2258 Algorithm 1 DOD
T is indegree threshold
Compute KNN graph of S
For i=1 to
|𝑆|
doIf indegree of vi ≤ T then Mark vi as outlier End if
End for
When vertex I comprises a T or less in degree, it is denoted as an outlier or inlier. Two control attributes are comprised by this projected technique namely the indegree threshold T and outgoing edges count k.Fig. 2 demonstrates the DOD results with indegree threshold T is set as zero with k=3 and k=4. This method correctly finds star 6 as outlier with k>=4, however, with any k value, star 13 is not detected. But, we recognize stars 6 and 13 while using threshold T=1, k=7 perfectly as outliers. To mention cut point in arranged list by extending RRS technique in sorted list through assuming the neighborhood differences as demonstrated in Fig. 3. We assume two various RRS method variants, maximum of kNN distances (KDIST), and kNN distances mean. From small towards large distances, while during ordered list scanning, we validate when difference among neighboring distance is huge when comparing with applied threshold. After outliers cut point, we describe vectors. The threshold is defined as:
T=max (Li-Li-1) * t (1)
Let Li is ithvector MeanDIST or KDIST and user defined parameter is denoted as t
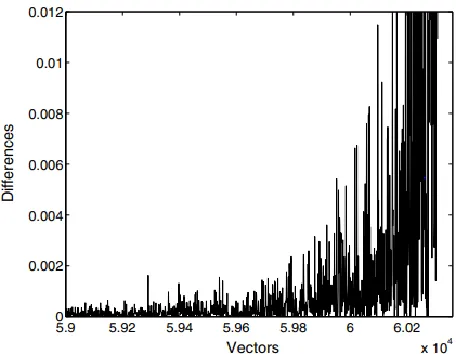
. In descending order, the kNN distances are sorted primarily and variance among neighboring distances. While moving towards right, we denote the variances grow rapidly.
Fig. 3. Differences of distances for HD dataset
Algorithm 2 MeanDIST Compute T using Eq. 1 with t Calculate kNN graph of S
L← Sort vectors in ascending order by kNN density Find smallest i for which Li-Li-1 ≥T
Mark Li ,,,,,,L_(|S| ) as outlier.
2.2. Gradient-Boosted Tree (GBT) classifier
Boosting is presented through defining a technique for "transforming weak learning technique into one which attains high accuracy randomly". In ―AdaBoost‖ technique, this scheme is used to solve the problems of classification. Using weak learners to re-weighted training data versions, boosting is used. The misclassified instance comprises of increased weights after every boosting iterations and precisely classified instances with decreased weights. Therefore, every subsequent classifier aims over instances which had been difficult to prior step classification. The weak classifiers series predictions are integrated through weighted majority vote into last prediction after the iteration count MGB. A variation of stochastic gradient boosting is presented. We sample without replacement of a training data subset over every iteration to suit the base learner. Various methods are used and chose at random mGBT features from p features over each division. Computational efficiency is enhanced using sub sampling process and commonly enhances performance and tree de-correlation. We employ H2O’s AdaBoost implementation, using shallow decision trees as weak learners. We comprise four attributes to set: boosting iterations MGBT, tree counts, learning rate λGBT, tree depth JGBT, feature subset to use at every split that is mGBT. When MGBT is high, boosting might over fit potentially, hence the iteration counts are fixed as 100 as highly conservative rates when comparing with offered examples in some surveys. Boosting depends on weak learners that are shallow trees which result commonly in huge performance. We fix JGBT value as three as it only division enable for no parameter interaction effects for two-way interactions. The tree counts and learning rate are inversely proportion to the applied static error rates. We set for upper spectrum end and we fix at 0.1 as λGBT by considering low tree counts. We employ 15 which is the half part of feature space available for mGBT. The common idea of gradient boosting decision tree is merging a weak base classifiers series into strong one. Through the variation from conventional boosting technique which weight negative and positive samples, through following negative gradient direction, GBT creates the global technique convergence. The dataset is denoted through {〖xi,yj }〗_(i=1)^n. Soft max refers the loss function. To make sure the GBT convergence, the technique of Gradient descent is employed. h(x) is the fundamental learner wherever xi = (x1i, x2i, . . ., x pi). The predicted variable count is denoted through P. predicted label is referred by yi. The GBT steps are represented as below.
Step 1: The primary constant value of the model β is derived as:
𝐹 (𝑥) = 𝑎𝑟𝑔 min ∑ 𝐿(𝑦 𝛽) (2)
2259 residual directions are estimated.
𝑦 = − ( ( )) ( ) ( ) ( ), i = {1, 2, . . . , N} (3)
Step 3: to suit sample data, the fundamental classifiers are employed and derive the primary model. The model parameter am is derived in order to least square approach and model h (xi; am) is suited.
am=arg 𝑚𝑖𝑛 ∑ 𝑦 − 𝛽ℎ(𝑥; 𝑎) (4)
Step 4: Loss function is reduced. In order to Eq. (4), a novel model step size, named as the present model weight, is estimated.
𝛽 = 𝑎𝑟𝑔 min ∑ L(yi Fm − (x) + βh(xi; a)) (5)
Step 5: the model is updated as follows:
Fm(x) = Fm−1(x) + βmh(xi; a) (6) But, restricted to size and dimension of sample data, multiple times, the information feature branch point gain is estimated while raw data is given as input towards GBT to be examined. It tends to enhance the iteration count and reduces the convergence speed and update. We project to improvise the primary data in this paper that is input towards GBT through employing ABC. The primary sample data feature dimensions is minimized highly through the projected method and produces quickly a decision tree to derive the feature weights when efficiency and accuracy guaranteeing of GBT.
3.
P
ERFORMANCEE
VALUATIONVarious analysis were carried out in order to proposed DOD-GBT for the heart disease (HD) prediction and the outcomes are discussed below. Distance based outlier Detection (DOD) is used to detect the outliers and the instances are subjected to classification further using Gradient Boosting Tree (GBT). Description of dataset, class distribution, frequency distribution, confusion matrix, performance evaluation and comparison with recently proposed methods are provided in the following sections.
3.1 Dataset Description
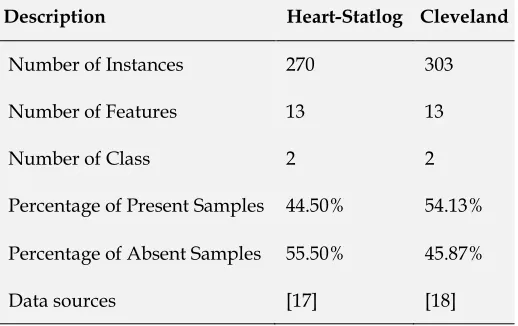
Two standard datasets such as Heart-Statlog [16] and Cleveland [17] were used for the performance evaluation of DOD-GBT. Two classes, 13 number of features, 270 instances are comprised by Heart-Statlog dataset whereas 55.50% of sample belongs to absent instances, 44.50% belongs to present instances. And, Cleveland dataset contains two classes, 13 number of features and 303 instances in which 55.50% of that belongs to absent instances, and 44.50% belongs to present instances. Table 1 demonstrates the dataset descriptions. Table 2 shows the description of attribute which it has data type, attribute name and dataset descriptions. For most of the
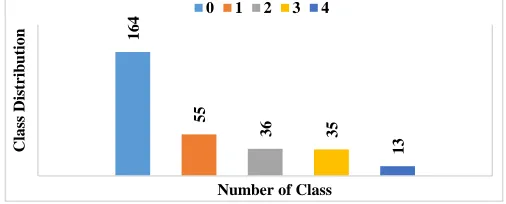
attributes, the data type is real and nominal. For instance, some of the attributes are age, sex, restbps, cp, etc., For Heart-Statlog and Cleveland dataset, Figs. 4 and 5 shows the frequency distribution of HD. Then, the class distribution is demonstrated in Fig. 6 for HD datasets
.
Table 1 Dataset Description
Description Heart-Statlog Cleveland
Number of Instances 270 303
Number of Features 13 13
Number of Class 2 2
Percentage of Present Samples 44.50% 54.13%
Percentage of Absent Samples 55.50% 45.87%
Data sources [17] [18]
Table 2 Attributes Description
2260 Fig. 4. Frequency Distribution of Heart Statlog Dataset for all Attributes
Fig. 5. Frequency Distribution of Cleveland Heart Disease Dataset for all Attributes
Fig. 6. Class Distributions
164
55
36 35
13
C
la
ss
D
is
tr
ib
u
tio
n
Number of Class
2261
(a) (b) (c) (d)
(e) (f) (g) (h)
(i) (j) (k) (l)
(m) (n)
2262
δ=10
δ=20
δ=30
2263
Fig. 9.AUC of Outliers δ=10 Fig. 10.AUC of Outliers δ=20
Fig. 11. AUC of Outliers δ=30
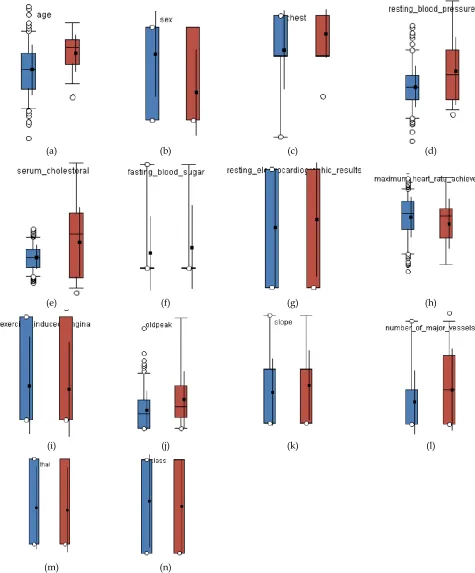
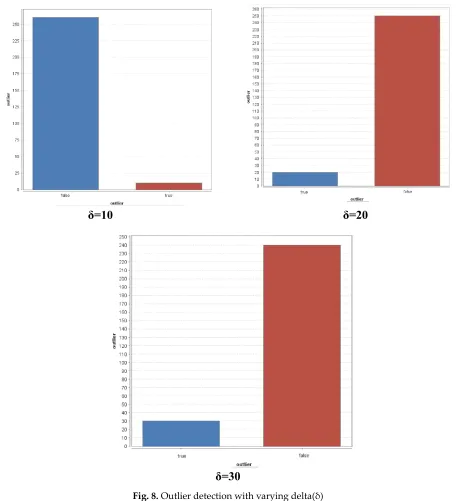
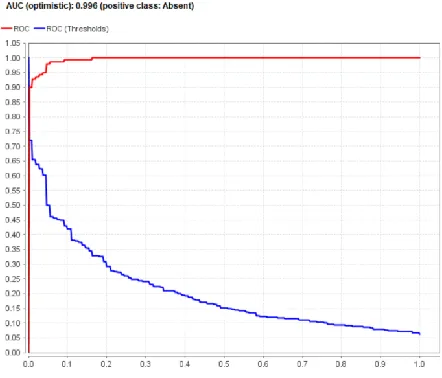
Fig. 7 shows the Comparison of Attributes Distribution with Outliers on Heart Statlog Disease Dataset. Fig. 8 shows the Outlier detection with varying delta(δ) which was detected through by the Distance based Outlier detection method. For δ=10, 10 are detected as outlier whereas 262 is detected as false. For δ=20, 20 are detected as outlier whereas 250 is detected as false. For δ=30, 30 are detected as outlier whereas 240 is detected as false. The representations of outliers are given in Fig 8. Figs. 9-11 shows the AUC curve of outliers with varying delta (δ). For δ=10, the attained AUC curve for the projected DOD-GBT method is 0.991. For δ=20, the attained AUC curve for the projected DOD-GBT method is 0.996. For
2264
Table 4 Performance Evaluation of Different Levels of Outliers Detection δ=10,20,30 on Gradient Boosted Tree
Classifiers on Heart Statlog Disease Dataset
Levels of Outliers Sensitivity Specificity Precision Recall Accuracy F-Score Kappa
δ=10 95.53 94.59 93.04 95.53 95.00 94.27 89.84
δ=20 97.19 95.80 94.54 97.19 96.40 95.85 92.67
δ=30 92.72 99.23 99.02 92.72 96.25 95.77 92.41
Fig. 12. Comparison of various measures on different levels of outliers on Heart Statlog Disease Dataset
The highest accuracy rate of 96.40 is achieved while δ=20. The highest F-Score rate of 95.85 is achieved while outlier level is 20. The highest kappa rate of 92.67 is achieved while outlier level is 20.
3.3. Outlier Detection Results for Cleveland Heart disease Dataset
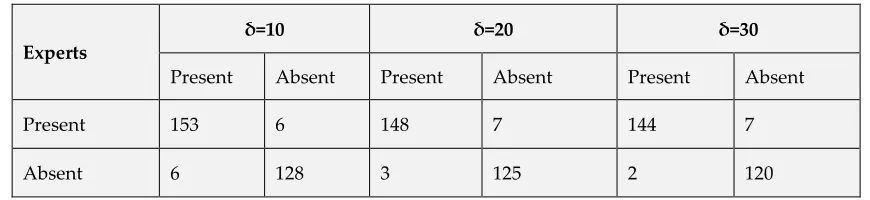
For various levels of Outliers Detection (δ), the confusion matrix for Cleveland Heart disease Dataset is shown in table 5. By using the values gained using confusion matrix, classifier performances are computed. For δ=10, the number of 153 instances are under present category whereas it offers 128 in absent category. For δ=20, the number of 148 instances are under present category whereas it offers 125 in absent category. For δ=30, the number of 144 instances are under present category whereas it offers 120 are in absent category
for Cleveland Heart Disease Dataset. Fig. 13 shows the comparison of Attributes Distribution with Outliers on Cleveland Heart Disease Dataset. Through the Distance based Outlier detection scheme, Fig. 14 demonstrates the Outlier detection with variation in δ. For δ=10, 10 are detected as outlier whereas 290 is detected as false. For δ=20, 20 are detected as outlier whereas 280 is detected as false. For δ=30, 30 are detected as outlier whereas 273 is detected as false. Figs. 15-17 shows the AUC curve of outliers with varying delta (δ). For δ=10, the attained AUC curve for the projected DOD-GBT method is 0.992. For δ=20, the attained AUC curve for the projected DOD-GBT method is 0.994. For δ=30, the attained AUC curve for the projected DOD-GBT method is 0.993. Among all the compared δ values, superior AUC outcomes are demonstrated through δ=20.
84 86 88 90 92 94 96 98 100
Sensitivity Specificity Precision Recall Accuracy F-Score Kappa
Measures
2265
(a)
(b)
(c)
(d)
(e)
(f)
(g)
(h)
(i)
(j)
(k)
(l)
(m)
(n)
2266
δ=10
δ=20
δ=20
Fig.14. Outlier detection with varying delta(δ)
Table 5 Confusion Matrix of Different Levels of Outliers Detection δ=10,20,30 on Cleveland Heart Disease Dataset
Experts
δ=10 δ=20 δ=30
Present Absent Present Absent Present Absent
Present 153 6 148 7 144 7
2267 Fig. 15. AUC of Outliers δ=10
Fig. 17. AUC of Outliers δ=30
Fig. 16. AUC of Outliers δ=20
Fig. 18 shows the performance evaluation of different levels of Outliers Detection δ=10,20,30 on Gradient Boosted Tree Classifier on Heart Statlog Disease dataset. The performance is measured by specificity, recall, F-Score, sensitivity, precision, accuracy and kappa. For sensitivity, higher rate of 98.63 is achieved when δ=30. The high specificity rate is attained while δ=10. From the different outlier levels, the highest precision rate of 96.22 is attained when δ=30. The highest recall rate of 98.63is achieved when δ=30. The high specificity rate is attained while δ=10. From the different outlier levels, the highest precision rate of 96.22 is attained when δ=30. The highest recall rate of 98.63 is achieved while δ=30. The highest accuracy rate of 96.70 is achieved while δ=30. The highest F-Score rate of 96.97 is achieved while outlier level is 30. The highest kappa rate of 93.36 is achieved while outlier level is 30.
Table 6 Performance Evaluation of Different Levels of Outliers Detection δ=10,20,30 on Gradient Boosted Tree
Classifiers on Cleveland Heart Disease Dataset
Levels of Outliers Sensitivity Specificity Precision Recall Accuracy F-Score Kappa
δ=10 96.22 95.52 96.22 96.22 95.90 96.22 91.74
δ=20 98.01 94.69 95.48 98.01 96.47 96.73 92.89
2268 Fig. 18. Comparison of various measures on different levels of
outliers on Cleveland Heart Disease Dataset
3.4 Comparative analysis of Heart Statlog Dataset In examining the proposed DOD-GBT classifier over the applied datasets, few measures like sensitivity, precision, accuracy, kappa, specificity, recall, and F-score are used. To represent the projected classifier efficiency, it is compared with five other classifiers namely, Gradient Boosted Tree, J48, RT (RT), NBTree, Random Forest (RF) and radial basis function (RBF) Network. The confusion matrix of the different classifiers is represented in Table 7 over the given heart-statlog dataset. By employing the values gained using confusion matrix, classifier performance is computed. It is absolute from the table, J48 classifies 88 instances are under the present category, and 119 are under the absent category. RT classifies 89 samples as a present and 117 samples as absent types of heart disease. NBTree classifies 90 samples as a present and
127 samples as absent types of heart disease. Random Forest (RF) classifies 94 samples as a present and 127 samples as absent types of heart disease. RBF classifies the 97 of the instances as present and 130 as absent cases in HD prediction out of the 130 instances. The Gradient boost classifier provides 115 samples under the present type of HD and 142 under the absent type of HD. The proposed DOD-GBT provides 104 samples under the present type of HD and 137 under the absent type of HD. Confusion matrix for different classifiers is represented in Table 8 over the given Cleveland dataset. By using the values gained using confusion matrix, classifier performances are computed. It is absolute from the table, Random tree (RT) classifies 125 instances are under present category, and 96 are under the absent case. NBTree classifies 134 samples as a present and 106 samples as absent types of heart disease. J48 classifies 135 samples as a present and 103 samples as absent types of heart disease. RBFNetwork classifies the 138 of the instances as present and 115 as absent cases in HD prediction out of the 303 instances. Random Forest (RF) classifies 141 samples as a present and 108 samples as absent types of heart disease. The Gradient boost classifier provides 151 samples under the present type of HD and 137 under the absent type of HD. The proposed DOD-GBT provides 144 samples under the present type of HD and 120 under the absent type of HD. It also provides minimized counts of false positive and true negative values while comparing with conventional classifiers. The graphical representation of precision, sensitivity, accuracy, specificity, kappa, recall, and F-score is given below in Figs. 19-21 and the values are given in Table 9. The performance values are offered using percentage.
Table 7 Confusion Matrix of Different Classifiers on Heart Statlog Dataset
Experts
Proposed GBT J48 Random Tree RBFNetwork NBTree Random Forest
Present Absent Present Absent Present Absent Present Absent Present Absent Present Absent Present Absent
Present 104 6 115 5 88 32 89 31 97 23 90 30 94 26
Absent 3 137 8 142 31 119 33 117 20 130 23 127 23 127
Table 8 Confusion Matrix of Different Classifiers on Cleveland Heart Disease Dataset
Experts
Proposed GBT J48 Random Tree RBFNetwork NBTree Random Forest
Present Absent Present Absent Present Absent Present Absent Present Absent Present Absent Present Absent
Present 144 7 151 13 135 29 125 39 138 26 134 30 141 23
Absent 2 120 2 137 36 103 43 96 24 115 33 106 31 108
88 90 92 94 96 98 100
Measures
2269
Table 9 Performance Evaluation of Different Classifiers on Heart Statlog Dataset
Classifiers Sensitivity Specificity Precision Recall Accuracy F-Score Kappa
Proposed 97.19 95.80 94.54 97.19 96.40 95.85 92.67
Gradient Boosted Tree 93.49 96.59 95.83 93.50 95.19 94.65 90.27
J48 73.94 78.81 73.33 73.95 76.66 73.64 52.71
Random Tree 72.95 79.05 74.16 72.95 76.29 73.55 52.08
RBFNetwork 82.91 84.97 80.33 82.91 84.07 81.86 67.67
NBTree 79.64 80.89 75.00 79.64 80.37 77.25 60.02
Random Forest 80.34 83.00 78.33 80.34 81.85 79.32 63.16
Fig. 19. Comparison of Different Classifiers on Heart Statlog Dataset in terms of Sensitivity, Specificity
Fig. 19 demonstrates the comparison among different classifiers over classifying result of the dataset Statlog using Sensitivity, Specificity. For sensitivity, RT classifier attains the poor performance of 72.95%. J48 offers the sensitivity rate of 73.94% which is more or less demonstrates a same rate as RT.
NBTree classifier exceeds the above mentioned method through attaining the sensitivity rate of 79.64, but it fails to outperform the GBT classifier which attains the higher sensitivity rate of 93.45%.
Fig. 20 Comparison of Different Classifiers on Heart Statlog Dataset in terms of Precision, Recall
9 7 .1 9 9 5 .8 9 3 .4 9 9 6 .5 9 7 3 .9 4 7 8 .8 1 7 2 .9 5 7 9 .0 5 8 2 .9 1 8 4 .9 7 7 9 .6 4 8 0 .8 9 8 0 .3 4 83 Sensitivity Specificity
Proposed GBT J48 Random Tree RBFNetwork NBTree Random Forest
94.54 95.83 97.19 93.5
73.33 74.16 80.33 73.95 72.95
82.91
75 78.33 79.64 80.34
Precision Recall
2270 However, the proposed DOD-GBT method attains the highest
sensitivity rate of 97.19% which shows that it is the better method using sensitivity rate. For specificity, as similar to sensitivity, RT and J48 demonstrate more or less the same specificity rate of 79.05% and 78.81%. However, Random forest classifier outperforms by obtaining the specificity rate of 83.00% which is higher than the other two methods except for the proposed method. The GBT achieves 96.59% of specificity rate when classifying the HD dataset. However, the proposed DOD-GBT method attains the highest sensitivity rate of 97.19% which shows that it is the better method using sensitivity rate. As shown in Fig. 20, for precision, J48 classifier gives the poor performance of 73.33%. RT gives the precision rate of 74.16% which is more or less demonstrates a similar rate as J48. RBF classifier outperforms the above mentioned method by achieving the precision rate of 80.33, but it fails to outperform the Gradient boost classifier which attains the maximum precision rate of 95.83%. For recall, as similar to precision, RT and J48 demonstrate more or less the similar recall rate of 72.95% and 73.95%. However, RBF classifier outperforms by obtaining the recall rate of 82.91% which is higher than other two methods. The GBT model achieves 93.50% of recall rate while classifying the HD dataset. whereas the projected model attains the higher recall rate of 97.19.
Fig. 21 shows the comparison of various classifiers interms of accuracy, F-score and kappa value. For F-score, RT and J48 demonstrate more or less the similar rate of F-score of 73.55 and 73.64 respectively. The classifier RBF attains 81.86% of F-score rate. Above all, the projected model attains the F-F-score rate of 95.85 which is best among all. Fig. 21 shows the classifier performance using accuracy for the given HD dataset. RT and J48 demonstrate more or less the similar rate of accuracy of 76.29 and 76.66 correspondingly. The classifier RBF attains 84.07% of accuracy rate. Above all, the proposed model attains the accuracy rate of 96.40 which is best among the compared methods. Fig. 21 shows the classifier performance using Kappa Value for the given HD dataset. For kappa-value, RT gives the poor performance of 52.08%, and J48 gives the Kappa value rate of 52.71%. RBF classifier outperforms the above mentioned method by attaining the Kappa value of 67.67%, however it fails to outperform the projected DOD-GBT which attains the maximum Kappa value of 90.27% whereas GBT attains 90.27 as kappa rate. Therefore, for the given HD dataset, the proposed method attains the enhanced performance for all metrics like precision, sensitivity, accuracy, kappa, specificity, recall, and F-score.
Fig. 20 Comparison of Different Classifiers on Heart Statlog Dataset in terms of Precision, Recall
Fig. 21 Comparison of Different Classifiers on Heart Statlog Dataset in terms of accuracy, F-score and kappa
As shown in Fig. 20, for precision, J48 classifier gives the poor performance of 73.33%. RT gives the precision rate of 74.16% which is more or less demonstrates a similar rate as J48. RBF classifier outperforms the above mentioned method by achieving the precision rate of 80.33, but it fails to outperform the Gradient boost classifier which attains the maximum precision rate of 95.83%. For recall, as similar to precision, RT and J48 demonstrate more or less the similar recall rate of 72.95% and 73.95%. However, RBF classifier outperforms by obtaining the recall rate of 82.91% which is higher than other two methods. The GBT model achieves 93.50% of recall rate while classifying the HD dataset. Whereas the projected model attains the higher recall rate of 97.19.
Fig. 22 demonstrates the comparison among different classifiers over classifying result of the dataset Cleveland using Sensitivity, Specificity. For sensitivity, RT classifier gives the poor performance of 74.41%. J48 gives a sensitivity rate of 78.94%.
96.4 95.19 95.85 94.65 92.67
90.27 76.66 73.64 52.71 76.29 73.55 52.08 84.07 81.86 67.67 80.37 77.25 60.02 81.85 79.32 63.16
Accuracy F-Score Kappa
2271 Fig. 22. Comparison of Different Classifiers on Cleveland Heart Disease Dataset in terms of Sensitivity, Specificity
Fig. 23. Comparison of Different Classifiers on Cleveland Heart Disease Dataset in terms of Precision, Recall
RBF classifier outperforms the above mentioned method through achieving the sensitivity rate of 85.19, but it fails to outperform the Gradient boost classifier which attains the sensitivity rate of 98.69%. The proposed method attains sensitivity rate of 98.63% which shows that it is the better method using sensitivity rate. For specificity, as similar to sensitivity, NBTree and J48 demonstrate more or less the similar specificity rate of 77.94% and 78.03%. However, Random forest classifier outperforms by obtaining the specificity rate of 82.44% which is higher than the other two methods except for the proposed and Gradient boost classifier method. The Gradient boost classifier model attains 91.33% of specificity rate while classifying the HD dataset.
Whereas the projected method attains the specificity rate of 94.49% which is the highest among all while classifying the given dataset. For precision, RT classifier gives the poor performance of 76.21% as shown in Fig. 23. NBTree gives the precision rate of 81.71%. RF classifier outperforms the above-mentioned method by attaining the precision rate of 85.98, but it fails to outperform the GBC which attains the maximum precision rate of 92.07%. This method is overcome by the proposed method which shows higher performance of 98.63% which it is the better method using precision rate. For recall, as similar to precision, RT and NBTree demonstrate more or less the similar recall rate of 74.40% and 80.24%.
98.63
94.49
98.69
91.33
78.94 78.03
74.41
71.11
85.19
81.56
80.24 81.98 77.94 82.44
Sensitivity Specificity
Proposed GBT J48 Random Tree RBFNetwork NBTree Random Forest
95.36 98.63
92.07
98.69
82.32
78.94
76.21 74.4
84.15 85.18
81.71 85.98 80.24 81.97
Precision Recall
2272 Fig. 24. Comparison of Different Classifiers on Cleveland Heart Disease Dataset in terms of Accuracy, F-score, Kappa
However, RBF classifier outperforms by obtaining the recall rate of 85.18% which is higher than the other two methods. The GBC model attains 98.69% of recall rate when classifying the HD dataset. But, the projected DOD-GBT method attains the recall rate of 98.63% which is the highest recall rate among all the compared method when classifying the given HD dataset. For F-score, NBTree and J48 demonstrate more or less the similar rate of F-score of 80.97 and 80.59 respectively as depicted in Fig. 24. The classifier RBF attains 84.66% of F-score rate. Above all, the proposed model achieves the F-score rate of 93.36 which is superior among all. Fig. 10 shows the classifier performance using accuracy for the given HD dataset. NBTree and J48 demonstrate more or less the similar rate of accuracy of 79.21 and 78.55 respectively. The classifier RBF attains 83.49% of accuracy rate. Above all, the proposed model achieves the accuracy rate of 96.70 which is best among the compared methods because of the implication of outlier detection method prior to classification. Fig. 24 also shows the classifier performance using Kappa Value for the given HD dataset. For kappa-value, RT gives the poor performance of 45.38%, and J48 gives the Kappa Value rate of 56.64%. RBF classifier outperforms the above mentioned method by attaining the Kappa Value of 66.81%, but it fails to outperform the Gradient boost classifier which attains the maximum Kappa Value of 90.09%. Above all, the projected DOD-GBT attains the higher kappa value of 93.36%. Therefore, for the given HD dataset, the proposed method attains the enhanced performance for all metrics like precision, sensitivity, accuracy, kappa, specificity, recall, and F-score due to the inclusion of outlier detection technique prior to classification. able 11 gives a comparison of the proposed method with the recently projected classifier using accuracy for the given datasets. The pictorial representation is given in Fig. 25.
Table 11 Comparison with Recent Methods for Heart Disease Dataset in terms of Accuracy
Classifiers Accuracy The Proposed Model 96.70 Gradient Boosted Tree 95.19
J48 76.66
Random Tree 76.29 RBFNetwork 84.07 NBTree 80.37 Random Forest 81.85 Rotation Forest Ensemble Classifiers(2001) 80.49 Khemphila and Boonjing (2011) 80.99 Shouman et al. (2011) 84.10 Pruned J48 Decision Tree (2013) 73.79 Chaurasia and Pal (2013) 83.49 Subanya and Rajalaxmi (2014) 86.76 Nahar et al. (2014) 69.11 Extreme Learning Machine (2015) 80.00 Hybrid Genetic Fuzzy Model (2015) 86.00 Ismaeel et al. (2015) 86.50 El-Bialy et al. (2015) 78.54 Logistic Regression (2016) 85.00 Paul et al. (2016) 80.00 Verma et al. (2016) 80.68 Vivekanandan et al. (2017) 83.00 Ensemble Model (2019) 88.88 Amin et al. (2019) 87.41
96.7 96.97 93.36 95.05 94.81 90.09 78.55 80.59 56.64 72.94 75.3 45.38 83.49 84.66 66.81 79.21 80.97 58.06 82.18 83.93 63.95
Accuracy F-Score Kappa
2273 Fig. 25. Comparison of Recently Proposed Method with Our Method
Fig. 25 shows the comparison of entire recently proposed method by means of accuracy. The classifiers like J48, RT, Rotation Forest Ensemble Classifiers, RBF, Pruned J48 DT, Extreme Learning Machine, Hybrid Genetic Fuzzy Model, LR and Ensemble Model are compared with the projected DOD-GBT. It is absolute from the table that the classifier Pruned J48 DT shows poor performance over the others by gaining the accuracy rate of 73.79. Consequently, the classifiers J48 and RT are the subsequent worst performer which obtains more or less the similar accuracy rate of 76.66 and 76.29. At the same time, the classifiers Rotation Forest Ensemble Classifiers and Extreme Learning Machine are the next poor performer which obtains more or less the similar accuracy rate of 80.49 and 80.00. The classifiers RBF, LR, Hybrid Genetic Fuzzy Model, and Ensemble Model demonstrate the accuracy rate of 84.07, 85.00, 86.00 and 88.88 correspondingly. The other methods do not give a notable performance. The Gradient boost classifier is the classifier which outperforms all the other classifiers, but it fails in works well when compared to projected classifier. The proposed DOD-GBT is the classifier that show higher performance of 96.70% which is superior among all. Therefore, the projected method is superior by gaining the higher accuracy rate to classify the given HD dataset.
4
C
ONCLUSIONThis paper discusses the evaluation and development of outlier detection and classification model depends on recognizing the outliers in clinical care and classifying it. Outliers are the activities which are uncommon and might denote errors in the patient-management. In this paper, we
have presented a new DOD model from the given patient’s care particularly HD, where every patient-management action are mainly based on the condition of the patient. For classification purposes, GBT classifier is employed. Various analysis were carried out in order to proposed DOD-GBT for the HD prediction and the outcomes are discussed above. Two standard datasets such as Heart-Statlog and Cleveland were used for the performance evaluation of DOD-GBT. The experimental results verified that the presented DOD-GBT model is effective over the compared methods in a significant way.
R
EFERENCES[1] Kohn LT, Corrigan JM, et al. To err is human: building a safer health system. National Academy Press; 2000. [2] Starfield B. Is US health really the best in the world?
JAMA 2000;284(4):483–5.
[3] Classen DC, Resar R, Griffin F, Federico F, Frankel T, Kimmel N, et al. ‘Global Trigger Tool’ shows that adverse events in hospitals may be ten times greater than previously measured. Health Aff2011;30:581–9.
[4] Levinson DR. Adverse events in hospitals: national incidence among Medicare beneficiaries. Contract no.: Department of Health and Human Services, Office of the Inspector General, Report number OEI-06-09-00090; 2010. [5] Landrigan CP, Parry GJ, Bones CB, Hackbarth AD,
Goldmann DA, Sharek PJ. Temporal trends in rates of patient harm resulting from medical care. New Engl J Med 2010;363:2124–34.
0 10 20 30 40 50 60 70 80 90 100
2274 [6] Hauskrecht M, Valko M, Batal I, Clermont G,
Visweswaran S, Cooper GF. Conditional outlier detection for clinical alerting. In: Proceedings of annual American Medical Informatics Association symposium; 2010. p. 286– 90.
[7] Chandola V, Banerjee A, Kumar V. Anomaly detection: a survey. ACM Comput Surv 2009;41(3). *9+ Markou M, Singh S. Novelty detection: a review – part 1: statistical approaches. Signal Process 2003;83:2481–97.
[8] Hauskrecht M, Valko M, Kveton B, Visweswaran S, Cooper GF. Evidence-based anomaly detection. In: Proceedings of annual American Medical Informatics Association symposium; 2007. p. 319–324
[9] Bates D et al. Ten commandments for effective clinical decision support: making the practice of evidence-based medicine a reality. J Am Med Inf Assoc 2003;10:523–30. [10]Shortliffe EH, Fagan LM, Perreault LE, Wiederhold G.
Medical informatics: computer applications in health care and biomedicine. 2nd ed. New York: Springer Verlag; 2000.
[11]Classen DC, Pestotnik SL, Evans RS, Burke JP. Computerized surveillance of adverse drug events in hospital patients. JAMA 1991;266:2847–51.
[12]Evans RS, Pestotnik SL, Classen DC, Clemmer TP, Weaver LK, Orme Jr JF, et al. A computer-assisted management program for antibiotics and other antiinfective agents. New Engl J Med 1998;338:232–8.
[13]HaimowitzIJ, Kohane IS. Managing temporal worlds for medical trend diagnosis. ArtifIntell Med 1996;8(3):299– 321.
[14]HaimowitzIJ, Le PP, et al. Clinical monitoring using regression-based trend templates. ArtifIntell Med 1995;7(6):473–96.
[15]Lawless ST. Crying wolf: false alarms in a pediatric intensive care unit. Crit Care Med 1994;22:981–5.
[16]Weingart SN, Toth M, Sands DZ, Aronson MD, Davis RB, Phillips RS. Physicians’ decisions to override computerized drug alerts in primary care. Arch Int Med 2003;163:2625–31.


![trans Di μ iodido bis[(3H 1,2 benzodithiole 3 thione)iodidomercury(II)]](data:image/gif;base64,R0lGODlhAQABAIAAAP///wAAACH5BAEAAAAALAAAAAABAAEAAAICRAEAOw==)