Article
1
Optimal Overcurrent Relay Coordination for
2
Sustainable Standalone Hydrokinetic Renewable
3
Energy (SHRE) Distribution Network at Batang
4
Rajang River, Kapit Sarawak by Genetic Algorithm
5
Technique.
6
Saiful Zuhaimi Ahmad *, Mohammad Lutfi Othman *, Hashim Hizam, Almalik Faisel Mohd.
7
Saupi and Azimi Che Soh
8
Centre for Advance Power and Energy Research (CAPER), Department of Electrical and Electronic
9
Engineering, Universiti Putra Malaysia, 43400 Serdang, Selangor, Malaysia; [email protected] (H.H.);
10
[email protected] (A.F.M.S.); [email protected] (A.C.S.)
11
* Correspondence: [email protected] (S.Z.A.) Tel. +60-013-208-3846; [email protected] (M.L.O.); Tel.:
12
+60-019-275-5209
13
These authors contributed equally to this work
14
Abstract: This paper presents a study on optimization of Overcurrent relay (OCR) coordination
15
protection scheme for Sustainable Standalone Hydrokinetic Renewable Energy (SHRE) distribution
16
network at Batang Rajang river, located at Kapit Sarawak, Malaysia by turning river stream into
17
power generation source. The purpose of the project is to develop rural electrification system for
18
native long houses along the river. The research study is tested on a DigSILENT develop model of
19
the SHRE distribution network and in accordance with all respectively unique parameters and
20
relevant standards. Since this is a new standalone distribution system, an efficient and properly
21
coordinated overcurrent protection system must be provided. Improper and miscoordination
22
among OCRs result in maloperation of the protection system that can lead to false tripping and an
23
unnecessary outage and power system instability. Thus, the objective of this work is to employ
24
Genetic Algorithm (GA) technique in Matlab/Simulink for optimal overcurrent coordination and
25
settings among all OCRs in the proposed distribution network in order to improve the speed of
26
OCR tripping operation. The GA is used because the project is fast track and requiring the simplest
27
method available. In this strategy, time dial setting (TDS) is optimized by using plug setting
28
multiplier (PSM) as the constraint. The obtained results show a significant improvement of the
29
relay operating time of 36.01% faster than that of conventional numerical technique during fault
30
occurrence. Thus, an efficient and reliable overcurrent protection scheme has been achieved for the
31
SHRE distribution network.
32
Keywords: Overcurrent relay (OCR); Genetic algorithm (GA); Time dial setting (TDS); Plug setting
33
multiplier (PSM); Optimal OCR setting and coordination and DigSILENT power factory
34
35
1. Introduction
36
The development of Sustainable Standalone Hydrokinetic Renewable Energy (SHRE) project is
37
to distribute power supply for rural area by harvesting its river current as the alternative energy. The
38
hydrokinetic system uses a very unique horizontal cross flow blade which is developed as shown in
39
Figure 1 to suit the river conditions. The SHRE system is unique, off grid system and successfully
40
installed at the Batang Rajang river, the longest river in Malaysia as Figure 2 to Figure 3.
41
42
Figure 1. SHRE turbine blade.
43
44
Figure 2. Proposed distribution network
45
46
Figure 3. Proposed pontoon location.
47
R1 R2 R3 Bus 3 Bus 2 Bus 1 Bus 4 I12 LQtr LSch LLH
I23 I34
IQtr
ILH ISch
SHRE Turbine
49
Figure 4. SHRE distribution network equivalent circuit.
50
Several considerations need to be taken into account especially on its reliability and safety of the
51
distribution network to ensure safety, uninterrupted and sustainable production of power [1], [2],
52
[3]. The protection scheme for the mentioned distribution network must be correctly designed and
53
configured in order to avoid and minimize damages to people, equipment and properties during
54
fault occurrence [4]. The protection system should also have functions of improving system stability,
55
detecting faults, separating or isolating faulty section from the rest of the system and restore normal
56
operation after the fault clearance [2]. The study of the reliability of a protection system is critical and
57
must be incorporated with power system reliability studies [4], [5]. There are some standards that
58
need to be complied in providing a protection scheme to any distribution network. The IEEE
59
Standards outlines the characteristic features a protection system must possess dependability and
60
security [6].
61
2. Overcurrent relay coordination
62
An overcurrent relays (OCRs) are ones of the most common protective devices implemented in
63
power distribution system in limiting the effect of damages by short circuit overcurrent fault [7]. The
64
role of a protective relay is to detect system abnormalities and to selectively execute appropriate
65
commands to isolate only the faulty component from the healthy system. The protective relays
66
monitor the current and voltage of the power system to detect problems in the power system [8].
67
Protective relays are connected to the power system over instrument transformers known as the
68
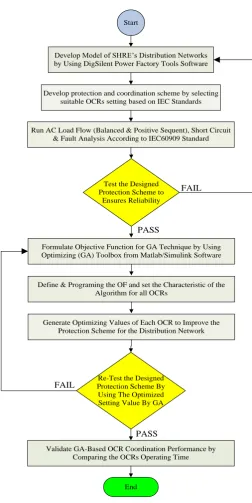
current transformer (CT) and the voltage transformer (VT). The relay itself is also connected to the
69
circuit breaker (CB), which receives trip commands to selectively eliminate the fault. Inverse type
70
overcurrent relay clears the heaviest fault quickly [8], [9]. In the event primary relay fails to operate,
71
a backup protection scheme is provided by backup relay to overcome this circumstance [10]. In
72
order to have a proper coordination between primary and backup relay, the graph theory is used
73
and referred [11]. Further discussion on the overcurrent relay characteristic will be discussed in the
74
next chapter.
75
2.1. Overcurrent relay characteristic
76
In power system, all of these OCRs must be properly set and coordinated [8], [10]. The
77
operating time of the OCR can vary according to relay type, time dial setting (TDS) and magnitude
78
of the fault current. According to ICE 60255 Standards, the relay operating time can be expressed as
79
in Equation (1) and (2) below.
80
1 SC Pickup TDS T I I
(1)81
SC PickupI
PSM
I
(2)82
Where: α and β are selected constant
Isc : Short circuit current
84
Ipickup : Relay pickup current
85
PSM : Plug setting multiplier
86
PSM varies in the range of 50% to 200% and in steps of 25% [10]. This setting is only used for
87
inverse current which have different type of characteristic according to IEEE and IEC constant for
88
OCRs that is chosen. PSM is different depending on what type of the selected curve based on the
89
appropriate constant as shown in Table 1.
90
Table 1. IEEE and IEC constant.
91
Curve Type α β
Standard Inverse 0.02 0.14
Very Inverse 1.0 13.5
Extremely Inverse 2.0 80.0 Long-time Inverse 1.0 120
2.2. Overcurrent relay coordination problem
92
The protection arrangement for any power system must take into account the basic principles of
93
reliability, speed and selectivity [12]. These are crucial in relay coordination where the determination
94
of the time delays of all backup relays is performed [13]. There are two groups of relaying equipment
95
for electrical power system protection against short circuit fault on distribution system network [7].
96
The first is called primary relay and the other backup relay. The primary or main relay is the first line
97
of protection element on any protection system, the failure of which initiates the next line of
98
protection known as the secondary or backup protection relay [13]. An effective coordination
99
scheme ensures that a backup relay always operates at least after a coordination time interval (CTI)
100
in situations where the primary relay fails to initiates or detect same fault earlier [7]. Coordination of
101
these devices for effective protection scheme is very important. In other words, when a short circuit
102
faults occurs, both selected relay pair (primary and backup) normally will start to operate, but
103
primary relay will trip necessary breakers earlier to isolate the short circuited element from the
104
system, while backup relay reset without completing its operational function [14]. Table 2 shows the
105
basic of OCRs coordination and protection scheme in a radial distribution network.
106
Table 2. Primary relay and backup relay.
107
Fault Location Primary relay Backup relay Fault No. 3 (F3) Relay No. 3 (R3) Relay No. 2 (R2)
Fault No. 2 (F2) Relay No. 2 (R2) Relay No. 1 (R1)
Fault No. 1 (F1) Relay No. 1 (R1) -
108
Improper and miscoordination among OCRs result in wrong trips of healthy section s and lead
109
to unnecessary outages and compromises the power quality and stability [8]. However, if OCR
110
operating time is too long, it also may result in damages of power apparatus, installation and
111
endanger to personnel safety [15]. For each fault location, taking into account in the event that any of
112
these devices fails, each should be backed up by another protective device. Many methods have been
113
suggested to perform the coordination of OCRs in power distribution system [16]. The suggested
114
methods can be classified into two categories – classical or conventional approaches and modern
115
techniques and approaches [10]. The modern techniques and approaches for OCRs coordination are
116
not only to have optimal solutions for coordinated protection scheme in any electrical distribution
117
network but also to clear faults in the shortest possible time while avoiding false trips due to relay
118
malfunctions. Thus GA optimization technique and approach is selected for this particular study.
119
The relay coordination task described in this paper in the form of constrained optimization problems
120
2.3. Objective function
122
The objective function (OF) is normally expressed in a specified mathematical equation that is
123
used in decision analysis and optimization studies. In this research work, the OF is formulated as
124
below in order to get the optimal solution of it and to avoid overcurrent relay miscoordination [16].
125
2 2
1 1 2 & 1 1
(
n( ) )
i(
n(
i))
i m b
OF
t
t
t
(3)126
In this equation, the first term of the Equation (3),
(
1
nn1( ) )
t
i 2 , is the sum of OCRs127
operation time. The second term of the above mentioned equation (3),
128
2 2 & 1
(
nm b(
t
i
(
t
it
i))
is the coordination constraint. The symbolα
1, α
2 and β are the129
weighting factors which are not only able to increase and empower the concentration of each term
130
but also the GA parameters that can be customized depending on the optimization application.
131
Moreover,
t
i represents the operating time of OCRs and∆t
i is the discrimination between the132
main and backup OCRs.
133
3. Methodology
134
GA based optimization technique is proposed to reduce the operation time of each relay by
135
improving the coordination between relays. The optimal values for TDS which affect the operation
136
times of each relays according to IEC 60255-151:2009 standard are obtained in this case. The research
137
procedure is depicted as Figure 5. In every application all parameters can be changed to get the best
138
result and optimize the relays. Therefore, every research including this work has its own unique and
139
novel parameters values which would contribute to innovative knowledge.
140
Start
Develop Model of SHRE’s Distribution Networks by Using DigSilent Power Factory Tools Software
Develop protection and coordination scheme by selecting suitable OCRs setting based on IEC Standards
Run AC Load Flow (Balanced & Positive Sequent), Short Circuit & Fault Analysis According to IEC60909 Standard
Test the Designed Protection Scheme to
Ensures Reliability
Formulate Objective Function for GA Technique by Using Optimizing (GA) Toolbox from Matlab/Simulink Software
Define & Programing the OF and set the Characteristic of the Algorithm for all OCRs
Generate Optimizing Values of Each OCR to Improve the Protection Scheme for the Distribution Network
Re-Test the Designed Protection Scheme By Using The Optimized Setting Value By GA
Validate GA-Based OCR Coordination Performance by Comparing the OCRs Operating Time
End
FAIL
PASS
FAIL
PASS
142
Figure 5. Research flowchart.
143
3.1. Overcurrent relay characteristic
144
Figure 6 shows a model of the SHRE distribution network with actual load data measured at
145
site and it consists of 1 feeder and 4 buses in a radial system. The distribution network is energized
146
by 11kV generators that connect to 1MVA 11/0.44kV step down distribution transformer. The
147
purpose of this configuration is just to make sure the power flow is suitable for fault analysis
148
performed on the distribution side. This entire scheme of power system is for modeling and
149
151
Figure 6. SHRE distribution network model.
152
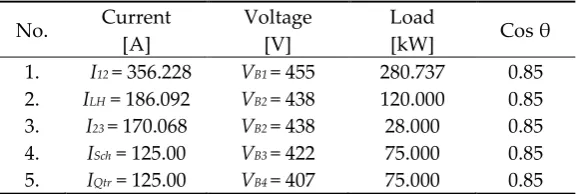
Different capacities of loads are connected into the distribution network, load for Long House
153
(LH) is 120kW connected to Bus 2, load for school (LSch) is 28kW connected to Bus 3 and load for
154
quarters (LQtr) is 75kW connected to bus 4, as shown in Table 3.
155
Table 3. SHRE distribution network model's parameters.
156
No. Current [A]
Voltage [V]
Load
[kW] Cos θ 1. I12 = 356.228 VB1 = 455 280.737 0.85
2. ILH = 186.092 VB2 = 438 120.000 0.85
3. I23 = 170.068 VB2 = 438 28.000 0.85
4. ISch = 125.00 VB3 = 422 75.000 0.85
5. IQtr = 125.00 VB4 = 407 75.000 0.85
From Table 3, simulation on fault current (FC) at any point of distribution network can be
157
carried out in order to provide the protection scheme for the distribution network. In this study,
158
simulation on 3 phase short circuit according to IEC 60909 have been carried out at bus 4, bus 3 and
159
bus 2. All simulated results are shown in Table 4.
160
Table 4. Different location of 3 phase short circuit.
161
Relay Number Bus Number Fault Current [A]
R34 Bus 4 3,322
R23 Bus 3 1,853
R12 Bus 2 1,093
3.2. Implementing GA technique and approach to the distribution model
162
In order to minimize the TDS value in GA, an OF and GA coding must be clearly defined by
163
using Matlab. After defining a proper OF and unique parameters, the number of variable must be
164
opted. In this project the variables are the TDSs of OCRs that must be optimized in order to improve
165
the relays operating function and work faster. GA toolbox is used to start simulation and perform
166
the optimization process.
167
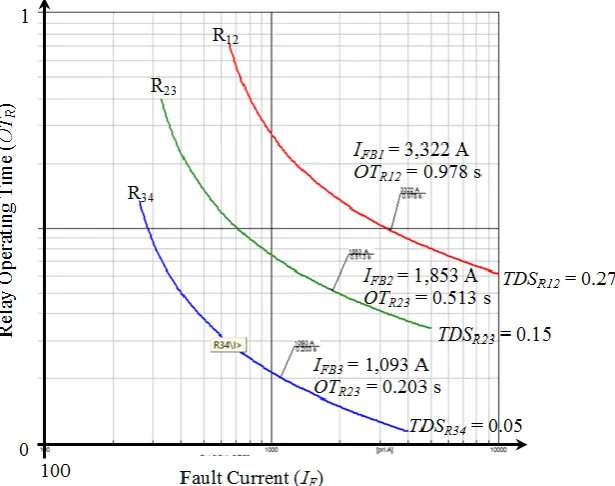
4. Results and discussion
168
Figure 7 show overcurrent relay characteristic based on IEC 60255 standards. It is also the
169
simulated result of conventional approach form the SHRE distribution network model as described
170
172
Figure 7. OCR coordination by conventional approach.
173
According to the Figure 7, all OCRs simulation results is now tabulated in Table 5 below. All
174
relay operating times can be verified by applying all data and parameters given in Table 3, 4 and 5
175
into Equation (1) and (2) and also the selection of IDMT curve type – standard inverse. According to
176
Equation (1), the relay operating time is dependent and on TDS value for this particular study. The
177
optimization of TDS values will definitely improve the relay operation time.
178
Table 5. Relay operating time of OCRs coordination by conventional approach.
179
Relay Number Fault Current
[A] TDS
Relay Operating Times [s]
R34 1,093 0.05 0.203
R23 1,853 0.15 0.513
R12 3,322 0.27 0.978
Figure 8 shows simulated result of OCR coordination by applying GA technique and approach
180
for optimization purpose. The simulation work is tested on the same SHRE distribution network
181
model with exactly the same data and parameters used before. All relays operating time for the same
182
184
Figure 8. OCR coordination by GA technique.
185
Table 6. Relay operating time of OCRs coordination by GA technique.
186
Relay Number Fault Current
[A] TDS
Relay Operating Times [s]
R34 1,093 0.05 0.203
R23 1,853 0.12 0.411
R12 3,322 0.13 0.471
The obtained results have clearly shown the improvement of each relay operating time where it
187
is 20% improvement for R23 and 51.85% for the R12 and overall improvement is 36.01% faster than
188
that of conventional numerical technique as shown in Table 7 and thus provided an effective and
189
proper protection scheme and also provide an optimal OCRs coordination setting for the SHRE
190
distribution network.
191
Table 7. Relay operation time result comparison.
192
Relay Number
Time Dial Setting [TDS] Relay Operating Time [s] Time Reduction & Improvement [%] Conventional GA Technique Conventional GA Technique
R34 0.05 0.05 0.2026 0.2026 0
R23 0.15 0.12 0.5138 0.4110 -20.00
R12 0.27 0.13 0.9793 0.4715 -51.85
Sum - - 1.6957 1.0851 -36.01
5. Conclusions
193
Implementing of GA optimization technique into SHRE distribution network is successfully
194
tested and executed through several sequence procedures. The extracted data from series of
195
simulations such as load flow analysis is successfully verified in order to ensure the unique
196
parameters are used into the distribution network is working properly. The goal of applying GA
197
technique and approach is to get an optimal setting for OCRs coordination for the distribution
198
network has been obtained. Thus, an efficient and reliable overcurrent protection scheme has been
199
Acknowledgement: This research work is a collaboration work between Public Work Department, Government
201
of Malaysia and Universiti Putra Malaysia – SHRE(UPM-JKR), 63000151. Special thanks to Ministry of Energy,
202
Green Technology and Water, Government of Malaysia who give support on financial to carry out this research
203
work.
204
Author Contributions: Mohammad Lutfi Othman and Hashim Hizam contributed to the literature review of
205
the optimal overcurrent coordination, then developed the discussion about the proposed methodology,
206
discussion about simulation result and analysis and also supervise the research work. Almalik Faisel and Azimi
207
contribute on site installation work, supervised and advised by Kamarul Bahrin Mohamad. All of the authors
208
read and approved the final manuscript.
209
Conflicts of Interest: The authors declare no conflict of interest during carry out this research work.
210
References
211
[1] J. John, F. Mwasilu, J. Lee, and J. Jung, “AC-microgrids versus DC-microgrids with distributed energy
212
resources : A review,” Renew. Sustain. Energy Rev., vol. 24, pp. 387–405, 2013.
213
[2] A. P. S. Meliopoulos, “Challenges in Simulation and Design of µ Grids,” pp. 309–314, 2002.
214
[3] M. D. Govardhan, “Grid Technologies –India A Review on Key Issues of Micr rogrid,” vol. 24, no. 3,
215
pp. 322–327, 2011.
216
[4] V. V. Vadlamudi, O. Gjerde, and G. Kjolle, “Dependability and security-based failure considerations in
217
protection system reliability studies,” 2013 4th IEEE/PES Innov. Smart Grid Technol. Eur. ISGT Eur. 2013,
218
pp. 9–13, 2013.
219
[5] C. W. So and K. K. Li, “Overcurrent relay coordination by evolutionary programming,” vol. 53, pp. 83–
220
90, 2000.
221
[6] S. Committee, “IEEE Standard Definitions for Power Switchaear,” vol. 1992, 1992.
222
[7] M. Singh, B. K. Panigrahi, S. Member, and A. R. Abhyankar, “Optimal Overcurrent Relay Coordination
223
in Distribution System,” no. 2, 2011.
224
[8] C. Chen, C. Lee, and C. Chang, “Electrical Power and Energy Systems Optimal overcurrent relay
225
coordination in power distribution system using a new approach,” Int. J. Electr. Power Energy Syst., vol.
226
45, no. 1, pp. 217–222, 2013.
227
[9] J. Sadeh, I. Member, M. Bashir, S. Member, and E. Kamyab, “Effect of Distributed Generation Capacity
228
on the Coordination of Protection System of Distribution Network,” no. 1, pp. 110–115, 2010.
229
[10] M. H. Hussain, S. R. A. Rahim, and I. Musirin, “Optimal Overcurrent Relay Coordination : A Review,”
230
Procedia Eng., vol. 53, pp. 332–336, 2013.
231
[11] T. Amraee, “Coordination of directional overcurrent relays using seeker algorithm,” IEEE Trans. Power
232
Deliv., vol. 27, no. 3, pp. 1415–1422, 2012.
233
[12] D. K. Jain, P. Gupta, and M. Singh, “Overcurrent Protection of Distribution Network with Distributed
234
Generation,” Smart Grid Technol. - Asia (ISGT ASIA), 2015 IEEE Innov., 2015.
235
[13] I. J. I. Systems, M. Zellagui, R. Benabid, M. Boudour, T. H. Boumediene, and A. Chaghi, “Optimal
236
Overcurrent Relays Coordination in the Presence Multi TCSC on Power Systems Using BBO
237
Algorithm,” no. January, pp. 13–20, 2015.
238
[14] M. Ezzeddine and R. Kaczmarek, “A novel method for optimal coordination of directional overcurrent
239
relays considering their available discrete settings and several operation characteristics,” Electr. Power
240
Syst. Res., vol. 81, no. 7, pp. 1475–1481, 2011.
241
[15] S. Hadi, M. Motlagh, and K. Mazlumi, “Optimal Overcurrent Relay Coordination Using Optimized
242
Objective Function,” vol. 2014, 2014.
243
[16] F. Razavi, H. A. Abyaneh, M. Al-Dabbagh, R. Mohammadi, H. Torkaman, and H. Askarian, “A new
244
comprehensive genetic algorithm method for optimal overcurrent relays coordination,” Electr. Power
245
Syst. Res., vol. 78, no. 4, pp. 713–720, Apr. 2008.