Genome Databases
The CATH database
Michael Knudsen1and Carsten Wiuf1,2*
1Bioinformatics Research Centre, Aarhus University, DK-8000 Aarhus C, Denmark
2Centre for Membrane Pumps in Cells and Disease – PUMPKIN, Aarhus University, DK-8000 Aarhus C, Denmark
*Correspondence to:E-mail: [email protected]
Date received (in revised form): 24th November, 2009
Abstract
The CATH database provides hierarchical classification of protein domains based on their folding patterns. Domains are obtained from protein structures deposited in the Protein Data Bank and both domain identification and subsequent classification use manual as well as automated procedures. The accompanying website
(www.cathdb.info) provides an easy-to-use entry to the classification, allowing for both browsing and downloading of data. Here, we give a brief review of the database, its corresponding website and some related tools.
Keywords:CATH, protein domains, classification, protein structure, database
Introduction
The number of solved protein structures is increas-ing at an exceptional rate. At the time of writincreas-ing, the Protein Data Bank1,2 (PDB) contains more than 61,000 structures. The CATH database3,4 is a classification of protein domains (sub-sequences of proteins that may fold, evolve and function inde-pendently of the rest of the protein), based not only on sequence information, but also on structural and functional properties. CATH offers an important tool to researchers, as proteins with even very little sequence similarity often are both structurally and functionally related.5
The most recent version of CATH (version 3.2.0, released July 20086) contains 114,215 domains, classified in a hierarchical scheme with four main levels (listed from the top and down) called class (C), architecture (A), topology (T) and homologous superfamily (H) — hence the name CATH. More than 20,000 domains have been added since the previous release (version 3.1.0, January 2007), and the rate of new additions is
expected to increase. (The first CATH release3 from 1997 contained only 8,078 domains.)
At the C-level, domains are grouped according to their secondary structure content into four cat-egories: mainly alpha, mainly beta, mixed alpha-beta; and a fourth category which contains domains with only few secondary structures. The A-level groups domains according to the general orien-tations of their secondary structures. At the T-level, the connectivity (ie the order) of the secondary structures is taken into account. The grouping of domains at the H-level is based on a combination of both sequence similarity and a measure of structural similarity obtained from the dynamic programming algorithm SSAP.7 To supplement the traditional alignment of the a-carbon atoms of the protein backbone, SSAP gains additional strength by also aligning b-carbon atoms of the amino acid side chains and thus also takes into account the rotational conformation of the protein chains.
increasing sequence overlap and similarity (eg two domains with the same CATHSOLI classification must have 80 per cent overlap, with 100 per cent sequence identity), whereas the D-level assigns a unique identifier to every domain, thus ensuring that no two domains have exactly the same CATHSOLID classification.
A combination of automated procedures and manual inspections are used in the CATH classifi-cation. In particular, at the A-level, similarity is dif-ficult to detect using automated methods only.
Other similar databases are available online.8 Among these, SCOP9 is the most widely used, and by being a hierarchical classification too, it provides a supplement to CATH. Despite their hierarchical architectures, the two databases are not entirely comparable. For example, at the class level, SCOP contains two mixed alpha-beta classes; the aþb
class comprises domains with mostly antiparallel
b-sheets and segregated a- and b-regions, while the a/b class comprises domains with many paral-lel b-sheets and b-a-b units. It is still possible to compare CATH and SCOP, however — for example, in a recent study,10 where a consensus set on which the hierarchical structures of both databases agree was extracted. The consensus set contained 64,016 domains, which amounts to 56 per cent of the domains in CATH.
Various other databases exist that are non-hierarchical and use more standard clustering methods. Among these, the most widely cited are DALI,11 HOMSTRAD12 and COMPASS.13,14
Organisation of the CATH homepage
The CATH homepage (http://www.cathdb.info/) provides easy access to the CATH classification. The first site element contains a quick description of CATH, with a link to a more thorough intro-duction. The language is very non-technical and the reader can quickly grasp the overall structure of CATH; more details are provided by Greene
et al.,15 for example. Links to more details are pro-vided in the Documentation section in the main menu. A useful glossary of terms and definitions used in CATH is available, alongside a thorough
tutorial on how to use CATH and the related Gene3D server,16 – 19 which, by scanning sequences in CATH predicts the domain compositions of pro-teins from sequences alone. At the time of writing, the Gene3D database comprises more than 10 million protein sequences, from over 1,100 fully sequenced species genomes, from all three king-doms of life.19
Data accessibility
Besides a Quick Search box, which facilitates easy searching, links are provided to various other ways of accessing the data: (1) search by keyword or domain ID; (2) search using a sequence in FASTA format; (3) browse the database from the top of the hierar-chy; and (4) download datasets. The ability to browse the database provides a way to get acquainted with the structure of CATH and is also a convenient way to locate and compare similar structures.
Figure 1 shows an example of what a domain looks like in the CATH browser. The domain 3cx5B01 (chain B, domain 1 of the PDB entry 3cx5) is classified as 3.30.830.10, making it a Mixed Alpha-Beta domain (C¼3) in the 2-Layer Sandwich archi-tecture (A¼30). Besides a picture of the domain’s three-dimensional structure, a schematic depiction of the arrangement of secondary structures is shown in the Structure pane, also present in Figure 1. The Sequence pane contains the amino acid sequence of the domain, and the History pane describes the history of the domain in the CATH database, with information about when the domain was added and if the classification has changed over time.
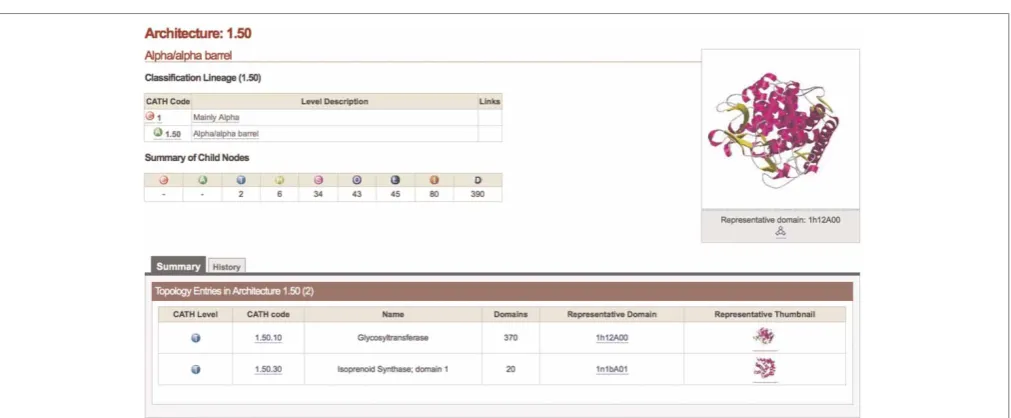
Browsing is not only possible at the domain level. Figure 2 shows the entry corresponding to the
Alpha/alpha barrel architecture (with CATH classifi-cation 1.50). A summary of the lower levels is pro-vided, alongside links to the adjacent sub-levels in the hierarchy — in this case, the two topologies 1.50.10 and 1.50.30. By clicking on a link to a representative domain, an output as in Figure 1 is obtained.
Figure 1. Screenshot of the domain 3cx5B01 in the CATH browser. The domain is classified as 3.30.830.10, which means that it belongs to theMixed Alpha-Betaclass (C¼3), the2-Layer Sandwicharchitecture (A¼30) and so forth. The CATH Code column allows for easy browsing both up and down levels in the hierarchy, and the Links column provides links to relevant entries in the Gene3D database. An XML file containing all information on the page can be downloaded by clicking on the XML link next to the domain name. The icon below the image links to a structure file in the Rasmol format. The panes in the bottom of the screen provide additional information about the domain. The content of the Structure pane, which contains secondary structure information, is shown in the figure. The Sequence pane contains the amino acid sequence of the domain and the History pane contains the history of the domain in CATH, with information about when the domain was added to the database and whether its classification has changed over time.
so-called S100, S95, S60 and S35 sets containing representatives from domain clusters obtained from clusterings based on sequence overlaps and simi-larities. For example, in the S95 set, two domains must have at least 80 per cent sequence overlap, with 95 per cent sequence identity. Furthermore, files describing how to chop the PDB files of com-plete proteins, to obtain the domains, can be downloaded; since all PDB files are available at the PDB homepage (http://www.pdb.org/), it is poss-ible to construct PDB files of all 114,215 CATH domains by applying the chopping instructions pro-vided in the files. The ability to download com-plete datasets is of paramount importance for establishing tools like the Gene3D server, discussed above, and, hence, CATH may be seen as more than a resource for acquiring information about single domains only. Furthermore, as CATH is often viewed as a gold standard for automated classification procedures,20 – 22 the availability of complete datasets is crucial.
A list containing the names of all domains in CATH — together with their respective classifications — is also available, and the amino acid sequences of all domains classified in CATH are accessible for download in the FASTA format. Finally, the Download section provides a list of 14,652 putative domains that have not yet been assigned a classifi-cation, let alone been verified as genuine domains. This dataset may be a valuable ingredient in any devel-opment of new, automated classification methods.
Tools
The main menu located in the upper right corner of the homepage links to various tools for use in combination with the CATH database.
1) The sequential structure alignment program (SSAP) server7 takes as input two domains, either provided as PDB/CATH identifiers or as uploaded files, and performs a structural alignment. This allows the user also to compare domains by struc-tural similarity, rather than sequence homology only. The SSAP algorithm is computationally feas-ible; it is a dynamic programming algorithm, like the familiar algorithms for sequence alignment. In
this way, SSAP is able to align not only the
a-carbon atoms of the protein backbones, but also the b-carbon atoms of the amino acid side chains. The output shows the alignment, together with SSAP score, root mean square deviation (RMSD), overlap and sequence identity. It is also possible to download a PDB file with the two structures super-posed to facilitate additional visual inspection.
2) The CATHEDRAL server23is used for disco-vering known domains in new multi-domain struc-tures. By either entering a CATH/PDB identifier or by uploading a PDB file, an automated assign-ment of domain boundaries is performed by query-ing the structure against a set of representative domains from CATH. This task is accomplished using a modified version of the SSAP algorithm, and the output is a list of candidate domains ordered according to increasing E-value. Furthermore, CATHEDRAL score, SSAP score and RMSD are reported for each candidate.
3) When a structure has been selected in the CATH browser (see Figure 1), links to the Gene3D server16 – 19 are also available. For example, clicking
the Gene3D link next to the D-level
3.30.830.10.1.1.1.1.1 presents the Gene3D entry corresponding to the domain 3cx5B01 (recall that any full CATHSOLID classification uniquely defines a domain). From there, several links are available to lists of, for example, complexes, path-ways and functional categories (GO) in which the domain is involved.
Both CATHEDRAL and SSAP allow the user to sign up for optional e-mail notifications regarding the progress of queries.
Database construction
The data in CATH are obtained from PDB files deposited in the Protein Data Bank.1 – 2Only struc-tures determined with a resolution of 4A˚ or better are included. Furthermore, CATH requires the domains to be of minimum 40 residues in length, with 70 per cent or more of the side chains resolved.15 As mentioned in the introduction, the most recent version of CATH contains 114,215 domains, processed from the proteins in PDB.
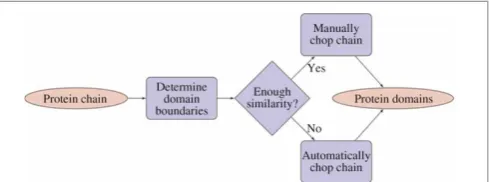
Two main steps are involved in adding new structures to CATH: 1) submitted protein chains are chopped to obtain the domains; and 2) classifi-cations are assigned to the resulting domains.
The chopping of protein chains is far from an easy task, and several different measures obtained
from, for example, CATHEDRAL23 and
ProteinDBS24 are taken into account to reduce the need for human intervention. The procedure is illustrated in Figure 3 in a simplified version of the complete flow chart in Greene et al.15 A very
similar flow chart applies to the classification assign-ment; the domains obtained in the previous step are compared with already known domains using CATHEDRAL and hidden Markov models, and, based on the output, it is decided whether to do an auxiliary manual inspection.
Future directions
It has long been a matter of debate whether the hierarchical organisation of CATH (and of other domain databases like SCOP) is appropriate,25 and whether the space of protein structures is better viewed as a continuum. The evolutionary relation-ships between sequences, however, should allow for discretising the structure space to some extent.
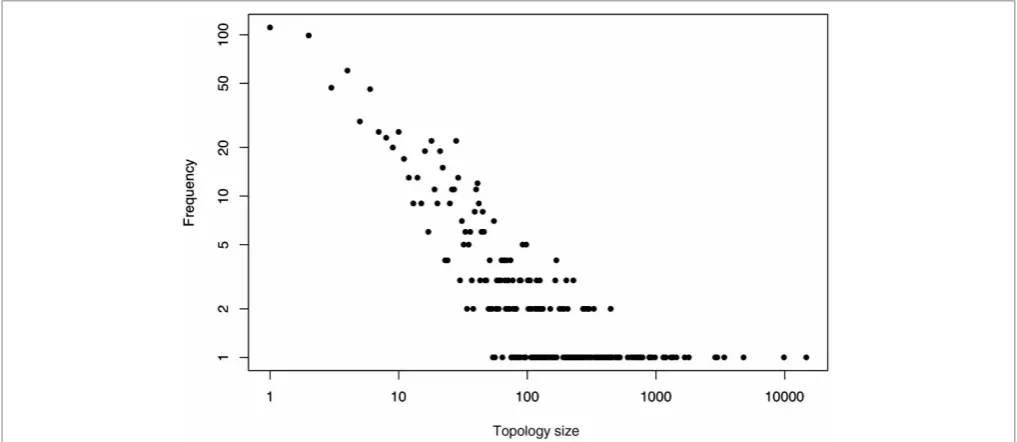
As noted already by the CATH group,5 a few topologies — often referred to as superfolds — contain a disproportionate number of structures (see Figure 4). This was further discussed in the first description of CATH,3 where the Russian doll effect was also considered: a series of small struc-tural changes in a domain’s embellishments (ie parts of the structure not belonging to the highly con-served core) could mediate a walk from one top-ology to another. Furthermore, large structural
divergences are observed within several topologies. In Cuff et al.,26 structurally similar groups (SSGs) are defined as clusters originating from a clustering procedure where two domains are regarded as similar if their normalised RMSD is less than 5A˚ . The study revealed that while the majority of topologies comprise only one or two SSGs, a few contain more than ten (see also Reeves et al.27). Moreover, these topologies represent a large pro-portion of the domains in CATH.
Despite the complications caused by the struc-tural overlaps between topologies and the vast structural divergence within some topologies, the CATH database is still a valuable tool if one focuses on domains that share a common structure in their topological cores and neglects features of the less constrained outer layers of the domains.
A planned update of CATH (version 3.3.0) will, besides the current hierarchical structure, also contain horizontal links between related topologies.26
Conclusion
The CATH database is valuable for biologists and bioinformaticians alike. For biologists with very specific tasks, browsing for individual domains is made easy by the user-friendly web interface, while bioinformaticians with a focus on large-scale ana-lyses can find complete datasets available for down-loading. Thus, working with CATH is remarkably uncomplicated. Updates are frequent, and, given the significant upcoming extension26 with horizon-tal layers complementary to the hierarchical struc-ture, CATH is likely to become an even more valuable resource in the future.
References
1. Berman, H.M., Westbrook, J., Feng, Z., Gilliland, G.et al. (2000), ‘The Protein Data Bank’,Nucl. Acids Res.Vol. 28, pp. 235 – 242.
2. Berman, H.M., Battistuz, T., Bhat, T.N., Bluhm, W.F.et al. (2002), ‘The Protein Data Bank’,Acta Cryst.Vol. D58, pp. 899 – 907.
3. Orengo, C.A., Michie, A.D., Jones, D.T., Swindells, M.B.et al. (1997), ‘CATH: A hierarchic classification of protein domain structures’,Structure
Vol. 5, pp. 1093 – 1108.
4. Orengo, C.A., Martin, A.M., Hutchinson, G., Jones, S. et al. (1998), ‘Classifying a protein in the CATH database of domain structures’,Acta Cryst. Vol. D54, pp. 1155 – 1167.
5. Orengo, C.A., Jones, D.T., Taylor, W. and Thornton, J.M. (1994), ‘Protein superfamilies and domain superfolds’,NatureVol. 372, pp. 631–634.
6. Cuff, A.L., Sillitoe, I., Lewis, T., Redfern, O.C. et al. (2009), ‘The CATH classification revisited — Architectures reviewed and new ways to characterize structural divergence in superfamilies’,Nucl. Acids Res.Vol. 37, pp. D310 – D314.
7. Taylor, W.R. and Orengo, C.A. (1989), ‘Protein structure alignment’,
J. Mol. Biol.Vol. 208, pp. 1 – 22.
8. Redfern, O., Grant, A., Maibaum, M. and Orengo, C. (2005), ‘Survey of current protein family databases and their applications in comparative, structural and functional genomics’,J. Chromatogr. BVol. 815, pp. 97– 107. 9. Murzin, A.G., Brenner, S.E., Hubbard, T. and Chothia, C. (1995), ‘SCOP: A structural classification of proteins database for the investi-gation of sequences and structures’,J. Mol. Biol.Vol. 247, pp. 536 – 540. 10. Csaba, G., Birzele, F. and Zimmer, R. (2009), ‘Systematic comparison of
SCOP and CATH: A new gold standard for protein structure analysis’,
BMC Struct. Biol.Vol. 9, p. 23.
11. Dietmann, S., Park, J., Notredame, C., Heger, A.et al. (2001), ‘A fully automatic evolutionary classification of protein folds: Dali Domain Directory version 3’,Nucl. Acids Res.Vol. 29, pp. 55 – 57.
12. Mizuguchi, K., Deane, C.M., Blundell, T.L. and Overington, J.P. (1997), ‘HOMSTRAD: A database of protein structure alignments for homolo-gous families’,Protein ScienceVol. 7, pp. 2469 – 2471.
13. Sadreyev, R. and Grishin, N. (2003), ‘COMPASS: A tool for comparison of multiple protein alignments with assessment of statistical significance’,
J. Mol. Biol.Vol. 326, pp. 317 – 336.
14. Sadreyev, R., Tang, M., Kim, B.-H. and Grishin, N.V. (2007), ‘COMPASS server for remote homology inference’,Nucl. Acids Res.Vol. 35, pp. W653 – W658.
15. Greene, L.H., Lewis, T.E., Addou, S., Cuff, A.et al. (2007), ‘The CATH domain structure database: New protocols and classification levels give a more comprehensive resource for exploring evolution’,Nucl. Acids Res.
Vol. 35, pp. D291 – D297.
16. Buchan, D.W., Shepard, A.J., Lee, D., Pearl, F.M.et al. (2002), ‘Gene3D: Structural assignment for whole genes and genomes using the CATH domain structure database’,Genome Res.Vol. 12, pp. 503 – 514. 17. Buchan, D.W., Rison, S.C., Bray, J.E., Lee, D.et al. (2003), ‘Structural
assignments for the biologist and bioinformaticist alike’,Nucl. Acids Res.
Vol. 31, pp. 469 – 473.
18. Yeats, C., Maibaum, M., Marsden, R., Dibley, M. et al. (2006), ‘Gene3D: Modelling protein structure, function and evolution’, Nucl. Acids Res.Vol. 34, D281 – D284.
19. Lees, J., Yeats, C., Redfern, O., Clegg, A. et al. (2010), ‘Gene3D: merging structure and function for a thousand genomes’,Nucl. Acids Res.
Vol. 38, pp. D296 – D300.
20. Røgen, P. and Fain, B. (2003), ‘Automatic classification of protein struc-ture by using Gauss integrals’,Proc. Natl. Acad. Sci. USAVol. 100, pp. 119 – 124.
21. Choi, I.-G., Kwon, J. and Kim, S.-H. (2004), ‘Local feature frequency profile: A method to measure structural similarity in proteins’,Proc. Natl. Acad. Sci. USAVol. 101, pp. 3797 – 3802.
22. Getz, G., Vendruscolo, M., Sachs, D. and Domany, E. (2002), ‘Automated assignment of SCOP and CATH protein structure classifi-cation from FSSP scores’,ProteinsVol. 46, pp. 405 – 411.
23. Redfern, O.C., Harrison, A., Dallman, T., Pearl, F.M. et al. (2007), ‘CATHEDRAL: A fast and effective algorithm to predict folds and domain boundaries from multidomain protein structures’, PLoS Comp. Biol.Vol. 3, p. e232.
24. Shyu, C.-R., Chi, P.-H., Scott, G. and Xu, D. (2004), ‘ProteinDBS: A real-time retrieval system for protein structure comparison’,Nucl. Acids Res.Vol. 32, pp. W572 – W575.
25. Dietmann, S. and Holm, L. (2001), ‘Identification of homology in protein structure classification’,Nature Struct. Biol. Vol. 8, pp. 953 – 957. 26. Cuff, A., Redfern, O.C., Greene, L., Sillitoe, I. et al. (2009), ‘The
CATH hierarchy revisited – Structural divergence in domain superfami-lies and the continuity of fold space’,StructureVol. 17, pp. 1051 – 1062. 27. Reeves, G.A., Dallmann, T.J., Redfern, O.C., Akpor, A. et al. (2006),
‘Structural diversity of domain superfamilies in the CATH database’,