Finding Multiple Internal Rates Of Return
For A Project With Non-Conventional Cash
Flows: Utilizing Popular Financial/Graphing
Calculators And Spreadsheet Software
Jeng-Hong Chen, Albany State University, USAABSTRACT
This study demonstrates that a popular graphing calculator among students, TI-83 Plus, has a powerful function to draw the NPV profile and find the accurate multiple IRRs for a project with non-conventional cash flows. However, finance textbooks or related supplementary materials do not provide students instructions for this part. The detailed steps to find multiple IRRs utilizing TI-83 Plus are displayed in this paper. In addition, the complete and detailed procedures to find multiple IRRs utilizing different financial calculators and Excel spreadsheet are discussed.
Keywords: Internal Rate of Return, Non-Conventional Cash Flows, Financial/Graphing Calculators
1. INTRODUCTION
hen instructors teach students the internal rate of return (IRR) method in capital budgeting, they generally use examples of conventional cash flows to find a single IRR. Conventional cash flows mean the negative cash flow (initial cost) occurs at time period 0 and the cash flows become positive for the time period 1 until the end period of the project. The decision rule of IRR method for a project with conventional cash flows is quite simple – accept (reject) the project if the IRR is greater (less) than the project’s cost of capital. However, in practice, a firm’s project does not always have conventional cash flow streams. Non-conventional cash flows are possible and the decision rule is different from that of Non-conventional cash flows. Many projects require a large amount of expenditures to end the project. The decommissioning costs will bring the negative cash flow to a firm at the end of a project’s life. For instance, an electricity firm finally needs to shut down its nuclear power plants forever (Ross et al., 2008). An iron company plans to develop a strip mine and it requires a large amount of cleanup costs at the end (Brigham and Houston, 2006; Brealey et al., 2006). A waste management corporation operates a sanitary landfill and has to close the landfill eventually to obey various ecological regulations (Simon, 2006). In addition, a project of equipments replacement to improve the firm’s current production may cause the negative incremental cash flow at the end. An oil company may decide to invest in the advanced oil pump equipments so that large quantity of oil can be extracted faster (Lorie and Savage, 1955; Solomon, 1956).
Non-conventional cash flows mean that the signs of cash flows change more than once. If the signs of cash flows for a 5-year project from year 0 to year 5 are –, +, +, +, +, –, the signs change two times. Based on Descartes’ Rule of Signs, the maximum possible numbers of IRRs will equal the number of sign changes of cash flows. It is possible that certain pairs of answers are not real numbers. Therefore, the actual number of IRRs can be less than the number of sign changes of cash flows by an even number; two, four, or six, and so on. In this case, there are two sign changes of the cash flow stream so there can be two IRRs, or counting down in pairs, zero IRRs.
In practice, net present value (NPV) and IRR methods are widely used and are more popular than other capital budgeting methods (Graham and Harvey, 2001). The NPV method is considered better than IRR method in academia. For instance, the NPV method assumes cash flows are reinvested at the cost of capital, which is more
realistic. NPV method can rank mutually exclusive projects. The project with higher NPV adds more value to the firm and will increase more wealth for the shareholders. In spite of the NPV method’s advantages, the IRR method sometimes is preferred in industry since (1) it is easier to communicate with others without finance background in different departments of a firm by using the rate of return and (2) deciding the appropriate cost of capital for the project, which is required for the NPV method, may be costly and not easy. Thus, learning and understanding the IRR method is important to students as well. Knowing how to identify a project with non-conventional cash flows and find multiple IRRs will be helpful to students and practitioners to better realize capital budgeting.
To compute the IRR, the discount rate which makes NPV equal to zero, students have to use the trial-and-error method, which will be very time-consuming and tedious if they compute it manually. Basically, instructors can teach students to use financial calculators or computer software to find it. Since there is only one IRR1 for the project with conventional cash flows, it can be calculated by the financial calculator and the decision can be made without problem. But for the project with non-conventional cash flows, there can be more than a single IRR. Students or practitioners may not be aware of this situation and may make the incorrect decision because some financial calculators/computer packages are only able to calculate a single IRR or the financial calculators/software packages are not properly used. The textbook of Ross et al. (2008, pp. 281) specifically states:
Many financial computer packages (including a best-seller for personal computers) aren’t aware of this problem and just report the first IRR that is found. Others report only the smallest positive IRR, even though the answer is no better than any other.
Although a few finance textbooks or supplementary materials provide students with instructions to find the multiple IRRs, they are not thorough. Some may just show students how to use financial calculators, while the others may just show students how to use the computer spreadsheet software. This research reviews different kinds of calculators and the Excel spreadsheet and provides the complete and detailed procedures of finding the multiple IRRs for these instruments. More importantly, it points out that a popular graphing calculator (TI-83 Plus) can be a powerful tool to help students better understand the IRR method and find the multiple IRRs.
TI-83 Plus graphing calculator is very popular among undergraduate students because many of them had purchased it in their high school stage to deal with mathematical courses and prepare for ACT/SAT tests. Since TI-83 Plus had cost students around $100 and it also includes “Finance” function, many of them just want to use TI-TI-83 Plus for their finance courses rather than spend additional money purchasing financial calculators. In fact, due to its powerful function of graphing, TI-83 Plus is able to draw the NPV profile under different discount rates and calculate the multiple IRRs. Students can better understand and compute the multiple IRRs of a project with non-conventional cash flows by examining the graph of NPV profile. However, finance textbooks or other supplementary materials do not provide instructions for students regarding how to utilize this popular graphing calculator to find multiple IRRs. To make up for this drawback, this study shows the detailed steps to draw the NPV profile and calculate multiple IRRs using TI-83 Plus2.
Technological advances have changed the way of learning. The financial/graphing calculator and spreadsheet software are important determinants of efficient and effective learning in finance courses. The contributions of this research are twofold. First, this paper demonstrates that a popular graphing calculator among students can be a very powerful tool to draw the NPV profile and find multiple IRRs. Second, complete and detailed procedures to find the multiple IRRs using different financial calculators and spreadsheet software are displayed. Hopefully this paper will assist finance instructors to teach students to better understand and deal with the issue of multiple IRRs.
2. UTILIZING TI-83 PLUS GRAPHING CALCULATOR TO DRAW THE NPV PROFILE AND FIND MULTIPLE IRRS
First, consider a numerical example of non-conventional cash flows for a project.
Year 0 1 2 3 4
Cash Flows −$580 $530 $530 $530 −$1,080
In this example, the signs of cash flows from Year 0 to Year 4 (–, +, +, +, –) change two times, which indicates non-conventional cash flows. According to the Descartes’ Rule of Signs, there can be two IRRs or no IRR.
The equation to compute the NPV is expressed as follows:
4 3 2 4 3 2
)
1
(
080
,
1
)
1
(
1
)
1
(
1
1
1
530
580
)
1
(
080
,
1
)
1
(
530
)
1
(
530
1
530
580
k
k
k
k
k
k
k
k
NPV
(1)where k is the project’s cost of capital (discount rate).
Turn on TI-83 Plus and press Y= , located on the left top corner of keyboard. The screen will look like the following display (Fig. 1). In TI-83 Plus, for simplicity we key in X to represent k and Y to represent NPV in our equation. The equation looks like
\Y1=-580+530(1/(1+X)+1/(1+X)^2+1/(1+X)^3)-1080/(1+X)^4 (2)
The procedures of using TI-83 Plus to key in the above equation are as follows3.
(–)580+530(1÷(1+ X,T,θ,n )+1÷(1+ X,T,θ,n )^2+1÷(1+ X,T,θ,n )^3)–1080÷(1+ X,T,θ,n )^4
The input results on the screen will look like the following display (Fig. 2).
(Fig. 1) (Fig. 2)
After setting the scales, press GRAPH to draw the graph of equation, NPV profile. The NPV profile will look like the following display (Fig. 4).
(Fig. 3) (Fig. 4)
The graph shows that the NPV curve crosses the X-axis twice. So, we can know that there are two points on X-axis making Y(NPV) = 0, which means two IRRs exist. To compute two IRRs, press 2nd CALC and we can see the following choices in the following display (Fig. 5). Because two IRRs are two points crossing the X-axis (Xs that make Y equal to zero), select “2:zero” by pressing 2 or arrow down to “2:zero” and press ENTER . The following result will appear (Fig. 6).
(Fig. 5) (Fig. 6)
To find the accurate number of the second IRR, the calculator tries to locate the left boundary (X=.3). Since .3 is on the left of the second IRR, just press ENTER and the following outcome will display (Fig. 7). Then, locate the right boundary. Because the right boundary should be on the right of the second IRR, use ► to move the cursor to the right of IRR as shown below (Fig. 8).
(Fig. 7) (Fig. 8)
(Fig. 9) (Fig. 10)
To find the first IRR, just follow the same procedures as we compute for the second IRR. Press 2nd CALC and select “2:zero”. Then, Use ◄ to move the cursor to the left of the first IRR to set up the left boundary (see Fig. 11). Press ENTER and then use ► to move the cursor to the right of the first IRR to set up the right boundary (see Fig. 12).
(Fig. 11) (Fig. 12)
Press ENTER so both left and right boundaries are set up (see Fig. 13). Finally, press ENTER and the first IRR of .098966 (9.8966%) is displayed as follow (Fig. 14).
(Fig. 13) (Fig. 14)
In this example, if the cost of capital is between (outside) these two IRRs, the project’s NPV will be positive (negative). Without determining the cost of capital precisely, as long as the project manager is sure that the cost of capital is within these two IRRs, NPV will be positive. Based on the steps discussed above, similar procedures can be applied to find the multiple IRRs for a project with more than two IRRs.
Although TI-83 Plus has the IRR function in its “Finance Application”, it cannot handle the multiple IRRs problem. If there is more than one IRR, IRR function can only find one IRR. See “Appendix” for detailed discussions about its limitation.
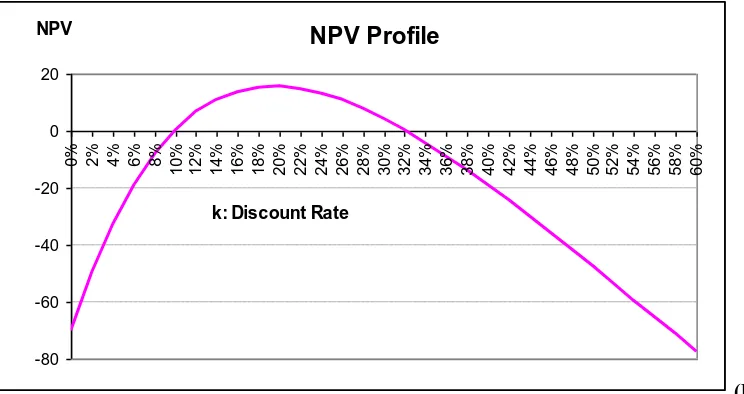
Cash Flow”) should be set up for the NPV column. Therefore, NPVs are computed by their associated discount rates. Based on these two columns, we can utilize “chart wizard” function to draw the NPV profile as follow (Fig. 15).
NPV Profile
-80 -60 -40 -20 0 20
0% 2% 4% 6% 8%
10% 12% 14% 16% 18% 20% 22% 24% 26% 28% 30% 32% 34% 36% 38% 40% 42% 44% 46% 48% 50% 52% 54% 56% 58% 60%
k: Discount Rate NPV
(Fig. 15)
The NPV profile shows that the curve crosses the X-axis twice, which means two IRRs exist. Based on Fig. 15, we only know that these two IRRs are roughly close to 10% and 32%. The next step is to calculate the accurate values of these two IRRs. Sections 3 and 4 demonstrate that there are several ways to calculate these two IRRs.
3. UTILIZING FINANCIAL CALCULATORS TO FIND MULTIPLE IRRS
3.1. HP 17bII+ Financial Calculator
There are two ways to find the multiple IRRs.
Method I: Using the function keys
First, input the cash flows stream. Turn on HP 17bII+ and choose FIN and then choose CFLO.
FLOW(0)=? Input 580 (the initial cost) and press +/- to be -580. Press INPUT. FLOW(1)=? Input 530 (the first stage cash flows) and press INPUT.
#TIMES(1)=1 Input 3 (there are three years for the first stage) and press INPUT.
FLOW(2)=? Input 1080 (the second stage cash flow) and press +/- to be -1,080. Press INPUT. #TIMES(2)=1 Just leave it there (there is only one year for the second stage).
Choose EXIT and CALC and IRR% and then the following result appears.
MANY/NO SOLUTIONS; KEY IN GUESS; [STO] {IRR%}
Input 10 (or input a number that is closer to the first IRR compared to the second IRR5) and press STO and choose IRR%. Then after a few seconds of trial-and-error process, IRR%=9.8966 shows up if four decimal places are set. So, the first IRR = 9.8966%. To find the second IRR, repeat the same procedure again. Choose IRR% and the following result appears on the screen again:
MANY/NO SOLUTIONS; KEY IN GUESS; [STO] {IRR%}
Input 32 (or input a number that is closer to the second IRR compared to the first IRR6) and press STO and choose IRR%. Then after a few seconds of trial-and-error process, IRR%=32.1866 is displayed. So, the second IRR = 32.1866%.
Method II: Using equation solver
HP 17bII+ has the equation solver function. Input the whole equation first and use the solver function to solve for the equation. Select SOLVE and then select NEW. After that, TYPE EQUATION; [INPUT] is displayed. Type the following equation.
NPV=-580+530÷(1+K)+530÷((1+K)^2)+530÷((1+K)^3)-1080÷((1+K)^4) (3)
Press EXIT twice, then “SAVE THIS EQUATION” is shown. Select YES and select CALC. Based on the graph, two IRRs are around 10% (0.1) and 32% (0.32). To solve for K that makes NPV = 0, input a number for K to compute NPV first. Then, change NPV to 0 and compute K again. The calculator will base on the previously inputted number for K and use trial-and-error process to get the accurate value of K, which makes NPV = 0.
To find the first IRR, input 0.1 and select K (K=0.1). Then select NPV and “NPV=0.377023” is displayed (Assume 6 decimal places are used). Input 0 and select NPV(to make NPV=0) and then select K. After a few seconds, K=0.098966 is displayed. The first IRR is 9.8966%.
To find the second IRR, input 0.32 and select K (K=0.32). Then select NPV and “NPV=0.395111” is displayed. Input 0 and select NPV(to make NPV=0) and then select K. After a few seconds, K=0.321866 is displayed. The second IRR is 32.1866%.
3.2. HP 10bII Financial Calculator
There is a way to find the multiple IRRs. First, input the cash flows stream. Press ▄▄ (dark orange key) and C All (Clear the previous all memory; ▄▄ represents SHIFT, the second function).
Input 1 and press ▄▄ P/YR (set 1 payment per year).
Input 580 and press +/- CFj (the initial cash flow -$580 at Year 0).
Input 530 and press CFj . Input 3 and press ▄▄ Nj (the same cash flow $530 from Year 1 to Year 3). Input 1080 and press +/- CFj (the cash flow $1,080 at Year 4).
Press ▄▄ IRR/YR and “not Found” is displayed.
Input 10 and press ▄▄ STO ▄▄ IRR/YR . After a few seconds, 9.8966 (if 4 decimal places are set), the first IRR, is shown.
Input 32 and press ▄▄ STO ▄▄ IRR/YR . After a few seconds, 32.1866, the second IRR, is shown.
9.8966%7. If students or practitioners are not aware of non-conventional cash flows and mistakenly believe that there is only one IRR (=9.8966%), they may make an incorrect decision – reject this project since IRR is less than the cost of capital.
4. UTILIZING EXCEL SPREADSHEET TO FIND MULTIPLE IRRS
First, label Year 0 to Year 4 in cell A2 to A6 and input cash flows from Year 0 to Year 4 in cell B2 to B6.
A B
1 Year CF
2 0 -580
3 1 530
4 2 530
5 3 530
6 4 -1080
7
8 IRR1 9.8966%
9 IRR2 32.1866%
10
11 IRR1 9.8966%
12 NPV1 0
13
14 IRR2 32.1866%
15 NPV2 0
There are two methods to calculate multiple IRRs. One way is to use IRR syntax and the other way is to use the add-ins function – Solver.
Method I: Using IRR syntax “IRR(values,guess)”
Year 0 to Year 4 cash flows are stored in cell B2 to B6. To compute the first IRR (IRR1), type “=IRR(B2:B6,10%)” on cell B8 and press “Enter”. The first IRR of 9.8966% is displayed. To compute the second IRR (IRR2) on cell B9, we type “=IRR(B2:B6,32%)” and press “Enter”. The second IRR of 32.1866% is displayed.
Method II: Using Add-Ins Function – Solver
On cell B11, input 10% as the discount rate. On cell B12, compute NPV for the discount rate = 10%. The syntax for cell B12 is “=NPV(rate,value1,value2,…)+Year 0 Cash Flow”, so input the syntax as “=NPV(B11,B3:B6)+B2“ and press “Enter”. Cell B12 will show 0.377 for NPV1. Use “Solver” to find the accurate discount rate making NPV = 0. Select “Tools” on the menu bar and select “Solver”8.
In “Solver Parameters” panel, set $B$12 (NPV1) as the target cell and choose its value equal to 0 (make NPV1 = 0). Then, $B$11 (IRR1) is recalculated.
Set Target Cell: $B$12
Equal To: ○ Max ○ Min ● Value of: 0 By Changing Cells: $B$11
Click “Solve” button then cell B12 will become 0 and cell B11 will change to 9.8966%, which is the first IRR.
Cash Flow” so input the syntax as “=NPV(B14,B3:B6)+B2“ and press “Enter”. Cell B15 will show 0.3951 for NPV2. Use “Solver” to find the accurate discount rate making NPV = 0. Select “Tools” on the menu bar and select “Solver”.
In “Solver Parameters” panel, set $B$15 (NPV2) as the target cell and choose its value equal to 0 (make NPV2 = 0). Then, $B$14 (IRR2) is recalculated.
Set Target Cell: $B$15
Equal To: ○ Max ○ Min ● Value of: 0 By Changing Cells: $B$14
Click “Solve” button then cell B15 will become 0 and cell B14 will change to 32.1866%, which is the second IRR.
5. CONCLUSION
Without proper identification of multiple IRRs for a project with non-conventional cash flows, one may make the incorrect decision based on the misleading result of a single IRR. Drawing the NPV profile under different discount rates is a better way to identify number of IRRs for a project and understand the IRR rule. The NPV profile can be drawn by utilizing the graphing calculator or spreadsheet software. With its powerful functions to draw the NPV profile and calculate multiple IRRs, a popular graphing calculator, TI-83 Plus is able to help students and practitioners make the right capital budgeting decision. In addition, multiple IRRs can also be computed by utilizing the financial calculators’ function keys and the spreadsheet’s IRR syntax and solver function.
APPENDIX
Although TI-83 Plus has the IRR function in its “Finance Application”, it cannot handle the multiple IRRs problem. If there are two IRRs, IRR function can only find one IRR. The following presentation demonstrates that only one IRR can be found. Again, use the numerical example of non-conventional cash flows shown on page 2.
The first step is to input cash flows stream. Press STAT and select “1:Edit”. The following statistical list editor is displayed (Fig. 16). Input the cash flows from Year 1 to Year 4 in L1 column so L1 column will be as follow (Fig. 17):
(Fig. 16) (Fig. 17)
(Fig. 18) (Fig. 19)
Use ▼ to arrow down and find the IRR function on “ 8↑irr( “(Fig. 20). Select “8↑irr(“ and “irr(“ shows up. The Year 0 cash flow is −580 so input “−580, L1)”
9
to make irr(−580,L1) and press ENTER . Then IRR = 9.8966 will be shown as follows (Fig. 21):
(Fig. 20) (Fig. 21)
9.8966% is only the first IRR. The second IRR cannot be found using this IRR function. Therefore, only one IRR can be calculated.
Jeng-Hong Chen is currently an assistant professor of finance at College of Business, Albany State University. Dr. Chen teaches corporate finance in undergraduate and graduate school at Albany State University. He emphasizes the importance of technology in finance education and integrates technology with his corporate finance courses. Dr. Chen enjoys teaching students how to use financial/graphing calculators and spreadsheet software to solve time value of money-related problems efficiently and effectively. His research interest includes fixed income securities, market microstructure, and international finance.
REFERENCES
1. Adair, Troy A. Jr., Excel Applications for Corporate Finance, McGraw-Hill/Irwin, New York, 2005. 2. Benninga, Simon, Principles of Finance with Excel, Oxford University Press, New York, 2006.
3. Brealey, Richard A., Stewart C. Myers, and Franklin Allen, Principles of Corporate Finance, 8th Edition, McGraw-Hill/Irwin, New York, 2006.
4. Brighham, Eugene F., Brigham’s Technology Supplement, The Dryden Press, Orlando, 1999.
5. Brighham, Eugene F. and Joel F. Houston, Fundamentals of Financial Management, Concise 5th Edition, Thomson South-Western, Ohio, 2006.
6. Graham, John R. and Campbell R. Harvey, The Theory and Practice of Corporate Finance: Evidence from the Field, Journal of Financial Economics 61, pp. 187-244, 2001.
7. Lorie, James H. and Leonard J. Savage, Three Problems in Rationing Capital, Journal of Business 28, pp. 229-239, 1955.
8. Ross, Stephen A., Randolph W. Westerfield, and Bradford D. Jordan, Fundamentals of Corporate Finance, 8th, McGraw-Hill/Irwin, New York, 2008.
Endnotes
1 It is possible that a project may have no IRR if the NPV is always negative no matter what the discount rate is.
2 The detailed steps to draw the NPV profile and compute multiple IRRs can also be applied to the similar TI graphing calculators such as TI-83 and TI-84 Plus.
3
X,T,θ,n is the editing key located on the third row second column of TI-83 Plus keyboard. Press this key and X will be shown on the screen.
4
Because TI-83 Plus’s default setting for decimal places is float, we see a lot of decimal places. If we would like to change the number of decimal places, just press MODE and move the cursor to the right of “Float” and select the desired number of decimal places and press ENTER to change it.
5
It does not matter if students do not know two IRRs are roughly close to 10% and 32%. Students can randomly input a number, say 2, then the calculator will base on this number to find an IRR (9.8966%), which is closer to this number than the other IRR. This way also applies to “Method II: Using equation solver” and “HP 10bII financial calculator” method.
6 It does not matter if students do not know the other IRR is close to 32%. After finding the first IRR = 9.8966%, students can randomly input a number, say 50, then the calculator will base on this number to find the second IRR (32.1866%), which is closer to this number than the first IRR. This way also applies to “Method II: Using equation solver” and “HP 10bII financial calculator” method.
7
TI BAII Plus and Sharp EL-733A are popular and good financial calculators. However, it seems that they can only find one IRR (9.8966%) when dealing with the project with non-conventional cash flows such as this example.
8
If “Solver” is not shown in “Tools” menu, select “Add-Ins” and check “Solver Add-in” box.
9
The way to input “−580,L1)” is (-)580, 2 nd