SUMMARY
Although clinical and histological factors have helped in predicting survival in patients with oral squamous cell carcinoma, there has been need for more specialized diagnostic and prognos tic factors. The research has focused on discovering biologic markers, as well as factors related to the morphology of the neoplastic cells and tissues, which can be studied through computer-aided image analysis.
Image analysis methods are divided into two categories: conventional methods, which usually focus on the size of the nuclei and more modern and accurate methods, which produce, by means of fractal analysis, results that can be proved to be mathematically reliable. These methods assess the nuclear complexity and the complexity of other struc tures of the neoplastic tissue such as the vascular complex ity. Image analysis methods and especially fractal analysis, confirm mathematically the pathologist’s subjective assessments.
Keywords: Fractal, dimension, oral cancer, squamous cell carcinoma, prognostic factors, angiogenesis, morphometry, image analysis.
Fractal Analysis in the Study of
Oral Cancer
Goutzanis L, Pavlopoulos P M, Papadogeorgakis N Department of Oral and Maxillofacial Surgery, Dental School, University of Athens.The aim of this article is to review fractal analysis applications in the study of oral cancer and to show its usefulness in diagnosis and prognosis. More specifically this study focuses on fractal dimensions, and especially nuclear fractal dimension (FD) and vascular fractal dimension (VFD), as prognostic factors in oral cancer.
INTRODUCTION
Oral squamous cell carcinoma (OSCC) is the most com mon type of oral malignancy.1 Despite progress in
thera peutic approaches, the five-year survival rate for oral cancer has not improved significantly over the past several decades and it remains about 50%, making this disease a serious public health problem.1 The need
for effective treatment protocols has led to the use of diagnos tic and prognostic systems that use clinical and histopathological criteria, to stage the disease appropriately and enable specific treatment for each stage.
taken after consideration of all relevant factors.2
The biological behavior of individual tu mors remains however unpredictable. It is not clear why some patients with locally advanced stage disease (stage T3 and T4) are slow to develop regional metastases, whereas some lower stage lesions (stage T1 and T2) show early and aggressive involvement of the regional lymph nodes. The ability to predict which primary lesions are capa-ble of early metastases would enacapa-ble more individualized and aggressive treatment to be delivered to patients at higher risk of locoregional disease recurrence and death.3
Therefore, although clinical and histological factors have helped in predicting survival in patients with OSCC, there has been need for more specialized diagnostic and prognos tic factors. The research has focused on discovering biologic markers, as well as factors related to the morphology of the neoplastic cells and tissues, which can be studied through computer-aided image analysis.
Image analysis methods are divided into two categories: conventional methods, which usually focus on the size of the nuclei and more modern and accurate methods, which produce, by means of fractal analysis, results that can be proved to be mathematically reliable. These methods assess the nuclear complexity and the complexity of other struc tures of the neoplastic tissue such as the vascular complexity. Image analysis methods confirm mathematically the pathologist’s subjective assessments.
The aim of this article is to review fractal analysis applications in the study of oral cancer and to show its usefulness in diagnosis and prognosis. More specifically this study focuses on fractal dimensions, and especially nuclear fractal dimension (FD) and vascular fractal dimension (VFD), as prognostic factors in oral cancer.
FRACTAL GEOMETRY-FRACTAL
ANALYSIS
Fractal geometry is a new development in Mathematics, established by Benoit Mandelbrot.4 It aids the accurate
study of the structural properties of natural objects includ ing histopathology specimens. The structure of these ob jects is highly complex and is also characterized by self-similarity.5,6 They are described as ‘’fractal
objects’’. The assessment and quantification of the degree of complexity and irregularity of these objects
gives measurements called ‘’fractal dimensions’’ (FD). The most widely used method of estimation of the fractal dimension of natural (fractal) ob jects is the box-counting algorithm used by several com puter programs.7,8 This is
more specifically termed box-counting dimension (DB).
It has been found that many structures of the human body such as vessels of the retina, air channels of the lungs and the arterial tree of the kidneys can be regarded as frac tal objects.9-12 Moreover, fractal geometry is
applied in many fields of medicine: in cardiology for heart rate estima tion,13,14 in neurology for the analysis
of changing patterns in electroencephalograms,15,16
in radiology for radiographic analysis and analysis of mammographic lesions and tomographies.17-20
Fractal analysis has found applications in histopathology and cytology where it has been used for the estimation of the fractal dimensions of several neoplasms such as carcinomas of the gallbladder,21 lung,22 uterus,23
breast,24 larynx8 and oral cavity. 25-28
NUCLEAR FRACTAL DIMENSION
Conventional histopathology uses nuclear abnormalities in assessment of the degree of differentiation. Nuclear complexity measured by fractal analysis is an objective and sophisticated way of quantification of nuclear attributes.
The fractal dimension of malignant melanomas has been the subject of recent studies. It has been found that image analy sis based on a combination of conventional algorithms and fractal parameters can help to automate the diagnosis of melanoma. 29,30
As mentioned above, fractal analysis has already produced notable results in the histopathological and cytological study of several other neoplasms, such as adenocarcinoma of the gallbladder,21 lung cancer,22
endometrial carcinoma,23 breast tumors24 and laryngeal
carcinoma.8
Rippin (1993) in their study, showed that the increase of abnormalities observed on this interface (accompanied by severe dysplasia and invasive carcinoma) was followed by an increase of fractal dimen sion. The difference between the two FD values was consid erable (1.00 in the normal epithelium and 1.61 in the invasive carcinoma).26
In a subsequent study the same investigators found that in specimens from oral lesions diagnosis by means of fractal analysis of the epithelial—connective tissue interface may reach an accuracy of 85%. The fractal analysis results were used to create colour-coded dimensional images, in order to focus on areas of high irregularity, which may represent high risk sites.27
In the first of our studies on fractal dimensions28,
histological sections from 48 oral squamous cell carcinomas as well as from 17 non-malignant mucosa specimens were stained with Hematoxylin—Eosin for pathological examination and with Feulgen for nuclear complexity evaluation. The sections were evaluated by image analysis using fractal analysis software to quantify nuclear FD by the box-counting method. For standard nuclear morphometry two representative high power fields (x400) of Feulgen stains were randomly se lected and photographed from each biopsy. According to a usually followed procedure, from each image 100 well-stained, well-defined and non-overlapping neoplastic nuclei are semi-manually selected and extracted from the background with the aid of the Adobe PhotoShop CS ‘’magnetic lasso tool’’. (Fig. 1). These images files are automatically trans formed to binary images suitable for
fractal analysis, through a non-supervised histogram-based clustering proce dure, which constitutes a modification and extension of the Otsu methodology
Fig. 1: Left: Optimized image. Right: The same image after the selection of nuclei and removal of the background.
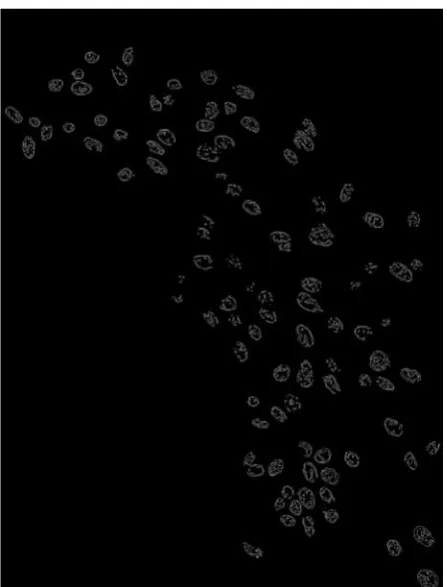
Fig 2: Binary image suitable for fractal analysis
for true color images.31 Each binary file which is
produced with this procedure is subjected to a removal of all 8-connected pixels, thus resulting in binary images containing single pixel lines, rep resenting not only the nuclear periphery but their inner structure complexity as well (Fig. 2).
The nuclear fractal dimension (FD) on each image is estimated by using an implementation of the widely used box-counting algorithm in a specially designed application (Fractalyser).7 In short,
Fig 3: A grid with multiple small boxes of particular pixel length is superimposed on the digital image. The process is repeated with different box lengths. For each given pixel length the number of boxes containing part of the contours under analysis is counted (positive boxes).
positive boxes and finally the slope of the graph, which reflects the fractal dimension of the image, is identified using the least-squares method of regression anal ysis (Fig. 4).
Finally, in our study on nuclear fractal dimension in oral cancer, it was found that FD values are generally higher in carcinomas that in normal tissues28. This finding
agrees with the observations of other researchers about different types of neoplasms. Using the box-counting method for the fractal analysis of 359 colorectal polyps (including tubulovillous adenomas, meta-plastic polyps, and inflammatory polyps), Cross et al. (1994) discovered that the mean FD value for tubulovillous adenomas was significantly larger than that for meta-plastic polyps or inflammatory polyps but assignment of individual cases to diagnostic groupings was not precise enough for clinical diagnostic work.32
In our study28, apart from the general differences in
FD val ues between carcinomas and normal tissues, it was also discovered that FD values are lower in normal epithelium and stage I neoplasms than in stage II—IV tumors (all p < 0.05).
With regards to the relation between FD and tumor dif ferentiation in general, we observed that in normal
epithe lium and in well differentiated neoplasms FD values were low, while in less differentiated tumors they were high. By staging the malig nant lesions, we also showed that there is a statistically significant difference between well differentiated tumors and tumors with well/moderate, moderate, moderate/poor or poor differentiation (t-test, p < 0.05).
The same observations were made by other investigators in a recent study of 52 patients with laryngeal carcinomas.8 In this study a statistically
significant correlation between fractal dimension and the cell differentiation was also observed.
The most important finding of our study was, however, the value of FD as a prognostic factor. The tumor stage (p < 0.001), the degree of tumor differentiation (p < 0.05) and the fractal dimension of the neoplastic nuclei (p < 0.05) were proved to be independent prognostic factors. More specifically, in all neoplasms we observed that there was a difference in survival between the group of pa tients with FD values lower than 1.313 (median FD value) and the group of patients with FD values higher than that (Fig. 5). These findings support the value of nuclear fractal dimension as an independent prognostic factor for the study of oral squamous cell carcinoma28.
The value of fractal dimension as a prognostic factor is also supported by the findings from studies of other types of carcinomas. Fractal dimension was proved to be a statis tically significant prognostic factor for laryngeal carcinoma in the study of Delides et al. (2005). In this particular study, the prognosis for patients with FD higher than the median value was poorer than for patients with FD lower than the median value.8
VASCULAR FRACTAL
DIMENSION
Angiogenesis, the development of new vessels, has a pivotal role in the growth and spread of solid tumors with potential diagnostic and therapeutic applications.33-35
Tumor angiogenesis is controlled Fig 5: Kaplan–Meier graph. Patients with nuclear FD values lower than 1.313 (blue line,
by angiogenic factors directly induced from tumor cells, as well as by factors indirectly induced from surrounding stromal tissues. Vascular endothelial growth factor (VEGF), basic fibroblast growth factor (bFGF), and platelet-derived endothelial growth factor (PDGF) are highly specific for endo thelium and act as vascular permeability factors.36
Several studies have shown that neovascularization, as assessed by microvessel counting, con stitutes a significant prognostic factor in cutane ous melanoma,37
breast,38 prostate,39 and lung carci nomas,40 as well as in
head and neck cancer.41,42 These studies have, however,
taken into consider ation the microvessel density (MVD), overlooking other parameters that might be significant, such as the complexity and the size of microvessels.
Angiogenesis-related vascular patterns meas ured by fractal analysis may be used in the diag nosis and determination of prognosis of lung,22 kidney,43 cervical,
rectal carcinomas, and meso-theliomas.44 In renal
carcinomas, fractal analysis of the architecture of the vascular pattern showed that there is a correlation between the tumor vascularity, the grading with conventional histology, the degree of tumor necrosis, and the patient survival.43
In the second of our studies on fractal dimensions, we evaluated the vas cular fractal dimension and the (immunohisto-chemically positive) total vascular area by image analysis, as morphometric parameters related to the vessel shape and size respectively, in tissue specimens from patients with oral carcinomas and also assessed them as factors reflecting angiogenesis.45
This study, in accordance with the aforemen tioned, showed that the vascular fractal dimen sion values for oral carcinomas were significantly higher than those observed in the control (non-neoplastic) group. We have also seen an increase of vascular fractal dimension values from tumor stage I to III, although this was not statistically significant. There was a decrease in the vascular fractal dimension value between stage III and IV. This implies that angiogenesis reaches a maximum level at a moment in the growth of the tumor. Thus, as neoplastic disease evolves, it appears that the rate of new vessel formation is inhibited, at least in relation to the tumoral growth, resulting in a reduced vascular fractal dimension. This phenomenon may reflect the influence of factors inhibiting angiogenesis, inadequacy of the angiogenic mechanisms to support a rapidly growing neoplasm, or a gradual restriction of the tumor’s metabolic needs.46
We also estimated the total vascular area and found that tumors had higher values than non-neoplastic tissues45. The difference was, however, not significant.
Total vascular area was also seen to increase progressively from stages I to III and decrease from stage III to IV. There was a statisti cally significant difference between stages I and III ( p = .046). The process leading to these changes is likely to be the same with the pro cess that affects the vascular fractal dimension changes in a similar way. The total vascular area has not been extensively researched in contrast with the microvascular density which is commonly used as prognostic factor in several neoplasms including those of the breast,47 lung,40 and
mouth.41 The high sensitivity of total vascular area
in the study of tumor angiogenesis has only recently been recognized.46,48 In their morphometric study of
neovascularization in colorectal carcinoma, Pavlopoulos et al46 showed that the total vascular area of highly
vascular tissue was an independent prognostic factor. In this study microvascular den sity was not shown to have any prognostic value. Pazouki et al48 in their study
of angiogenesis in oral carcinomas showed that there is a close asso ciation between vascularity and tumor progres sion in the oral mucosa and provided evidence that morphometric analysis reflecting microvascular volume is more informative than the cur rently popular analysis of microvascular density.
Another finding in our study was the strong positive correlation between vascular fractal dimension and total vascular area (r = .709, p = .000). This degree of statistical signifi cance was expected considering the vascular frac tal dimension and total vascular area values and trends observed in the study (oral carcinoma) group45.
These findings support the hypothesis that vascular fractal dimension is a reliable indicator of angiogenesis in oral malig nant tumors and furthermore that the parameters vascular fractal dimension and total vascular area, depending on the shape complexity as well as on the size of microvessels, provide a better assessment to the overall vascular surface area.
CONCLUSIONS
(FD and VFD) and other morphometric characteristics or clinicopathologic factors in oral squamous cell carcinomas.
However, additional stud ies are warranted, with increased numbers of patients, to corroborate the findings provided. The simulta neous assessment of FD, VFD and other conventional morphometric and clinicopathologic parameters of neoplastic tissues could form the base of an oral pathology diagnostic system of high reliability, reproducibility and objectivity.
REFERENCES
ES. Estimation of fractal dimension in radiographs. Med Phys 1996;23:585—94.
19. Velanovich V. Fractal analysis of mammographic lesions: a feasibility study quantifying the difference between benign and malignant masses. Am J Med Sci 1996;311:211—4.
20. Dougherty G, Henerby GM. Fractal signature and lacunarity in the measurement of the texture of trabecular bone in clinical CT images. Med Eng Phys 2001;23:369—80.
21. Waliszewski P. Distribution of grand-like structures in human gallbladder adenocarcinomas possesses fractal dimension. J Surg Oncol 1999;71:189—95.
22. Oczeretko E, Juczewska M, Kasacka I. Fractal geometric analysis of lung cancer angiogenic patterns. Folia Histochem Cytobiol 2001;39(Suppl. 2):75—6.
23. �Dey P, Rajesh L. Fractal dimension in endometrial carcinoma. Anal Quant Cytol Histol 2004;26(2):113—6.
24. Yokoyama T, Kawahara A, Kage M, Kojiro M, Takayasu H, Sato T. Image analysis of irregularity of cluster shape in cytological diagnosis of breast tumors: cluster analysis with 2D-fractal dimension. Diagn Cytopathol 2005;33(2):71—7.
25. Abu Eid R, Landini G. Quantification of the global and local complexity of the epithelial—connective tissue interface of normal, dysplastic and neoplastic oral mucosa using digital imaging. Pathol Res Pract 2003;199(10):703—4.
26. Landini G, Rippin JW. Fractal dimensions of the epithelial— connective tissue interfaces in premalignant and malignant epithelial lesions of the floor of the mouth. Anal Quant Cytol Histol 1993;15(2):144—9.
27. Landini G, Rippin JW. How important is tumour shape? Quantification of the epithelial—connective tissue interface in oral lesions using local connected fractal dimension analysis. J Pathol 1996;179(2):210—7.
28. Goutzanis L, Papadogeorgakis N, Pavlopoulos PM, et al. Nuclear fractal dimension as a prognostic factor in oral squamous cell carcinoma. Oral Oncol 2008;44:345-353.
29. Stanganelli I, Brucale A, Calori L, Gori R, Lovato A, Magi S, et al. Computer-aided diagnosis of melanocytic lesions. Anti-cancer Res 2005;25(6):4577—82.
30. Manousaki AG, Manios AG, Tsompanaki EI, Tosca AD. Use of color texture in determining the nature of melanocytic skin lesions——a qualitative and quantitative approach. Comput Biol Med 2006;36(4):419—27.
31. Pavlopoulos PM, Zimeras S, Kavantzas N, Korkolopoulou P, Agapitos E, Patsouris E. Segmentation of transitional cell carcinoma nuclei by nonsupervised thresholding in different color spaces. Anal Quant Cytol Histol. 2007 Aug;29(4):271-8.
32. Cross SS, Bury JP, Silcocks PB, et al. Fractal geometric analysis of colorectal polyps. J Pathol 1994;172:317—23.
33. Folkman J. Growth and metastasis of tumor in organ cultures. Cancer 1963;16:453-467.
34. Folkman J. What is the evidence that tumors are angio-genesis dependent? J Natl Cancer Inst 1990;82:4-6.
35. Folkman J, Shing Y. Angiogenesis J Biol Chem 1992;267:10931-10934.
36. Li C, Shintani S, Terakado N, et al. Microvessel density and expression of vascular endothelial growth factor, ba sic fibroblast growth factor, and platelet-derived endothe-lial growth factor in oral squamous cell carcinomas. Int J Oral Maxillofac Surg 2005;34:559-565.
37. Srivastava A, Laidler P, Davies RP, Horgan K, Hughes LE. The prognostic significance of tumor vascularity in intermediate-thickness (0.76-4.0 mm thick) skin mela noma: a quantitative histologic study. Am J Pathol 1988;133:419-423.
38. Horak ER, Leek R, Klenk N, et al. Angiogenesis assessed by platelet-derived cell adhesion molecular antibodies, as indicator of node metastases and survival in breast cancer. Lancet 1992;34:1120-1. Silverman Jr S. Demographics and occurrence of oral and
pharyngeal cancers. The outcomes, the trends, the challenge. J Am Dent Assoc 2001; 132:7S—11S.
2. Brown AE, Prein J. The team approach in the management of oral cancer. In: Booth PW, Schendel SA, Hausamen JE, editors. Maxillofacial surgery, vol. 1. Churchill Livingstone; 1999. p.325—30. 3. Kademani D, Bell B, Bagheri S, Holmgren E, Dierks E, Potter B,
et al. Prognostic factors in intraoral squamous cell carcinoma: the influence of histologic grade. J Oral Maxillofac Surg2005;63:1599— 605.
4. Mandelbrot BB. The fractal geometry of nature. New York: WH Freeman Ed.; 1982.
5. Losa GA. Fractals in pathology: are they really useful? Patho-logica 1995;87:310—7.
6. Avnir D, Biham O, Lidar D, Malcai O. Is the geometry of nature fractal? Science (Washington, DC) 1998;279:39—40.
7. Pavlopoulos PM, Kavantzas N, Agapitos E, Patsouris E. Software development for fractal analysis of histopathologic images. Hellenic Arch Pathol 2004;18(1—3):22—7.
8. Delides A, Panayoiotdes I, Alegakis A, Kyroudi A, Banis C, Pavlaki A, et al. Fractal dimension as a prognostic factor for laryngeal carcinoma. Anticancer Res 2005;25:2141—4.
9. Family F, Masters BR, Platt DE. Fractal pattern formation in human retinal vessels. Physica 1989;38:98—103.
10. Mainster MA. The fractal properties of retinal vessels: embrylogical and clinical implications. Eye 1990;4(Pt1):235—41.
11. Nelson TR, West BJ, Goldberger AL. The fractal lung: universal and species-related scaling patterns. Experientia 1990;46(3):251—4. 12. Cross SS, Start RD, Silcocks PB, Bull AD, Cotton DW, Underwood
JC. Quantitation of the renal arterial tree by fractal analysis. J Pathol 1993;170(4):479—84.
13. Yeragani VK, Srinivasan K, Vempati S, Pohl R, Blon R. Fractal dimension of heart rate time series: an effective measure of automic function. J Appl Physiol 1993;75:2429—38.
14. Otsuka K, Cornelissen G, Halberg F. Circadian rhythmic fractal scaling of heart rate variability in health and coronary artery disease. Clin Cardiol 1997;20:631—8.
15. Pradhan N, Dutt DN. Use of running fractal dimension for the analysis of changing patterns in electroencephalograms. Com-put Biol Med 1993;23:381—8.
16. Preissl H, Lutzenberger W, Purvermuller F, Birbaumer N. Fractal dimensions of short EEG time series in humans. NeurosciLett 1997;225:77—80.
1124.
39. Brawer MK, Deering RE, Brown M, Preston SD, Bigler SA. Predictors of pathologic stage in prostatic carcinoma. The role of neovascularity. Cancer 1994;73:768-787.
40. Macchiarini P, Fontanini G, Hardin MJ, Squartini F, Angelletti GA. Relation of neovascularization to metastasis of non-small-cell lung cancer. Lancet 1992;340:145-146.
41. Williams JK, Carlson GW, Cohen C, Derose PB, Hunter S, Jurkiewicz MJ. Tumor angiogenesis as a prognostic factor in oral cavity tumors. Am J Surg 1994;168:373-380.
42. Tab K, El-Naggar AK, Yoo E, et al. Expression of vascular endothelial growth factor and microvessel density in head and neck tumorigenesis. Clin Cancer Res 2000;6: 2821-2828.
43. Sabo E, Boltenko A, Sova Y, Stein A, Kleinhaus S, Resnick MB. Microscopic analysis and significance of vascular architectural complexity in renal cell carci noma.
44. Weyn B, Tjalma WA, Vermeylen P, van Daele A, Van Marck E,
Jacob W. Determination of tumour prognosis based on angiogenesis-related vascular patterns mea-ured by fractal and syntactic structure analysis. Clin Oncol 2004;16:307-316.
45. Goutzanis LP, Papadogeorgakis N, Pavlopoulos PM, Petsinis V, Plochoras I, Eleftheriadis E, Pantelidaki A, Patsouris E, Alexandridis C. Vascular fractal dimension and total vascular area in the study of oral cancer. Head Neck. 2009 Mar;31(3):298-307.
46. Pavlopoulos PM, Konstantinidou AE, Agapitos E,Kavantzas N, Nikolopoulou P, Davaris P. A morphometric study of neovascularization in colorectal carcinoma. Cancer 1998;83:2067-2075.
47. Bosari S, Lee AKC, DaLellis RA, Willey BD, Heatley GJ, Silverman ML. Microvessel quantitation and prognosis in invasive breast carcinoma. Hum Pathol 1992;23:755-761.