~ 149 ~ WWJMRD 2017; 3(7): 149-154
www.wwjmrd.com Impact Factor MJIF: 4.25 e-ISSN: 2454-6615
Khushpreet Kaur M.Tech Research Scholar GKU Talwandi Sabo, Punjab, India
Lovepreet Kaur Assistant Professor GKU Talwandi Sabo, Punjab, India
Correspondence: Khushpreet Kaur M.Tech Research Scholar GKU Talwandi Sabo, Punjab, India
Hybrid Clustering Algorithm for Wireless Sensor
Network Using HEED and SCH Techniques
Khushpreet Kaur, Lovepreet Kaur
Abstract
Recent significant research on wireless sensor networks (WSNs) has led to the widespread adoption of software defined wireless sensor networks, which can be reconfigured even after deployment. In this paper, we propose an energy-efficient routing algorithm for WSNs. In this work there is data duplication and data redundancy problem that I have faced and some other problem is the network life time problem due to the redundancy and transmission energy is lossed, so there is energy consumption problem. Due to these problems some other problems like scheduling problem. All these Problems are resolved with the help of the hybrid techniques (combinations of HEED and SCH) for data aggregations and jamming attacks and for energy efficiency, the ANT based routing algorithm on WSN is designed. The whole work is implemented in the NS2 but the existing work is implemented in MATLAB. The performance of proposed work is better than the existing work.
Keywords: WSN, Cluster, HEED, SCH, Routing.
Introduction
A sensor network is an integrated circuit of sensor, embedded compute, modern network, wireless communication and distributed information process. Wireless sensor network is a new information acquiring and processing technology which yields by the recent advances in miniaturization and low power design that led to the development of small-sized battery functioned sensors that are capable of detecting ambient conditions such as temperature and sound [2]. Sensor networks are widely used in variety of applications such as civil as well as military applications because of its miniaturization in size, low cast and large lifetime. In order to keep the cost and size of these sensors small, they are equipped with small batteries that can store at most 1 Joule. A sensor in such a network can therefore communicate directly only with other sensors that are within a small distance [1]. In order to communicate for a very long distance they must create an organization structure amongst these nodes. Since the fundamental advantage of wireless sensor networks is the ability to deploy them in an ad hoc manner, as it is not feasible to organize these nodes into groups pre-deployment. For this reason, there has been a large amount of research into ways of creating these organizational structures [2]
Figure. 2 shows the general architecture of sensor network. The basic parameters of the sensor networks are Sensor Node, Cluster, Cluster head, Base Station and user, in the hierarchical architecture of the group the base station is at the upper level which provides communication link between the user and the clusters. The data in the sensor network are gathered for providing the answers for the queries raised by the user [1]. An essential part of developing WSNs is being energy aware by reducing the power consumption because of the power limitation.
~ 150 ~
Fig. 1: General Architecture of sensor network [6]
There are many possible solutions in order to reduce the power consumption of the wireless sensor nodes such as enhance the storage systems energy density, improve a technique to distribute the power among the nodes, and produce a mechanism to make the nodes scavenge their own power [6]. The clustering algorithms play an important role in not just organizing the network but also control the performance of the network organization. There are several key limitations in wireless sensor networks, that clustering schemes must consider are Energy, Lifetime of Network , Application, Accuracy, Receiver Sensitivity, Type of transmitting signal , Distance ,response time, cluster stability, cluster overlapping, location awareness, QoS support and node mobility.[1]
Cluster-based routing is a solution to address node heterogeneity, and to limit the amount of routing information that propagates inside the network [2, 17, 18, 19]. The idea behind clustering is to group the network nodes into a number of overlapping clusters. Clustering makes possible a hierarchical routing in which paths are recorded between clusters instead of between nodes. This increases the routes lifetime, thus decreasing the amount of routing control overhead. Inside the cluster, one node that coordinates the cluster activities is known as a cluster head (CH). The set of cluster heads is known as a dominant set. Inside the cluster, there are also ordinary nodes and have direct access only to this one cluster head, and gateways. Gateways are nodes that can hear two or more cluster heads [2]. Groups of the nodes are organized with respect to their nearness to other nodes. Two nodes are said to be neighbors of each other when both of them lie within their transmission range and set up a bidirectional link between them [3]. Clustering is an important approach to solving capacity and scalability problems in mobile ad hoc networks where no physical infrastructure is available. The connected dominating set (CDS) is a special cluster structure in which the cluster heads form a connected network without using gateways. A cluster head does the resource allocation to all the nodes belonging to its cluster. Due to the dynamic nature of the mobile nodes, their association and dissociation to and from clusters disrupt the stability of the network and thus reconfiguration of
cluster heads is unavoidable. This is an important issue since frequent cluster head changes adversely affect the performance of other protocols such as scheduling, routing and resource allocation that rely on it. The choice of the cluster heads is here based on the weight associated to each node: the bigger the weight of a node, the better that node is for the role of cluster head.
Fig. 2: Transmission range zones [6]
System Model
A. Network model in this paper, we consider the network architecture as shown in Figure 1.7. G = (V;L) denotes the directed graph representing the network. V is the vertex set, including one control sever and a number of sensor nodes distributed within the monitoring field randomly. L is the set of directed links. The following assumptions on the sensor network and sensor nodes under consideration in this paper are made:
We consider a set of _ sensing targets, e.g., temperature, humidity, and so on, which are randomly distributed within the same region of the SDWSN; The resources in a sensor node should be managed,
controlled and allocated in an orderly manner in support of various sensing tasks. Besides, to complete different tasks, corresponding programs are stored on the sensor nodes, and the sensor node shall allow application programmers to adjust the sensor functionalities via invoking different programs; Each sensor node has the same ability to operate either
in the sensing mode to perceive the environmental parameters or in the communications mode to send data among each other or directly to the control server, and each node can gather data packets from a cluster member when acting as the control node. And each sensor node is assigned a unique identifier (ID); The sensor nodes and control server are stationary
after deployment, which is typical for sensor network applications;
Initial energy is fair to each sensor node, and the network is considered homogeneous;
All the nodes are left unattended without battery replacement after deployment;
Nodes are location-unaware, i.e., not equipped with GPScapable antennae or other similar equipment, and each node is assigned a number according to its location;
The links between the nodes are symmetric. A node can estimate the distance to another node based only on the received signal power;
~ 151 ~
Methodology
This section defining the way of implementation that is to done in this research work. The basic function of opportunist routing (OR) is its ability to overhear the transmitted packet and to coordinate among relaying nodes. In OR, a candidate set is a potential group of nodes that is selected as the next-hop forwarders. Hence, each node in OR can use different potential paths to send packets toward the destination. Any of the candidates of a node that have received the transmitted packet may forward it. The decision of choosing the next forwarder is made by coordination between candidates that have successfully received the transmitted packet.
In this work WCA is designed with the help of Network Simulator. Since we assume that all nodes are identical and produce data at the same rate, to balance load in the system we have to balance the number of nodes in a cluster and the communication energy required per cluster head.
The node degree of a node vi is deduced as the cardinality
of the set N(vi):
Based on the previous equations, we set our stability factor for each node vi as:
We propose to calculate the relative dissemination degree. This parameter reflects the relative deviation of the number of neighbors in a current setting from that ideal.
It is known that more power is required to communicate to a larger distance. Therefore, we are motivated to evaluate the energy consumption. For this purpose, for every node vi, we compute the sum of the distances D(vi), with its
neighbors, as:
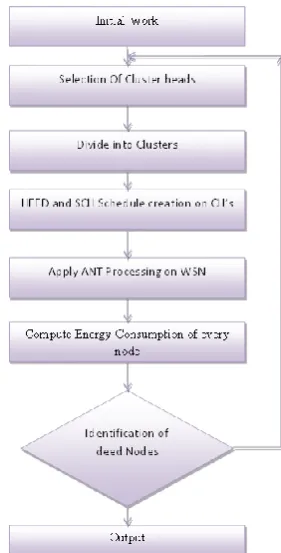
The cluster head selection process is composed of the following steps:
1. Find the neighbors (degree) of each node using 2. For each node, calculate the stability factor using 3. For each node, apply the ANT processing to calculate
the relative dissemination degree using 4. Evaluate the energy consumption using
5. Calculate the remaining battery energy of each node (RBE(vi))
6. Calculate the combined weight W(vi) for each for
each Node vi:
Wvi=D(Vi)*0.2+β(Vi)*0.5+STF*0.1+Mv*0.2
7. Select the node not situated on the border and having the minimum weight Wvi as a cluster head.
8. Delete node vi and all itsN (vi) from G.
9. Repeat the 7th and 8th steps until G is empty. Awaiting Factor =1
Proposed Algorithm
Cluster head Selection Input: No of Sensor nodes, Initial
node energy, probability (p), No of rounds. Output: Cluster heads, Clusters.
Start
Step 1: Base station broadcasts Beacon packets.
Step 2: All Sensor node replies with residual energy and location.
Step 3: If network life time is not over then,
i. For first round, Cluster heads are randomly selected. ii. For rest of the rounds, Base station chooses p% of the
nodes as Cluster heads having more residual energy.
Step 4: If a node is Cluster head then,
i. It broadcasts its Cluster head advertisement packet. ii. All non-Cluster head nodes, sends joining request
packet to those cluster head, who‟s received signal strength is more.
Step 5: Assumption
i. All nodes are fairly distributed for tier one and tier two.
ii. Nodes are static and not mobile iii. The initial energy for all nodes is same.
iv. The base station of this network is located at the Centre of the field.
Step 6: Node DistributionThe sensor nodes are distributed into tier one and tier two based on the area of circle formula as follows;
Area of big rectangle, (R) = (2(l*b)) (1). Area of level one, (LO) = L2 (2).
Area of level two = R– LO (3).
From the above formula, it is seen that tier two has three times the quantity of nodes of tier one, which there are 25 sensor nodes distribute at tier one and 75 sensor nodes at tier two. The distributions of the sensor nodes are shown in Fig. 4.1.
The base station is located at the centre of the sensor network which the coordinate is (50, 50).
~ 152 ~
Results
The Experimental result displays the different snapshots that are on research work. These are given below:
Fig. 3: Input node distribution
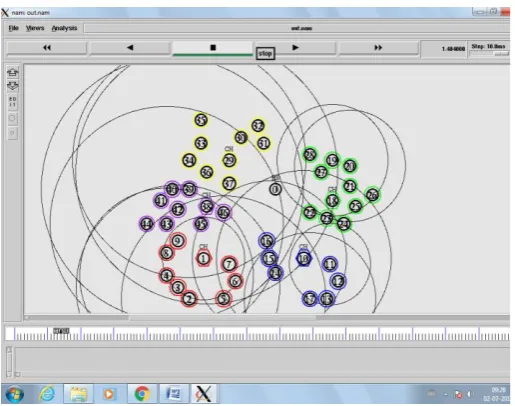
Fig. 4: Node and Cluster distribution with color
In the figure 4, is the processing of node and the distribution of node in the WSN and the figure 4 is the processing of nodes with their color.
Fig. 5: The transmission of signals in nodes and clusters
Fig. 6: Node and cluster transmission of signals
The figure 5 is the processing of signals from nodes and the cluster head and the figure 6 is the broadcasting of the signals from node to node and the clusters.
Fig. 7: Packet loss ratio w.r.t to time
The figure 7 is the fully transmission of signals from node to node and node to the cluster head. The figure 5.6 is the packet loss ratio graph w.r.t. to the time of the network.
~ 153 ~
Fig. 9: Energy _Consumption w.r.t time
The figure 9 is the energy consumption of signals from node to node and node to the cluster head. It displays the total energy used in Network with time.
Fig. 10: Throughput ratio w.r.t time
The figure 10 is throughput with time during the transmission of data on network. It is the total output of packet with respect to the time.
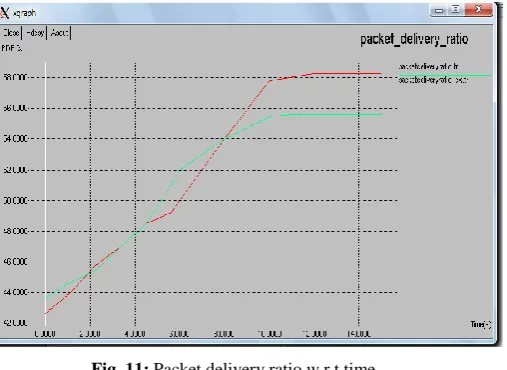
Fig. 11: Packet delivery ratio w.r.t time
Life time existing work and Proposed work on WSN
No. Of Nodes Existing Work Proposed work HEED PSO
300 390 510 620
400 410 700 810
500 412 630 670
600 500 600 690
Conclusion
Clustering is one of important method to be applied in order to prolong the network lifetime of wireless sensor network. The selections of cluster head also are important parts to be considered so that the lifetime of sensor nodes remains longer than usual. The main problem in wireless sensor network is the battery consumption. The sensor node battery cannot be recharged once it is depleted and there is no power supply. The existing protocols are not applicable to those WSNs that are deployed in large regions because it uses single hop routing where each sensor node can communicate directly to the cluster head and the base station. The whole work is implemented in the NS2 but the existing work is implemented in MATLAB. The performance of proposed work is better than the existing work. In this work the overall output is improved rather than existing work .i.e. 70%
Future Work
The research work includes a new energy-efficient routing algorithm for the software-defined wireless sensor networks. In our routing algorithm, the control nodes are assigned different tasks dynamically. It is further implemented with the help of other intelligent types like Honey Bee and ACO with PSO to get the real time work.
References
1. Wei Xiang et al.(2016) “An Energy-efficient Routing Algorithm for Software-defined Wireless Sensor Networks” IEEE-2016.
2. Lynda Mokdad et.al. “DJAVAN: Detecting jamming attacks in Vehicle Ad hoc Networks” Elsevier B.V. All rights reserved 2015.
3. Rohini Rawat et.al. “Impact of Jamming Attack in Vehicular Ad hoc Networks” International Journal of Advanced Research in Computer and Communication Engineering Vol. 4, Issue 4, April 2015.
4. Rohini Rawat et.al. “Mitigation of Jamming Attack in Vehicular Ad hoc Network” International Journal of Science, Engineering and Technology Research (IJSETR), Volume 4, Issue 6, June 2015
5. Baljinder Singh et.al. “Jamming attack in MANET: A Selected Review” International Journal of Advanced Research in Computer Science and Software Engineering , Volume 5, Issue 4, April 2015.
6. Y Qian, K Lu, and N Moayeri, “A Secure VANET MAC Protocol for DSRC Applications”, IEEE Globecom, 2008
7. Sofiah.W.I., et.al (2014), “MAP: The New Clustering Algorithm based on Multitier Network Topology to Prolong the Lifetime of Wireless Sensor Network” 10th International Colloquium on Signal Processing & its Applications (CSPA2014), 7 - 9 Mac. 2014. 8. Grover.A., et.al (2014), “AOMDV with Multi-Tier
Multi-Hop Clustering in Wireless Sensor Networks”
Advanced Engineering Technology and
Application,Adv. Eng. Tec. Appl. 3, No. 3, 29-33 . 9. Tripathi.A., et.al (2014),“ “Survey on Data
Aggregation Techniques for Wireless Sensor Networks ” International Journal of Advanced
Research in Computer and Communication
Engineering Vol. 3, Issue 7, July2014.
~ 154 ~
11. Maram Bani Younes et.al. (2015), “SCOOL: A Secure Traffic Congestion Control Protocol for VANETs”
Wireless Communications and Networking
Conference (WCNC): - Track 3: Mobile and Wireless Networks 2015 IEEE.
12. Dawood.M.Sheik., et.al (2012), “Study of Energy Efficient Clustering Algorithm for Wireless Sensor Networks” International Journal of Emerging Research in Management &Technology .
13. Yuea.Jun., et.al (2012), "Energy efficient and balanced cluster -based data aggregation algorithm for wireless sensor networks." Procardia Engineering 29: 2009-2015.
14. Tharini,C., et.al (2011), “An Energy Efficient Spatial Correlation Based Data Gathering Algorithm for Wireless Sensor Networks” International Journal of Distributed and Parallel Systems 2(3), 16–24.
15. Rahmani.N., et.al (2010), "CAT: The New Clustering Algorithm Based on Two-Tier Network Topology for Energy Balancing in Wireless Sensor Networks," in Computational Intelligence and Communication Networks(CICN), 2010 International Conference on, 2010.
16. Dehni. L., et.al (2006), "Power Control and Clustering in Wireless Sensor Networks," in Challenges in Ad Hoc Networking. vol. 197, K. Agha, et al., Eds., ed: Springer US.
17. Heinzelman.W.R., et.al (2000), “Energy-efficient communication protocol for wireless micro sensor networks," in System Sciences, 2000. Proceedings of the 33rd Annual Hawaii International Conference on. 18. Stankovic John A., Abdelzaher T, Lu C, Sha L, and
Hou J (2003), “Real-time communication and coordination in embedded sensor networks,” Proceedings of the IEEE, vol. 91, no. 7, 2003. 19. Hashmi S and T. Moufth, (2003), “A New Transport
Layer Sensor network protocol”, IEEE Transactions, vol. 5,pp.118-156, Mar.2003
20. Annoa, J., Barollib, L., Durresic, A., Xhafad, F., & Koyamae, A. (2008), “Performance evaluation of two fuzzy-based cluster head selection systems for wireless sensor networks”, Mobile Information Systems, 4, 297– 312.
21. Khalid Hussain, Abdul Hanan Abdullah,(2013), “Cluster Head Election Schemes for WSN and MANET‖: A Survey”, ISSN 1818-4952 © IDOSI Publications.
![Fig. 1: General Architecture of sensor network [6]](https://thumb-us.123doks.com/thumbv2/123dok_us/8397862.1685332/2.595.50.275.54.281/fig-general-architecture-sensor-network.webp)