http://www.sciencepublishinggroup.com/j/acis doi: 10.11648/j.acis.20190703.13
ISSN: 2328-5583 (Print); ISSN: 2328-5591 (Online)
Improved Wiener Filter Algorithm for Speech Enhancement
Zhao Yanlei, Ou Shifeng
*, Gao Ying
Department of Science and Technology for Opto-electronic Information, Yantai University, Yantai, China
Email address:
*
Corresponding author
To cite this article:
Zhao Yanlei, Ou Shifeng, Gao Ying. Improved Wiener Filter Algorithm for Speech Enhancement. Automation, Control and Intelligent Systems. Vol. 7, No. 3, 2019, pp. 92-98. doi: 10.11648/j.acis.20190703.13
Received: October 15, 2019; Accepted: November 14, 2019; Published: November 18, 2019
Abstract:
Most of the existing speech enhancement algorithms are aimed at improving the quality of speech, and the algorithms that can improve the speech intelligibility effectively are rare. Speech intelligibility has been found to improve listening comfort and it is generally related to the distortion of the speech signal closely. Studies have assessed the impact of speech distortion introduced by gain functions and shown that one of the main reasons that existing algorithms cannot improve speech intelligibility is because they allow amplification distortions more than 6dB. Therefore, these distortions of the enhanced amplitude spectrum should be corrected to improve the speech intelligibility. The early research by Loizou et al. obtained the experimental results on the ideal state and we are unable to use it in reality because there is no clean speech in reality. In this paper, we modify the method proposed by Loizou et al. and select the estimated speech under two hypothetical conditions to verify the improvement of the speech intelligibility. The short-term objective intelligibility value verifies the improvement of speech intelligibility as the improved algorithm of speech intelligibility is applied to reality successfully.Keywords:
Speech Intelligibility, Amplification Distortion,Short-Term Objective Intelligibility Value1. Introduction
Humans communicate with the outside world through speech signals, but the ubiquitous noise in life can cause a lot of interference to voice communication. Therefore, practical speech enhancement technology is needed to reduce noise pollution and restore the pure signal as far as possible. Great progress has been made in the development of singe-microphone noise reduction algorithms for hearing applications and speech communication systems [1] and the majority algorithms of them are aimed at improving speech quality and listening comfort, which is named speech intelligibility. Speech intelligibility also can reflect the listener's ability to understand the speech signal accurately. Existing speech enhancement algorithm can improve the speech quality in a certain degree but does not effectively improve consistently and substantially speech intelligibility.
Most noise-reduction algorithms involve two consecutive stages of processing as described in Figure 1: estimating SNR and applying gain function. This paper mainly focuses on improving the speech intelligibility by modifying the gain function. The Wiener filtering algorithm is similar to many
algorithms used in hearing aids [2, 3], which estimated SNR though a gain function to the spectral envelopes proportional in each frequency bin. Explain in detail, a high SNR spectral bin receives a high gain nearly 1, while a low SNR, which possibly masked by noise, receives a low gain nearly 0. The Wiener gain function has also been applied to hearing impaired listeners successfully (maybe under ideal conditions) [4].
It is critical to choose the frequency-specific gain function for the noise-reduction algorithm. Since the target and masker signals spectrally overlap, sometimes the target signal may be over-attenuated while in other instances, it may be over-amplified. Most noise-reduction algorithms usually can introduce two types of envelope distortions by the gain functions. Amplification distortion arising when the target signal is over-estimated (e.g., if we define a as the true value of the target envelope, and the estimated envelope is a+ ∆a,
a
∆ is some positive increment), and attenuation distortion arising when the target signal is underestimated (e.g., a− ∆a
how a specific parameter of the noise-algorithm need to be revised so as to get a higher speech intelligibility. Researches by Loizou et al. have shown that the effects of the two distortions on speech intelligibility are different. Areas with amplification distortion exceeding 6.02dB have serious damage to speech intelligibility and other areas have little effect on speech intelligibility [5].
In order to assess the impact of the speech distortion introduced by the gain function on the intelligibility of speech, Loizou et al. obtained a series of experiments to conclude that the speech intelligibility is damaged seriously when the amplification distortion in excess of 6dB. Since the experiments use clean speech and there is no clean speech in reality, so that the algorithm cannot be applied to reality. This paper learn the research thoughts from Loizou et al., and use the enhanced speech amplitude spectrum under two different
assumptions, simulate and average the values and analyze the simulation under different background noise and SNR.
Current study has focused on applying the improved speech intelligibility algorithms to reality. In the start of the paper, we analyzed the impact of two types of speech distortion (amplification distortion and attenuation distortion) introduced by noise-suppressive gain functions. Then based on the Wiener filter algorithm, there was a modified algorithm proposed to improve the speech intelligibility, it is verified that the algorithm improves the intelligibility of the speech amplitude spectrum estimated by two different amplitude square spectrum estimator. Finally, this paper summarized the reasons that existing algorithms do not improve the speech intelligibility and the methods to improve the speech intelligibility.
Figure 1. Signal-processing stages incorporate in noise-reduction algorithms.
2. Wiener Filtering Algorithm
The Wiener filtering algorithm is an estimation algorithm in the sense of minimum mean square error. Assuming that
( )
y t is noisy speech, which consists of clean speech and additive noise [6], namely:
( ) ( ) ( )
y t =x t +d t (1) Simultaneous Fourier transform on both sides:
( , ) ( , ) ( , )
Y k j =X k j +D k j (2) among them, Y k j( , ), X k j( , ) , D k j( , ) are the amplitude
spectrum representation of the time domain signal in the frequency domain at the jth frame and kth frequency bin, respectively. After a Wiener filtering with a gain function is:
( , )
1 ( , )
k j H
k j
ξ ξ
=
+ (3)
the enhanced speech spectrum:
( )
,( ) ( )
, ,X k j H k j Y k j
∧
= ⋅ (4)
where, ξ( , )k j is a priori estimate of the k th spectral component, H k j( , )is the gain function corresponding to the
spectral, X( )k j, ∧
is the enhanced speech amplitude spectrum.
Research in the literature [7] shows: the speech intelligibility was influenced by gain bias overestimated
significantly, while the intelligibility was not affected when the gain function underestimated in the positive SNR regions. Loizou et al. evaluates the effects of two speech distortions introduced by the gain functions and draw important conclusions through several sets of experiments: amplification distortion occurring when the enhanced speech amplitude spectrum is over-estimated, and attenuation distortion occurring when the enhanced speech amplitude spectrum is under-estimated [1]. Researches by Loizou et al. have shown that the effects of the two distortions on speech intelligibility are different. Attenuation distortion has less effect on speech intelligibility, and when the amplification distortion is smaller than 6 dB, the performance of speech intelligibility in a stationary noise environment was nearly unaffected. One reason that existing speech enhancement algorithms do not improve speech intelligibility is to allow amplification distortion in excess of 6 dB [1]. In addition, the signal-to-noise ratio also has over-estimated and under-estimated errors. The experimental results show that the SNR estimation error has different influence on the intelligibility of enhanced speech in different regions [6]. The overestimation of the a priori SNR does more damage to the speech intelligibility if the SNR is less than-10dB while in other region the underestimation of the a priori SNR has less effect on the speech intelligibility.
( )
,( )
, X k j X k j ∧≤ (5)
Region II, in this region, existing amplification distortion ranges from 0 to 6 dB, and the region formula as follows:
( )
,( )
, 2( )
,X k j X k j X k j
∧
≤ ⋅
< (6)
Region III, in this region, the amplification distortion in excess of 6 dB [5], the region formula as follows:
( )
, 2( )
,X k j X k j
∧
> ⋅ (7)
The above content shows that the speech intelligibility is significantly improved with the limitation of regions I+II, and declined after the limitation of region III. Combining regions I and II as I+II constraint:
( ) ( ), ( ) ( ) , 2 , , , , 0 M if
k j k j X k
k j
e e j
ls
X X X
∧ ∧
∧
= ≤
(8)
It can be seen from the above formula that the speech amplitude spectrum of the region III is all set to zero under ideal conditions, which was judged by making a comparison with the original clean speech.
3. The Improved Speech Enhancement
Algorithm
3.1. The ImprovedAlgorithm in Region III
In the real application, there is no original clean speech for comparison to make a judgment in region III. Therefore we make the following improvements by estimating a priori SNR and gain function to determine the range: In region III, the enhanced magnitude spectrum is as follows:
( )
, 2( )
,X k j X k j
∧
> ⋅ (9)
Squared on both sides:
( )
{
( )}
2
2
4
, ,
E X k j E X k j
∧ > ⋅
(10)
substituteX k j( , ) H k j( , )(X k j( , ) D k j( , )) ∧
= i + into equation(10):
( ) ( )
{
2 2}
{
2( ) 2( )}
{
( )2}
, , , , 4 ,
E H k j ⋅X k j +E H k j ⋅D k j > E X k j (11)
( ) ( ) ( ) ( ) ( )
2 2 2 2 2
, , , , 4 ,
H k j ⋅X k j +H k j ⋅D k j > X k j (12)
( ) ( ) ( ) ( )2
2 2 2
, , , 4 ,
H k j ⋅X k j +D k j > X k j (13)
( ) ( ) ( ) ( ) 2 2 2 2 4 , , , ,
X k j H k j
X k j +D k j
> (14)
( ) ( ) ( ) ( ) 2 2 2 2 , , , , 4 X k j D k j H k j
X k j +
>
⋅ (15)
( )
2 1
( , ) 1 4
,
H k j
k j
ξ∧
⋅ + >
(16)
Therefore the gain function of the amplification distortion greater than 6dB is:
2 ( , )
( , )
( , ) 1
4 k j
H k j
k j ξ ξ ∧ ∧ > + (17)
The amplifying distortion region of magnitude spectrum greater than 6 dB can be determined by a priori SNR and gain function in (17), The T-F units falling in Region III is equivalent to have the amplification distortion in excess of 6 dB and should take measures to eliminate it. The experiments of the same article also shows that attenuation distortions had a minimal effect on speech intelligibility
3.2.Two Hypothetical Conditions to Carry Out Simulation
Experiments
Lety n( )=x n( )+d n( )denote the noise signal, x n( )andd n( )
representing the clean speech and noise signals, respectively. Giving short time Fourier transforms of the equation then we get [7]:
( )
k( )
k( )
kY ω = X ω +D ω (18)
Expressing the equation (18) in polar form [7]:
( ) ( ) ( )
y x d
j k j k j k
k k k
Y eθ = X eθ +D eθ (19)
where {Yk,Xk,Dk}denote the magnitudes and {θy( )k ,θx( )k ,
( )
d k
θ }denote the phases at frequency bin k of the noise speech, clean speech, and noise, respectively. The MMSE estimator of the short-time power spectrum proposed by Wolfe and Godsill[7] as follows:
( )
{
2}
2
k k
k
X E X Y ω
∧ =
( )
(
)
2 0 kk X k k k
X f X Y ω dX
∞ =
∫
2 1 1 1 k k kk k k
Y ξ ξ ξ γ ξ = + + +
(20)
2 2 ( ) ( ) x k d k k σ ξ σ ≡ , 2 2 ( ) k k d Y k γ σ
≡ , (21)
2 2
( ) { }
x k E Xk
σ ≡ , 2 2
( ) { }
d k E Dk
σ ≡ (22)
k
ξ andγk denotes the a priori SNR and a posteriori SNR,
respectively. That’s above derivation is the MMSE estimator. Bring (20) into equation (17) and find the range of the gain function where the amplification distortion greater than 6dB is: 1 4 1 k k k ξ
γ + +ξ > (23)
So that the whole gain function is:
( ) ( ) 2 2 , , , 1 , 4 1 1 0 4 1 k k k k k k
M k j X
X k j ξ
γ ξ ξ γ ξ ∧ ∧ = + ≤ + + > + (24)
The gain function of this range is helpful for improving speech intelligibility in theory.
Assuming that x n( )andd n( )are uncorrelated stationary random processes, Py( )ω denotes the sum of the power spectra of the clean speech and noise [7, 8].
( ) ( ) ( )
y x d
P ω =P ω +P ω (25)
The above assumption is based on statistical sense. Approximating the power spectrum by using the magnitude-squared spectrum and rewriting the equation (25) as follows:
2 2 2
k k k
Y ≈ X +D (26)
we are referring to 2
k
Y ,Xk2and
2
k
D as the magnitude-squared
spectra of the noisy, clean and noise signals, respectively. Using the Bayes’ rule as follows can get the posterior probability density of the clean speech magnitude-squared spectrum:
(
)
2(
( )
) ( )
2 22
2 2
2 2 2
2
k k
k
k k k
k k k
Y X
X
k Y
X Y
f Y X f X
f
f Y
= (27)
Computing the mean of the posteriori density [9]in equation (27) and obtain the MMSE estimator
:
(
)
2 2 2
k k k
X E X Y
∧
=
( )
2
2
2 2 2 2
0 2 1 1 1 k k k Y
k X k k k
k k
X f X Y dX
Y eν ν = = − −
∫
(28)Bring (28) into equation (17) and find the range of the gain function where the amplification distortion greater than 6dB is:
( )
( )
4 1 1 1 , , 1 k k e k j k j ν ν ξ ξ ∧ ∧ − > − + (29)
So that the whole gain function is:
( )
( )
( )
( )
( )
( )
, 2 2 , , 4 , , , 1 4 , 0 , 1 1 1 1 1 1 1 k k k M k k j X k jX k j
k j k j k j e e ν ν ξ ξ ξ ξ ν ν ∧ ∧ ∧ ∧ ∧ ∧ = + + − ≤ − − > − (30)
We believe that the gain function of this range is also helpful for improving speech intelligibility.
Specific experimental steps for modified algorithm to test and verify the speech intelligibility [10]:
1. Take four kinds of speech and four kinds of noise in MATLAB speech noise library, and experiment in four kinds of signal-to-noise ratio environments;
2. Using two kinds of speech spectrum estimated by MMSE estimator;
3. Calculate the a priori SNR according to the "decision-directed " method [11];
4. Obtain the modified gain function according to the formula (9);
5. Obtaining the enhanced amplitude spectrum according to equation (4);
6. The area where the speech amplitude spectrum is distorted more than 6dB is limited by the formula (17).
4. Experimental Results and Analysis
In order to verify the usability of the modified algorithm proposed by Loizou et al., using IEEE consonants and sentences as corpus for clean speech [11], The noise signal is White, Pink, Babble, F16 in the NOISEX-92 database. The clean speech signal and the noise signal were recorded at a sampling rate of 8 kHz, the quantization precision was 16 bits and the signal was 20ms per frame during processing with 50% overlap. The test condition of the modified algorithm is that 4 kinds of clean speech signals and 4 kinds of noise signals, which are respectively in 4 kinds of SNR environments(0dB、5dB、10dB、15dB) with two different
estimated speech amplitude spectrum. Calculating the average value of objective intelligibility evaluation(LSD、
STOI、PESQ) by MATLAB simulation tool.
with the ideal state of Loizou. The objective evaluation criteria [13] are Log-Spectral Distance (LSD), Short-Time
Objective Intelligibility (STOI) and Perceptual Evaluation of Speech Quality (PESQ).
Table 1. The comparison of LSD data of three algorithms.
Noise type Input SNR Output LSD average
Ideal algorithm Amplitude spectrum1 Amplitude spectrum2
White
0 dB 3.5012 4.5591 4.3298
5 dB 3.1295 3.8193 3.7771
10 dB 2.9418 3.3358 3.4365
15 dB 2.8721 3.7822 3.2717
Pink
0 dB 3.4998 4.8410 4.5800
5 dB 3.1595 4.0251 3.9238
10 dB 2.9296 3.4163 3.4768
15 dB 2.8881 3.0785 3.2931
Babble
0 dB 3.4550 4.6033 4.4583
5 dB 3.0959 3.8898 3.8521
10 dB 2.9406 3.3642 3.4953
15 dB 2.8817 3.0333 3.2807
F16
0 dB 3.4085 4.5055 4.2789
5 dB 3.0051 3.7667 3.7039
10 dB 2.8796 3.2799 3.3655
15 dB 2.8728 2.9867 3.2148
Table 2. The comparison of STOI data of three algorithms.
Noise type Input SNR Output STOI average
Ideal algorithm Amplitude spectrum1 Amplitude spectrum2
White
0 dB 0.8299 0.6440 0.6311
5 dB 0.8718 0.7448 0.7344
10 dB 0.9091 0.8215 0.8129
15 dB 0.9330 0.8720 0.8674
Pink
0 dB 0.8385 0.6409 0.6199
5 dB 0.8741 0.7414 0.7277
10 dB 0.9070 0.8184 0.8086
15 dB 0.9297 0.8713 0.8631
Babble
0 dB 0.8342 0.6310 0.6180
5 dB 0.8743 0.7394 0.7282
10 dB 0.9067 0.8209 0.8119
15 dB 0.9323 0.8747 0.8686
F16
0 dB 0.8503 0.6424 0.6291
5 dB 0.8874 0.7440 0.7341
10 dB 0.9184 0.8254 0.8157
15 dB 0.9384 0.8768 0.8716
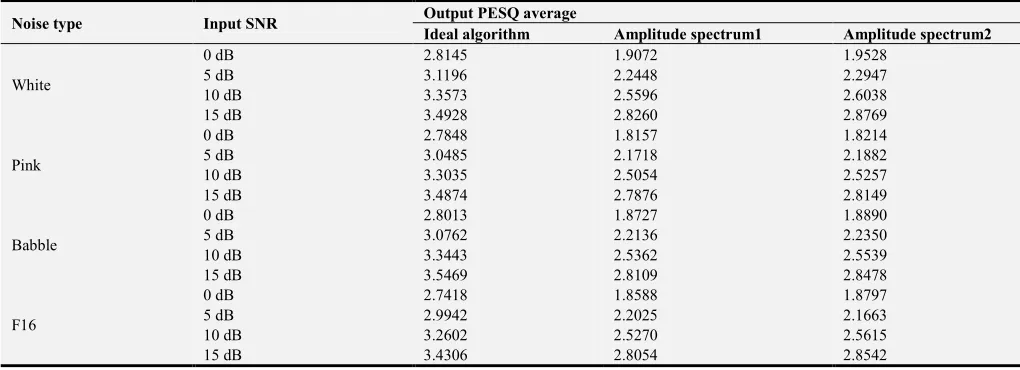
Table 3. The comparison of PESQ data of three algorithms.
Noise type Input SNR Output PESQ average
Ideal algorithm Amplitude spectrum1 Amplitude spectrum2
White
0 dB 2.8145 1.9072 1.9528
5 dB 3.1196 2.2448 2.2947
10 dB 3.3573 2.5596 2.6038
15 dB 3.4928 2.8260 2.8769
Pink
0 dB 2.7848 1.8157 1.8214
5 dB 3.0485 2.1718 2.1882
10 dB 3.3035 2.5054 2.5257
15 dB 3.4874 2.7876 2.8149
Babble
0 dB 2.8013 1.8727 1.8890
5 dB 3.0762 2.2136 2.2350
10 dB 3.3443 2.5362 2.5539
15 dB 3.5469 2.8109 2.8478
F16
0 dB 2.7418 1.8588 1.8797
5 dB 2.9942 2.2025 2.1663
10 dB 3.2602 2.5270 2.5615
15 dB 3.4306 2.8054 2.8542
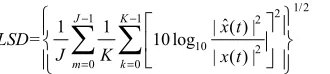
Table 1 shows the results of analysis using Log-Spectral Distance. The LSD indicates the degree of closeness between
1/2 2
1 1 2
10 2
0 0
ˆ
1 1 | ( ) |
= 10 log
| ( ) |
J K
m k
x t LSD
J K x t
− −
= =
∑ ∑
(31)
From the equation, while the algorithm with LSD value small, the enhanced speech is closer to the original speech [14], and it presents a better enhancement effect.
As can be seen from the table 1, at 0dB and 5dB SNR, LSD value of amplitude spectrum2 smaller than amplitude spectrum1, so that amplitude spectrum 2 with modified algorithm is closer to the original speech. At 10dB and 15dB SNR, LSD value of amplitude spectrum1 smaller than amplitude spectrum2, the situation is exactly the opposite of the former. In F16 noise [15], amplitude spectrum1 and amplitude spectrum2 all have smaller LSD value than the other noise types. Under the same background noise, the higher the SNR, the closer the enhanced speech is to original speech.
Table 2 shows the results of analysis using Short-Term Objective Intelligibility. STOI is an indicator for evaluating enhanced speech intelligibility [12]. In addition, the value range of STOI is small, generally between 0 and 1, so only a small amount of speech is needed to obtain the required data, which is convenient and fast, and it has become the preferred measure of objective evaluation criteria. While the algorithm with STOI value large, the intelligibility of the speech is high, and it presents a well performance of the improved algorithm.
As can be seen from the table 2, at all SNR environments, STOI value of amplitude spectrum1 is larger than amplitude spectrum2, so that amplitude spectrum1 with modified algorithm is closer to the ideal state. Little difference in STOI values under different background noises.
Table 3 shows the results of Perceptual Evaluation of Speech Quality. The PESQ is an indicator that uses the overall loudness error of the estimated clean speech and the enhanced speech to judge the overall quality of the output speech. The expression of PESQ is as follows:
0 1 ind 2 ind
PESQ=a +a D +a A (32)
Among them, a0 =4.5, a1= −0.1, a2= −0.0309. The range of PESQ is between−0.5 ~ 4.5. While the algorithm with a large value of PESQ, the voice quality is favorable.
As can be seen from the table 3, at all SNR environments, PESQ value of amplitude spectrum2 larger than amplitude spectrum1, Amplitude spectrum2 with modified algorithm is closer to the ideal state, and under the same background noise, the higher the SNR, the better the enhanced speech quality. In White noise,amplitude spectrum1 and amplitude spectrum2 all have larger PESQ value than the other noise types.
In most cases, we usually use Wiener filtering noise-reduction algorithm to process the noise-damaged speech and the gain-induced distortion is limited to one of three areas: Region I involving only attenuation distortion, Region II involving only amplification distortion below 6 dB, and Region III including amplification distortion in excess of
6dB. Generous improvements in intelligibility, relative to noise-corrupted speech, were acquired when the noise-suppressed speech included only attenuation distortion. In the case where the attenuation and amplification distortion exist simultaneously, if the amplification distortion is less than 6 dB, significant intelligibility can be obtained.
5. Conclusion
This paper refers to the research results of predecessors and introduces the reason that existing algorithms do not improve speech intelligibility is because they allow amplification distortions in excess of 6dB. Therefore, eliminating the amplification distortion in exceed of 6dB or at least properly controlled it. Due to the lack of clean speech in reality, the experiments of Loizou et al. cannot be applied to the real situation. This paper uses the amplitude spectrum under two hypothetical conditions to carry out simulation experiments, and compares the results with the ideal state, we find the speech intelligibility has indeed improved through the objective evaluation index of speech intelligibility, and the improvement of the methods has been successfully applied to reality. In recent years, deep neural network algorithms have also been applied to the field of speech enhancement [16]. Speech enhancement algorithms based on improved speech intelligibility also have good development prospects [17, 18]. It should be more effective to identify and eliminate amplification distortions greater than 6 dB. In future research, we can consider combining speech intelligibility with deep neural network algorithms to estimate a priori SNR and distortion regions that affect intelligibility accurately [19-21], so as to obtain clean speech with better quality and intelligibility.
Acknowledgements
This work is supported by the Natural Science Foundation of Shandong Province (No. ZR2017MF008).
References
[1] G. Kim and P. Loizou, “Gain-induced speech distortions and the absence of intelligibility benefit with existing noise-reduction algorithms,” Acoustical Society of America, vol. 130, 2011, pp. 1581-1596.
[2] T. Baer, B. Moore, and S. Gatehouse, “Spectral contrast enhancement of speech in noise for listeners with sensorineural hearing impairment: Effects on intelligibility, quality and response times,” J. Rehab. Res. Dev. Vol (30), 1993, pp. 49–72.
[3] J. Alcantar, B. Moore, V. Kuhnel, and S. Launer, “Evaluation of the noise reduction system in a commercial digital hearing aid,” Int. J. Audiol, vol. (42), 2003, pp. 34–42.
[5] F. Chen and P. Loizou, “Impact of SNR and gain-function over-and under-estimation on speech intelligibility,” Speech Communication, vol. 54, 2012, pp. 272-281.
[6] P. Loizou, Speech Enhancement: Theory and Practice. Boca Raton: Florida, CRC Press LLC, 2007, pp. 97-99.
[7] P. Loizou and G. Kim, “Reasons why current speech- enhancement algorithms do not improve speech intelligibility and suggested solutions,” IEEE Trans. Audio, Speech, Lang. Process, vol. 19 (1), 2011, pp. 47-56.
[8] L. Yang and P. Loizou,“Estimators of the Magnitude-Squared Spectrum and Methods for Incorporating SNR Uncertainty”, Senior Member, IEEE, vol. 19 (5), 2011, pp1123-1137. [9] R. Martin, “Noise Power Spectral Density Estimation based on
Optimal Smoothing and Minimum Statistics,” IEEE Transactions on Speech and Audio Processing, vol. 9(5), 2001, pp. 504-512.
[10] P. J. Wolfe and S. J. Godsill, “Efficient alternatives to Ephraim and Malah suppression rule for audio signal enhancement,” EURASIP J. Appl. Signal Process, vol. 10, 2003, pp. 1043– 1051.
[11] Guo Lihua and Ma Jianfen, “Improved Wiener filtering speech enhancement algorithm with high intelligibility,” Computer applications and software, vol. 31 (11), 2014, pp. 155-157. [12] Chen Chen, Gao Ying and Liu Wei. “Comparative Analysis of
Priori SNR Estimation Algorithms in Single Channel Speech Enhancement,” Circuits and Systems, vol. 7 (2), 2018, pp. 25-35.
[13] IEEE Subcommittee, “IEEE Recommended Practice for Speech Quality Measurements,” IEEE Trans. Audio and Electro acoustics, vol. 17 (3), 1969, pp. 225-246.
[14] Y. Lu and P. Loizou, “Speech enhancement by combining statistical estimators of speech and noise,” in Proceedings of IEEE International Conference on Acoustics, Speech, Signal Processing, 2010, pp. 4754–4757.
[15] Y. Hu and P. Loizou, “Subjective comparison and evaluation of speech enhancement algorithms,” Speech Commun, 2007, vol. 49, pp. 588–601.
[16] F. Gelderblom, T. Tronstad and E. Viggen, “Subjective Evaluation of a Noise-Reduced Training Target for Deep Neural Network-Based Speech Enhancement,” IEEE/ACM Transactions on Audio Speech and Language Processing, vol. 27 (3), 2019, pp. 583-594.
[17] C. Tan and B. Moore, “Perception of nonlinear distortion by hearing-impaired people,” Int. J. Audiol. 2008, vol. 47, pp. 246–256.
[18] S. Rangachari and P. Loizou, “A noise-estimation algorithm forhighly non-stationary environments,” Speech Commun. 2006, vol. 48, pp. 220–231.
[19] Y. Hu and P. Loizou, “A comparative intelligibility study of single-microphone noise reduction algorithms,” J. Acoust. Soc. Am, 2007, vol. 122, pp. 1777–1786.
[20] I. Cohen, “Noise Estimation by Minima Controlled Recursive Averaging for Robust Speech Enhancement”, IEEE Signal Processing Letter, vol. 9 (1), 2002, pp. 12-15.