SYNTHESIS, CHARECTERIZATION, DEVELOPMENT
AND VALIDATION OF RP-HPLC METHOD FOR
PROCESS RELATED IMPURITY IN NIMODIPINE BULK
AND FORMULATION
LUBNA SHAIKH1, VISHAL PANDE2, DEEPAK MUSMADE3
1
.Research Scholar, Department of Quality Assurance Techniques2.Associate Professor and Head, Department of Pharmaceutics and Quality Assurance Techniques
3.Assistant Professor, Department of Pharmaceutical Chemistry, Sanjivani College of Pharmaceutical Education and Research, Kopargaon, Ahmednagar, Maharashtra, India.
E-mail: [email protected]
Date Received:
28-May-2015
Date of Accepted:
18-Jun-2015
Date Published:
30-Jun-2015
207
Abstract:
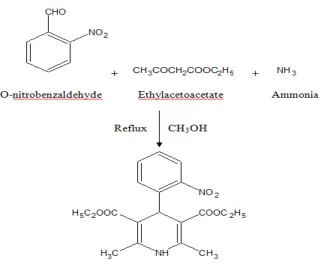
The synthesis, characterization and quantitation of process related impurity in Nimodipine i.e.Diethyl 2, 6-dimethyl-4-(2-nitrophenyl)-1, 4-dihydropyridine-3, 5-dicarboxylate bulk and tablet formulation was performed by using Hantzch pyridine synthesis. This synthesis includes o-nitrobenzaldehyde, ethylacetoacetate in presence of ammonia and methanol as catalyst. The percentage yield was found to be 79%. The impurity was recrystallized and preliminary evaluation was done on lab scale viz. Melting point, TLC and elemental analysis. The melting point of impurity was found to be 156-1580C. The TLC of impurity was carried out by using benzene and methanol (6:1) and the Rf was found to be 0.78 the conformation of synthesized Nimodipine impurity was carried out by using sophisticated instrument such as, FT-IR, NMR, GC-MS, and RP-HPLC method was developed to identify and quantify the Nimodipine impurity in bulk and formulation as per ICH Q2B guidelines. The method was found to be linear, precise, accurate, robust and rugged. Finally 1, 4-Dihydro-2, 6- Dimethyl-4-(o-nitrophenyl) pyridine-3, 5 dicarboxylate(Nimodipine Impurity) was quantified from bulk Nimodipine and its marketed tablet formulation. It was concluded that the amount of Nimodipine impurity, present in tablet was found to be 0.0876%and in bulk 0.0219% respectively.
Keywords: Impurity, IR, NMR, GC-MS, RP-HPLC, Validation.
Introduction
Chemically, Nimodipine is known as Isopropyl 2-methoxy ethyl 1, 4- Dihydro2, 6-dimethyl-4-(3-nitrophenyl)pyridine-3, 5-dicarboxylate.[1]It is a dihydropyridine calcium channel blocker and used for the treatment of high blood pressure. During the manufacturing process of an active pharmaceutical substance or product, some intermediates are formed. These intermediates may affect the safety and efficacy issues of the pharmaceutical products.[2]Pharmaceutical impurities are the unwanted chemicals that remain with
According to ICH, the maximum daily dose qualification threshold is considered as follows; ≤2g/day 0.1% or 1mg per day intake (whichever is lower) ≥ 2g/day 0.05 %[6]
Materials and Methods
Chemicals: O-nitrobenzaldehyde (AR), Ethylacetoacetate (AR), Ammonia (AR), Methanol(AR), Acetonitrile (HPLC grade), Methanol (HPLC grade), Water (HPLC grade) were purchased from Merck chemicals, India.
Method
UV- Visible Spectrophotometer
The UV detection at wavelength 234 nm was selected by using UV- Vis Spectrophotometer (UV- 1650 PC) SHIMADZU INC.
FT-IR
The IR spectra were recorded by using Fourier Transform Infrared spectrophotometer by KBr press pellet technique.
NMR
Characterization of impurities was achieved by NMR using CDCL3 as a solvent. The 1H and 13C NMR chemical shift values were reported on the delta scale in ppm.
GC-MS
The Q- TOF Micro mass (YA-105) spectrometer capable of recording High Resolution Mass Spectrum (HRMS) both in atomic pressure chemical ionization (APCI) and Electron spray Ionization (ESR) were used for characterization of Nimodipine impurity.
RP-HPLC
The HPLC method was developed by using LC20AD
Prominence Liquid Chromatography SPD 20-A
Shimadzu, Japan. The UV- Vis detector and C18 column with dimension on 250x 4.6 mm was used for the HPLC method Development having flow rate of 0.8 ml/min at wavelength 234 nm. The Methanol:Acetonitrile: Water (35:40:25v/v/v) as a mobile phase was selected for development of validated method of Nimodipine impurity and various parameters according to ICH guidelines (Q2B) were studied.
Chromatographic Conditions- Preparation of Mobile Phase
The selection of mobile phase was according to polarity & non polarity of solvents. The methanol: acetonitrile: water was selected as mobile phase in ratio of 35:40:25(v: v: v) and was filtered on membrane filter (0.45µ) to remove degassing.
Preparation of Stock Solution
The stock solution of 100µg/ml was prepared by
dissolving 10mg Nimodipine impurity in 100 ml mobile
phase. The dilution was prepared in various
concentrations using stock solution and dissolved in mobile phase.
Preparation of Sample Solution (Formulation) The sample solution of Nimodipine formulation was prepared as 100µg/ml stock solution for concentration using sample stock and dissolved in mobile phase for quantification of Nimodipine impurity in Nimodipine formulation.
Procedure
1.52 gm of o- nitrobenzaldehyde and 2.60 ml of ethylacetoacetate were added in round bottom flask. Then 5 ml of ammonia and 15 ml of methanol was added and stir vigorously. Refluxed for 5-6 hrs and the solution was poured in ice cold water and kept for overnight in freezer. Filtered at vaccum filter and recrystallized from Methanol.
Results and Discussion Physicochemical properties: UV Data[7, 8]
The λmax for Nimodipne impurity was found to be 234nm. Calibration curve data was constructed in the range of 2-18 µg/ml. Beer’s law was obeyed over this concentration range. The correlation coefficient (R2) was found to be 0.994. The regression equation Y= 0.053x + 0.035 was found to be linear.
IR Data
The major functional groups are primary amine, nitro and carbonyl groups. Obtained peaks in IR spectrum are as follows.
IR (KBr) cm-1: 3327(NH-Stretch), 2937, 2978, 3078(C-H Stretch for aromatic), 2802, 2874(C-3078(C-H Stretch for aliphatic), 1683(C=O Stretch), 1610(C=C Stretch), 1487, 1529(N-O Stretch), 1452(CH3 Bend), 1357(NO2 Stretch), 900-700(Oop), 833(Substitution at ortho position of benzene ring).[9, 10]
NMR Data
1HNMR (CDCL 3)
δ = 5.830(1H,NH of 1,4-dihydropyridine),
1.159(6H,CH3 of 1,4-dihydropyridine), 4.066 (4H,CH2 proton of ester), 2.303(6H,CH3 proton of ester), 6.498(1H, CH of 1,4-dihydropyridine ring), 7.283(2H, CH of nitrobenzene ring), 7.689(2H, CH of nitrobenzene ring). [10]
13CNMR (CDCL 3)
209
132.75(2C, C=C of 1,4- dihydropyridine ring), 34.41(1C, Carbon of 1,4- dihydropyridine), 147.49(6C, Carbon of phenyl ring).[10]
GC-MS Data
Gas Chromatography of Nimodipine Impurity shows a single peak at 26.62 min which indicates purity of synthesized Nimodipine Impurity. Mass spectrum at 26.62 minwas recorded. Peak appear at 374 indicates presence of molecular ion peak. Major base peak at 357 shows 100% abundance.[11, 12]
HPLC Method Development
Validation experiment was performed to demonstrate system suitability, linearity, precision, accuracy study, ruggedness and robustness as per ICH Q2B guidelines.
System Suitability Parameters
The area of respective concentrations, theoretical plates, number of theoretical plates per cm, Tailing factor and the peak symmetry was recorded.
Linearity
Dilution of standard impurity in the range of 2-12µg/ml were prepared by taking suitable aliquots of working standard solution in different 10ml volumetric flasks and diluting up to the mark with mobile phase. 20µl was injected from it each time on column at flow rate of 0.8ml/min. The standard from elute was monitored at 234 nm and corresponding chromatogram were obtained from these chromatograms peak area were calculated. A plot of peak area over concentration was constructed. Regression of the plot was computed by least square regression method.
Precision
Precision of analytical method was studied by multiple injections of homogeneous samples. 6 replicate of 4 ppm solution were prepared and injected for precision at the same flow rate of 0.8ml/min. The inter-day and intermediate precisions were used to study the variability of the method S.D. and %R.S.D. was calculated for both.
Accuracy
Accuracy of the method was studied using the method of standard addition. Standard impurity solutions were added to the unknown bulk and tablet formulation of Nimodipine. The percent recovery was determined at three different levels (50%, 100%, and 150%). Impurity content was determined and the percent recovery was calculated.
Robustness
Robustness was studied by changing parameters like change in flow rate. The S.D. and %R.S.D. between the change parameter were calculated.
Ruggedness
Ruggedness studied was carried out by using different analysts. The S.D. and %R.S.D. were calculated.
LOD and LOQ
Limit of detection and limit of Quantitation of the method was calculated by formula given below,
LOD= 3.3×S.D/Slope LOQ=10×S.D./Slope
Quantitation of Impurity
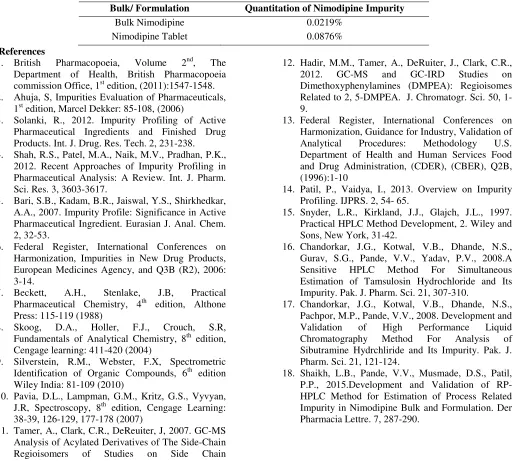
The total amount of impurity present in Nimodipine bulk and formulations was calculated for synthesized compound and the result was compared to ICH limit for impurities in new drug substance is 0.1%.[13-18]
Conclusion
The synthesis of process related impurity of Nimodipine was successfully carried out by suitable synthetic procedure. The preliminary evaluation was done on laboratory scale such as melting point, TLC, and elemental analysis. The characterization of synthesized impurity was performed by IR, 1HNMR, 13CNMR and GC-MS. Based on the spectral data, the structure of impurity was characterized as diethyl 1, 4- dihydro-2, 6- dimethyl-4(o-nitro phenyl) pyridine-3, 5 dicarboxylate. An efficient isocratic RP-HPLC method was developed and validated to identify and quantify the process related impurity in Nimodipine bulk and formulation. The method was found to be linear, precise, specific, sensitive and accurate. The amount of impurity present in tablet and bulk was found to be 0.0876% and 0.0219% respectively. Thus, it was found that the impurity was found to be within the limit laid down as per ICH guidelines (not more than 0.1%). Thus from the present study we can conclude that impurity profiling may act as a prominent quality control tool in pharmaceutical analysis of API.
Acknowledgement
Authors wish to express their sincere thanks to Principal, SRES’s Sanjivani College of Pharmaceutical Education
and Research Kopargaon, for his constant
Synthesis of Nimodipine Impurity
Figure 1 Scheme for Synthesis of Nimodipine Impurity
Table 1 Physicochemical Properties of Nimodipine Impurity
Molecular
Formula
Molecular
Weight
M.P.
oC
Rf Values
%Yield
C
19H
22N
2O
6374
156-158
0.78
79%
211
Figure 3: HPLC Chromatogram of Nimodipine Impurity
Figure 4: HPLC Chromatogram of Nimodipine Impurity and Nimodipine Mixture
Figure 6: HPLC Chromatogram of Nimodipine Impurity and Tablet Mixture
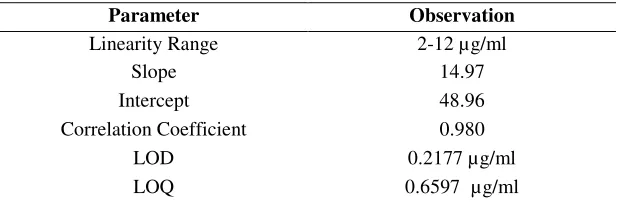
Table 2 Linearity Data of Nimodipine Impurity.
Parameter Observation
Linearity Range 2-12 µg/ml
Slope 14.97
Intercept 48.96
Correlation Coefficient 0.980
LOD 0.2177 µg/ml
LOQ 0.6597 µg/ml
Table 3 Result of Repeatability Studies.
Parameter SD %RSD
Precision 0.987 0.824
Intraday Precision 0.901 0.755
Interday Precision 1.279 1.046
Robustness 1.970 0.467
Ruggedness
Table 4 Result Accuracy Study of Nimodipine impurity.
Drug/ Formulation
Amount of Drug (µg/ml)
Amount of Impurity
Added (µg/ml)
Amount Recovered
(µg/ml)
Percentage Recovery
Mean SD %RSD
4 2(50%) 5.82 97
Bulk 4 4(100%) 7.89 98.62 98.27 1.140 1.160
4 6(150%) 9.92 99.2
4 2(50%) 5.87 97.83
Tablet 4 4(100%) 7.91 98.87 98.73 0.843 0.854
213
Table 5: System Suitability Parameters.
Property Values Official limits
Retention time (tR) 8.530 -
Theoretical plates (N) 4614 N≥ 2000
Resolution (R) 4.310 R≥ 2
Tailing factor (T) 0.96 T≤ 2
Table 6: Quantitation of Nimodipine Impurity in Bulk and Tablet.
Bulk/ Formulation Quantitation of Nimodipine Impurity
Bulk Nimodipine 0.0219%
Nimodipine Tablet 0.0876%
References
1. British Pharmacopoeia, Volume 2nd, The
Department of Health, British Pharmacopoeia commission Office, 1st edition, (2011):1547-1548.
2. Ahuja, S, Impurities Evaluation of Pharmaceuticals,
1st edition, Marcel Dekker: 85-108, (2006)
3. Solanki, R., 2012. Impurity Profiling of Active Pharmaceutical Ingredients and Finished Drug Products. Int. J. Drug. Res. Tech. 2, 231-238.
4. Shah, R.S., Patel, M.A., Naik, M.V., Pradhan, P.K.,
2012. Recent Approaches of Impurity Profiling in Pharmaceutical Analysis: A Review. Int. J. Pharm. Sci. Res. 3, 3603-3617.
5. Bari, S.B., Kadam, B.R., Jaiswal, Y.S., Shirkhedkar,
A.A., 2007. Impurity Profile: Significance in Active Pharmaceutical Ingredient. Eurasian J. Anal. Chem. 2, 32-53.
6. Federal Register, International Conferences on
Harmonization, Impurities in New Drug Products, European Medicines Agency, and Q3B (R2), 2006: 3-14.
7. Beckett, A.H., Stenlake, J.B, Practical
Pharmaceutical Chemistry, 4th edition, Althone Press: 115-119 (1988)
8. Skoog, D.A., Holler, F.J., Crouch, S.R,
Fundamentals of Analytical Chemistry, 8th edition, Cengage learning: 411-420 (2004)
9. Silverstein, R.M., Webster, F.X, Spectrometric
Identification of Organic Compounds, 6th edition Wiley India: 81-109 (2010)
10. Pavia, D.L., Lampman, G.M., Kritz, G.S., Vyvyan, J.R, Spectroscopy, 8th edition, Cengage Learning: 38-39, 126-129, 177-178 (2007)
11. Tamer, A., Clark, C.R., DeReuiter, J, 2007. GC-MS
Analysis of Acylated Derivatives of The Side-Chain
Regioisomers of Studies on Side Chain
Regioisomers of
4-Methoxy-3-Methyl-Phenylamines Related to Methylene
dioxymethamphetamine. J. Chromatogr. Sci. 45, 477-485.
12. Hadir, M.M., Tamer, A., DeRuiter, J., Clark, C.R.,
2012. GC-MS and GC-IRD Studies on
Dimethoxyphenylamines (DMPEA): Regioisomes Related to 2, 5-DMPEA. J. Chromatogr. Sci. 50, 1-9.
13. Federal Register, International Conferences on
Harmonization, Guidance for Industry, Validation of
Analytical Procedures: Methodology U.S.
Department of Health and Human Services Food and Drug Administration, (CDER), (CBER), Q2B, (1996):1-10
14. Patil, P., Vaidya, I., 2013. Overview on Impurity Profiling. IJPRS. 2, 54- 65.
15. Snyder, L.R., Kirkland, J.J., Glajch, J.L., 1997. Practical HPLC Method Development, 2. Wiley and Sons, New York, 31-42.
16. Chandorkar, J.G., Kotwal, V.B., Dhande, N.S.,
Gurav, S.G., Pande, V.V., Yadav, P.V., 2008.A
Sensitive HPLC Method For Simultaneous
Estimation of Tamsulosin Hydrochloride and Its Impurity. Pak. J. Pharm. Sci. 21, 307-310.
17. Chandorkar, J.G., Kotwal, V.B., Dhande, N.S.,
Pachpor, M.P., Pande, V.V., 2008. Development and
Validation of High Performance Liquid
Chromatography Method For Analysis of
Sibutramine Hydrchliride and Its Impurity. Pak. J. Pharm. Sci. 21, 121-124.