R E S E A R C H
Open Access
Evaluation of a guided continuous quality
improvement program in community
pharmacies
Chanadda Chinthammit
1*, Michael T. Rupp
2, Edward P. Armstrong
1,3, Tara Modisett
4, Rebecca P. Snead
4and Terri L. Warholak
1,3Abstract
Background:The importance of creating and sustaining a strong culture of patient safety has been recognized as a critical component of safe medication use. This study aims to assess changes in attitudes toward patient safety culture and frequency of quality-related event (QRE) reporting after guided implementation of a continuous quality improvement (CQI) program in a panel of community pharmacies in the United States (U.S.).
Methods:Twenty-one community pharmacies volunteered to participate in the project and were randomly assigned to intervention or control groups. Pharmacy staff in the intervention group received guided training to ensure full implementation of a CQI program while those in the control group partially implemented the program. Pharmacy staff in both groups completed retrospective pre-post safety culture questionnaires and reported medication errors and near misses that occurred in their practices. Rasch analysis was applied to assess questionnaire validity and reliability and to confirm if the ordinal level data approximated interval level measures. Paired t-tests and repeated measure analysis of covariance tests were subsequently used to compare observed changes in the attitudes of subjects and frequency of QREs reporting in intervention and control groups.
Results:Sixty-nine employees completed the questionnaire, a 43.9% response rate. Improvement in attitudes toward patient safety was statistically significant in the intervention group in six domains: staff, training, and skill (p= 0.017); patient counseling (p= 0.043); communication about mistakes (p< 0.001); response to mistakes (p< 0.001); organizational learning–continuous improvement (p< 0.001); and overall patient safety perceptions (p= 0.033). No significant differences were observed in QRE reporting rates between intervention and control groups. However, differences were observed in the types of QREs reported (e.g., incorrect safety cap) and the point in the prescription processing workflow where a QRE was detected (e.g., partner check station, and drug utilization review station) in the intervention group (p< 0.001).
Conclusion:Guided CQI program implementation increased the self-reported patient safety culture attitudes among staff.
Keywords: Patient safety, Quality improvement, Incident reporting and analysis, Safety culture, Rasch model, Pharmacies
* Correspondence:[email protected]
1Department of Pharmaceutical Sciences, College of Pharmacy, University of Arizona, Tucson, AZ, USA
Full list of author information is available at the end of the article
Background
In its 1999 report, To Err is Human: Building a Safer Health System, the U.S. Institute of Medicine (IOM) highlighted the need for a cultural change in how health care organizations and providers approach medical and medication errors [1]. This call heightened error aware-ness and made patient safety an issue of concern for all healthcare providers and institutions. In the years since the IOM report was issued, many quality improvement programs have been implemented to reduce the inci-dence of medication errors [1–7]. A study conducted in Canadian community pharmacies found that implemen-tation of continuous quality improvement (CQI) resulted in improvements in 7 key areas that are known to be systems-based sources of medication errors including: patient information; drug information; communication of drug orders; drug labeling and packaging; and drug standardization and distribution [7].
Beyond such targeted strategies, the importance of creating and sustaining a strong culture of patient safety has been recognized as a critical component of safe medication use [8, 9]. A culture of patient safety refers to the beliefs, values and norms regarding how members of an organization should behave and in-cludes policies, procedures and processes to improve quality and safety [10–12]. CQI process use is central to creating a culture of patient safety within health-care organizations [13]. Thus, the CQI philosophy must be embraced throughout the organization and a systematic CQI program must be implemented to analyze the causes of medication errors and to create strat-egies to prevent future errors [13]. However, this can-not happen unless the organization has a successful, sustainable safety culture.
Pharmacy Quality Commitment (PQC™) is a standard-ized, 5-step CQI program that was developed to assist pharmacy staff to document, monitor and analyze quality-related events (QREs), determine their likely cause(s) and implement changes to prevent future QREs [14]. The term QRE includes both errors (i.e., mistakes that reach the patient) and near misses that occur in the pharmacy (i.e., mistakes caught before they reach the patient).
During the past decade in the U.S., some states have adopted laws requiring pharmacies to implement quality assurance programs [15]. Given this trend, it is reasonable to ask how implementation of quality assurance programs like PQC™ affects the achieve-ment of desired objectives. Specifically, the objective of this study was to assess the effect of full, guided implementation of the CQI program on: 1) safety culture attitudes; 2) incidence of reported medication QREs when compared to partial self-implementation by pharmacy staff.
Methods
Design and participants
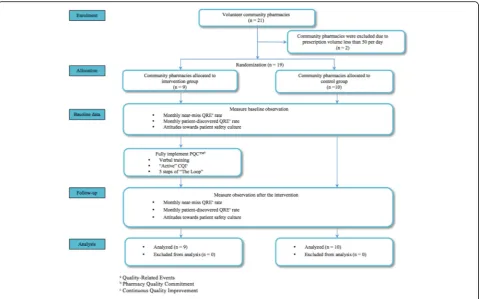
This randomized, controlled, parallel-group study was conducted in 21 volunteer community pharmacies in the United States. The pharmacies volunteered because their staff wished to learn how to more fully implement their CQI program. The pharmacies in the sample were ran-domized into intervention and control groups (Fig. 1). Intervention pharmacies were provided a training session to facilitate full program implementation (Steps 1–5 as de-scribed below) while control pharmacies continued their standard practice, which included only Steps 1 and 2.
Step 1.“Establish and Communicate Work Flow” -pharmacies adopt best practices and standardized workflow guidelines.
Step 2.“Collect QREs”- pharmacies implement use of standardized forms and instructions for QRE tracking and are able to access a private, secure, online system for quick documentation.
Step 3.“Analyze QREs and Process Breakdowns” -data entered into the online reporting portal in Step 2 are analyzed. The portal helps the user convert the pharmacy’s data to CQI intelligence that can be interpreted by safety managers and easily presented to the pharmacy’s staff by assisting with performance of detailed analytics and production of illustrative charts/graphs.
Step 4.“Formulate Plan for Improvement”- CQI intelligence gleaned from previous steps are used as the basis for developing actionable improvement plans.
Step 5.“Implement New Process with Training”- the plans from the previous step are implemented and benchmarks are established to measure success.
Prior to the study, all pharmacies in this study routinely utilized Steps 1 and 2 of the CQI cycle but had not formally operationalized Steps 3–5.“Standard prac-tice” was therefore defined as reporting QREs daily but not completing the other portions of the CQI cycle.
Components of the intervention (i.e., training session)
The pharmacy managers and staff who were responsible for risk management in the intervention pharmacies attended a training session presented by the study’s primary investigator who was well trained in quality improvement and risk management area. In addition, two faculty members who were specialized in the same area and a practice community pharmacist reviewed the training materials and course. Over a period of 2 weeks, the designated risk manager at each pharmacy trained their pharmacists and staff to fully implement the 5-step PQC™system. The training session was developed using
the Dick and Carey instructional design model, a systematic approach that embraces interaction among instructors, learners, materials, learning activities, deliv-ery system, and learning and performance environments and brings them to work together to achieve learning outcomes [16]. All training materials were reviewed by educational and CQI experts before delivery and based on their recommendations revisions were made before training subjects.
The intervention involved training the pharmacy staff to operationalize all 5 steps on the PQC™cycle workflow [14] during four face-to-face sessions (see session I to IV as described below).
Session I. Overview of PQC: how to use the PQC™ program to analyze the error data and interpret the results from graph and bar charts as well as how to use daily PQC™process related event report form to facilitate root cause analysis during the peer review process to diagnose the possible causes of QREs.
Session II. Analysis of QREs and procedures: Step 3 and error reduction strategies to handle different types of safety issues (e.g., standardization, double checks, reminder & checklists).
Session III. How to formulate plan for improvement: Step 4 and how to train pharmacists and pharmacy staff effectively and monitor the new process.
Session IV. New processes implementation with training: Step 5. This session also included a mock peer review meeting during which participants role played leading their team in conducting a root cause analysis.
Data collection
Data were collected between July and August 2014. The study measured two types of QREs; those detected by the pharmacy staff before the medication reached the patient (i.e., “near misses”) and those discovered after the patient left the pharmacy with the medication (i.e.,
“error”). All QRE data were reported via the PQC™ reporting portal to Alliance for Patient Medication Safety (APMS) which is a Patient Safety Organization (PSO). The Daily PQC™ process related events report form was used for data collection. Data were transferred to the researchers in a de-identified format. No pharmacy-specific identifiers and no specific patient or provider identifiers were used in reporting.
A week prior to study initiation, the primary investiga-tor visited each pharmacy to explain the study expecta-tions and request informed consent from participants. At this time the paper-based safety culture attitudinal questionnaires were distributed which were subsequently collected at the end of the study. The Agency for Healthcare Research and Quality’s (AHRQ) Pharmacy
Survey on Patient Safety Culture was modified into a retrospective pre-post format and used to assess changes in pharmacy patient safety culture [17]. Pharmacists and pharmacy technicians in both intervention and control pharmacies were asked to complete the questionnaire. The questionnaire was divided into 5 sections covering 11 domains including: physical space and environment; teamwork, staff training and skills; communication openness; patient counseling; staffing, work pressure and pace; communication about prescription across shifts; response to mistakes; organizational learning – quality improvement; and overall perception of patient safety [17]. The university-based Institutional Review Board approved the study protocol.
Data analysis
The first main outcome measure of interest in this pro-ject was the change in self-reported pharmacy staff atti-tudes toward patient safety culture. Rasch analysis was used to evaluate questionnaire, scale and item perform-ance [18] and reliability was also assessed using Cron-bach’s alpha. The Wolf and Chui method for pre-post analysis was used to account for construct shift bias where pre to post attitudinal responses were converted via Rasch analysis into interval level data (scores) for each person where the data fit the model [18]. These scores were used as the dependent variable in paired t-tests and repeated measure analysis of covariance (ANOVA) for each domain [19, 20] to compare the ference between the two groups. The standardized dif-ference eq. (Z scores) was used to identify gaps in item difficulties (content gaps). Winsteps software (3.80.1: Linacre JM, Beaverton, OR, U.S.A.) was used for Rasch analyses.
The second outcome measure of interest was the change in QRE reporting rates (i.e., number of QREs per dispensed prescriptions) between pharmacies in the intervention and control groups. The outcome was com-pared using ANOVA. SAS statistical packages were uti-lized for data management and analyses. For all tests, an alpha of 0.05 was selected a priori.
Results
Attitude toward patient safety culture
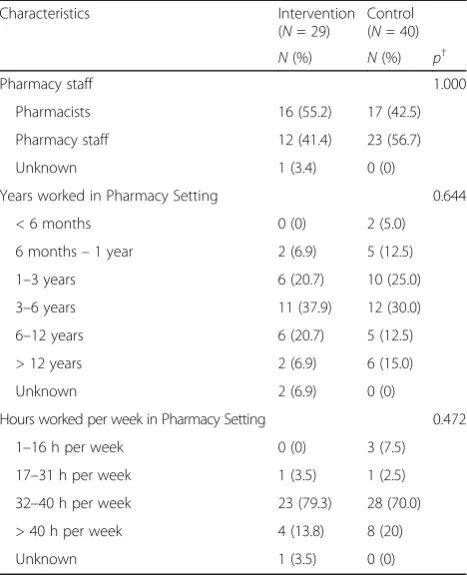
Out of 157 staff working in the pharmacies, 112 (71.3%) responded to the retrospective pre-post Patient Safety Culture questionnaire. However, 69 (43.9%) respondents completed both pre- and post-intervention sections of the questionnaire. Respondent demographics are pre-sented in Table 1. The preliminary questionnaire assess-ment indicated that the “negative” and “neutral” scale options were rarely utilized. Therefore, in order to optimize scale functionality, the categories of “disagree” and “strongly agree” and “rarely” and “never” were
collapsed. The scale functioning for most domains met the requirement of category utilization after collapsing.
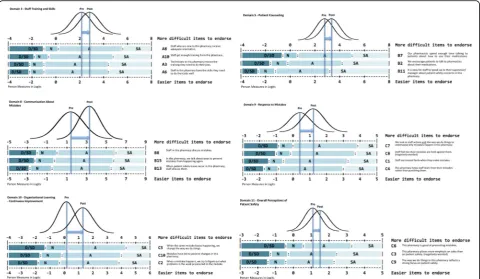
Most of the items from the 11 domains fit the Rasch model requirements in both pre- and post-intervention periods. However, content gaps were identified between items (standardized scores [i.e., Z-scores] outside 2 and −2) in either pre- or post-intervention period. In Domain3 “Staff Training and Skills,” for instance, a content gap was identified between item A8 “Staff who are new to this pharmacy receive adequate orien-tation” (mean = 0.89, standard error = 0.22) and item A10 “Staff get enough training from this pharmacy” (mean = −0.11, standard error = 0.26) with a Z-score of 2.93. Additional information is available as an Additional file 1. Cronbach’s alpha for domains ranged from 0.76 to 1.00.
Statistically significant pre-post improvements in atti-tude toward patient safety culture were found among intervention pharmacies for Domain 3 “Staff, Training, and Skill” (p = 0.017), Domain 5 “Patient Counseling” (p = 0.043), Domain 8 “Communication about Mistake” (p< 0.001), Domain 9“Response to Mistakes”(p< 0.001), Domain 10 “Organizational Leaning-Continuous Improvement” (p < 0.001), and Domain 11 “Overall Perception of Patient Safety” (p = 0.033) (Fig. 2). In contrast, none of the domain scores changed significantly
Table 1Baseline characteristics of respondents
Characteristics Intervention
(N= 29)
Control (N= 40)
N(%) N(%) p†
Pharmacy staff 1.000
Pharmacists 16 (55.2) 17 (42.5)
Pharmacy staff 12 (41.4) 23 (56.7)
Unknown 1 (3.4) 0 (0)
Years worked in Pharmacy Setting 0.644
< 6 months 0 (0) 2 (5.0)
6 months–1 year 2 (6.9) 5 (12.5)
1–3 years 6 (20.7) 10 (25.0)
3–6 years 11 (37.9) 12 (30.0)
6–12 years 6 (20.7) 5 (12.5)
> 12 years 2 (6.9) 6 (15.0)
Unknown 2 (6.9) 0 (0)
Hours worked per week in Pharmacy Setting 0.472
1–16 h per week 0 (0) 3 (7.5)
17–31 h per week 1 (3.5) 1 (2.5)
32–40 h per week 23 (79.3) 28 (70.0)
> 40 h per week 4 (13.8) 8 (20)
Unknown 1 (3.5) 0 (0)
†pvalues were computed using Fisher’s Exact tests
in the control group. Additional information is presented in Table 2.
Quality-related event reporting
Baseline QRE characteristics were collected during the 30-day pre-intervention period. Analysis indicated that the rate of reported QREs in the intervention and control groups did not change significantly after the intervention. Nonetheless, the pattern of reporting did change in the intervention group. In the intervention group, where QREs were detected and where they occurred changed from pre- to post-intervention (p< 0.001). Post-hoc analysis identified that more QREs were identified at the “Partner check” and less in the
“DUR” station after the intervention in the intervention group (p < 0.001). The analysis also revealed that QREs were reported to occur more in “Assembly of the pre-scription/filling” (p = 0.003) and less in “intervention” (i.e., QREs that require pharmacists to contact pre-scribers for clarification due to suspected error found in prescriptions) in the intervention group after the inter-vention (p = 0.006). In contrast, the pattern of QRE reporting did not change in the control group.
Discussion
Guided implementation of the full CQI program im-proved intervention group respondent attitudes related
to patient safety culture in six domains: staff, training, and skill; patient counseling; communication about mistakes; response to mismistakes; organizational learning -continuous quality improvement; and overall patient safety perceptions. Communication is a necessary com-ponent of reporting QREs and the very first stage of blameless culture. Therefore, perception about commu-nication changed first as it was easier to change in the time frame allotted. It is not surprising when the domain
‘Response to Mistakes’ changed faster because, during training, the researchers emphasized a shameless and blameless approach that focused on systems rather than individuals. The result that domains “Response to Mistakes,” “Organizational Learning – Continuous Im-provement,” and “Overall Perception of Patient Safety” changed together is consistent with the fact that they were suspected to share the same latent trait as revealed by factor analysis [21]. The change in percieved safety culture in the intervention group is important because it reflects how well the pharmacy staff in the intervention group adopt the CQI philosophy which is the foundation for implementing a successful CQI program to investi-gate the causes of medication errors and creating stra-tegic plan to prevent future errors [9, 13].
Although no changes in QRE reporting rates were observed after the intervention, a change in the pattern of QRE reporting was detected after the implementation
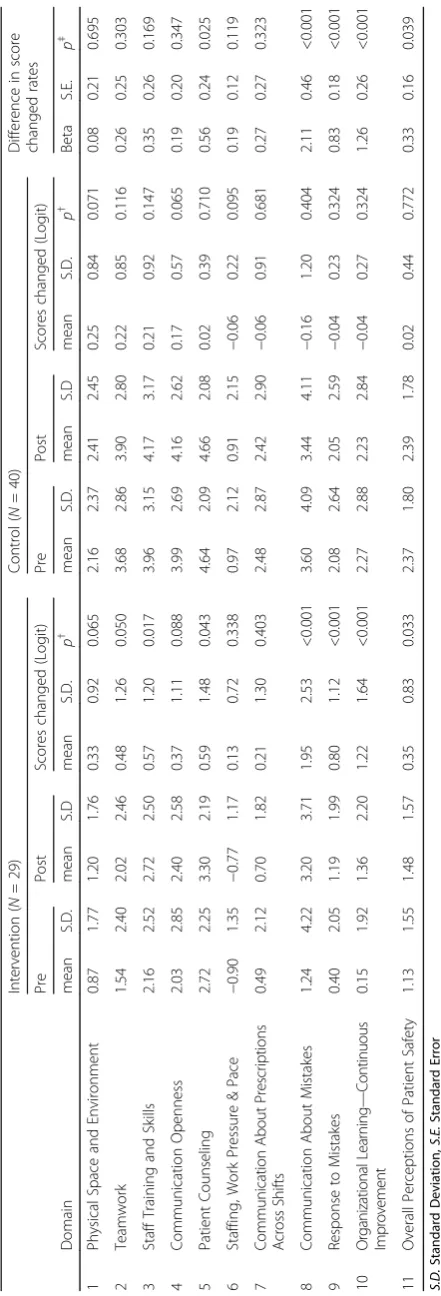
Table 2 Change in attitude toward patient safety culture score and difference in score in intervention and control groups Inte rvention ( N = 29) Con trol ( N = 40) Differe nce in sco re chang ed rates Pre Post Sco res chang ed (Logit) Pre Post Score s chang ed (Log it) D omain me an S.D . mean S.D me an S. D. p † mean S.D. mean S.D me an S.D . p † Beta S.E. p ‡ 1 Phy sical Space and Enviro nment 0. 87 1.77 1.20 1.76 0. 33 0. 92 0.06 5 2.16 2.37 2.41 2.45 0.25 0. 84 0.07 1 0.08 0.21 0.69 5 2 Te amwork 1. 54 2.40 2.02 2.46 0. 48 1. 26 0.05 0 3.68 2.86 3.90 2.80 0.22 0. 85 0.11 6 0.26 0.25 0.30 3 3 Staf f Training and Skil ls 2. 16 2.52 2.72 2.50 0. 57 1. 20 0.01 7 3.96 3.15 4.17 3.17 0.21 0. 92 0.14 7 0.35 0.26 0.16 9 4 Co mmuni cation Openn ess 2. 03 2.85 2.40 2.58 0. 37 1. 11 0.08 8 3.99 2.69 4.16 2.62 0.17 0. 57 0.06 5 0.19 0.20 0.34 7 5 Pat ient Couns eling 2. 72 2.25 3.30 2.19 0. 59 1. 48 0.04 3 4.64 2.09 4.66 2.08 0.02 0. 39 0.71 0 0.56 0.24 0.02 5 6 Staf fing, Work Press ure & Pace − 0.90 1.35 − 0. 77 1.17 0. 13 0. 72 0.33 8 0.97 2.12 0.91 2.15 − 0.06 0. 22 0.09 5 0.19 0.12 0.11 9 7 C ommunica tion About P re scr iptio n s Acro ss Shi fts 0. 49 2.12 0.70 1.82 0. 21 1. 30 0.40 3 2.48 2.87 2.42 2.90 − 0.06 0. 91 0.68 1 0.27 0.27 0.32 3 8 Co mmuni cation About Mi stakes 1. 24 4.22 3.20 3.71 1. 95 2. 53 <0.0 01 3.60 4.09 3.44 4.11 − 0.16 1. 20 0.40 4 2.11 0.46 <0.00 1 9 Re sponse to Mist akes 0. 40 2.05 1.19 1.99 0. 80 1. 12 <0.0 01 2.08 2.64 2.05 2.59 − 0.04 0. 23 0.32 4 0.83 0.18 <0.00 1 1 0 O rga niz atio n al Lea rni ng — Continuous Imp rovement 0. 15 1.92 1.36 2.20 1. 22 1. 64 <0.0 01 2.27 2.88 2.23 2.84 − 0.04 0. 27 0.32 4 1.26 0.26 <0.00 1 11 O verall Pe rceptions of Patien t Safety 1. 13 1.55 1.48 1.57 0. 35 0. 83 0.03 3 2.37 1.80 2.39 1.78 0.02 0. 44 0.77 2 0.33 0.16 0.03 9 S.D. Standard Deviation, S.E. Standard Error
†p-values
were
computed
using
paired
t-test
‡p-values
were computed using repeated measures analysis of covariance
(i.e., one month after the intervention). While it was hypothesized that after a full CQI implementation inter-vention groups would demonstrate increased QRE reporting due to better training on how to identify, analyze and prevent mistakes, the rate of QREs reported did not significantly increase in either the control or intervention groups. This result is not entirely unex-pected because in another study investigating the impact of a CQI program it took at least one year to see a dem-onstrable impact of a CQI program in community phar-macies [22]. Therefore, the change in pattern of QRE reporting might indicate that the pharmacy staff ana-lyzed their QREs and made changes to procedures (as was intended by full PQC™implementation).
In addition, while more QRE reporting was expected after full PQC™ implementation perhaps the main im-pact will be a change in themixof QREs andhow phar-macy staff members deal with them. While it was usual practice for all pharmacies in this study to record QREs, more than recording is needed to improve quality. That is, intervention group members were trained to not only record QREs, but to then use this information to determine their common problems and to begin to solve some systems issues. Thus, staff members may take ac-tion to correct the system and this may, in turn, change the mix of QREs reported as some may be addressed and others may appear. More work is needed to investi-gate what actions pharmacy staff members take to fix er-rors, as these were not directly measured in this study.
Several limitations of this study should be noted. First, this study included only a small number of community pharmacies. Therefore, the results may not be generalizable to other settings or to a particular area of the country. Second, it is important to note that although the usual practice in the study pharmacies was to only complete the first 2 steps of the CQI program, it is not necessarily indica-tive or reflecindica-tive of the pharmacies in the CQI program. The volunteer pharmacies wanted to improve their per-formance by fully implementing a CQI program. This could be because they have learned about their QREs trends from the PSO feedback (e.g. newsletters, recommendations) and might have had realized that focused training and getting assistance in more robustly operationalizing their program could be helpful and obtained through participating the study. Third, the followup time (2 months) may not have been long enough to detect the impact of a full CQI imple-mentation on either QREs or patient safety attitudes [23]. Forth, there was the risk of comtamination that control pharmacy staff may accidentally learned about the interven-tion since the pharmacies were part of a corporate chain and they all were the PSO’s clients. It was possible that con-tamination occurred through the personal communication from the intervention pharmacists to the control pharma-cists or when a pharmacist floated from a treatment to a
control pharmacy or vice versa. However, the risk of con-tamination was minimized by the guided implementation setup including: 1) the guided implementation was pro-vided from the study’s primary investigator; and 2) the training took several hours for intervention pharmacists to be trained in the intervention and only intervention phar-macists received this in-person intensive training. Therefore it was unlikely that the intervention was transmitted through communication between treatment and control pharmacy groups. Even if contamination happened between groups, we were still able to detect a signifi-cant improvement in attitude toward safety culture in some domains in the intervention while there was no change in the control group. Thus, the change in the treatment group could have been greater if the con-tamination was completely prevented.
Conclusion
The results of this randomized control study suggest that guided implementation of a full CQI program sig-nificantly improved self-reported patient safety culture attitudes among pharmacy staff. Additional continuous quality improvement studies in community pharmacies are warranted to assess full impact of safety culture and CQI processes on error rates.
Additional file
Additional file 1:Rasch item Fit Statistics. (DOCX 121 kb)
Abbreviations
AHRQ:Agency for Healthcare Research and Quality; ANOVA: Analysis of covariance; APMS: Alliance for Patient Medication Safety; CQI: Continuous quality improvement; DUR: Drug utilization review; IOM: Institute of Medicine; PQC™: Pharmacy Quality Commitment; PSO: Patient Safety Organization; QRE: Quality-related event; SE: Standard error
Acknowledgements
Not applicable.
Funding
This study was self-funding.
Availability of data and materials
The data that support the findings of this study are available from Alliance for Patient Medication Safety but restrictions apply to the availability of these data, which were used under license for the current study, and so are not publicly available. Data are however available from the authors upon reasonable request and with permission of Alliance for Patient Medication Safety.
Authors’contributions
Concept and design were performed by CC, MTR, EPA, TA, RPS, and TLW. Data were collected by CC, TA, and RPS. Data were interpreted by CC, MTR, EPA, and TLW. CC, MTR, and TLW wrote the manuscript with help from EPA, TA, and RPS. The manuscript was revised by MTR, TLW, TA, and RPS. All authors read and approved the final manuscript.
Ethics approval and consent to participate
Consent for publication
All authors have consented to the publication of this journal.
Competing interests
The authors declare that they have no competing interests.
Publisher’s Note
Springer Nature remains neutral with regard to jurisdictional claims in published maps and institutional affiliations.
Author details 1
Department of Pharmaceutical Sciences, College of Pharmacy, University of Arizona, Tucson, AZ, USA.2Department of Pharmacy Practice, College of Pharmacy, Midwestern University, Glendale, AZ, USA.3Department of Pharmacy Practice and Science, College of Pharmacy, University of Arizona, Tucson, AZ, USA.4Alliance for Patient Medication Safety, Richmond, VA, USA.
Received: 2 May 2017 Accepted: 29 August 2017
References
1. Kohn LT, Corrigan JM, Donaldson MS, editors. To err is human: building a safer health system. Washington: National Academies Press; 2000. 2. Halbesleben JR, Rathert C. The role of continuous quality improvement and
psychological safety in predicting work-arounds. Health Care Management Rev. 2008;33:134–44.
3. Fields M, Peterman J. Intravenous medication safety system averts high-risk medication errors and provides actionable data. Nurs Adm Q. 2005;29:78–87. 4. Harding AD. Increasing the use of‘smart’pump drug libraries by nurses: a
continuous quality improvement project. Am J Nurs. 2012;112:26–35. 5. Lee SB, Lee LL, Yeung RS, Chan JTA. Continuous quality improvement project
to reduce medication error in the emergency department. World J Emerg Med. 2013;4:179–82.
6. Sarfati L, Ranchon F, Vantard N, Schwiertz V, Gauthier N, He S, et al. SIMMEON-prep study: SIMulation of medication errors in ONcology: prevention of antineoplastic preparation errors. J Clin Pharm Ther. 2015;40:55–62. 7. Boyle TA, Ho C, MacKinnon NJ, Mahaffey T, Taylor JM. Safety implications of
standardized continuous quality improvement programs in community pharmacy. J Pharm Pract. 2013;26:228–36.
8. Singer SJ, Gaba DM, Falwell A, Lin S, Hayes J, Baker L. Patient safety climate in 92 US hospitals: differences by work area and discipline. Med Care. 2009;47:23–31.
9. Ginsburg L, Gilin Oore D. Patient safety climate strength: a concept that requires more attention. BMJ Qual Saf. 2016;25:1–8.
10. Sorra JS, Dyer N. Multilevel psychometric properties of the AHRQ hospital survey on patient safety culture. BMC Health Serv Res. 2010;10:199. 11. Reason J. Achieving a safe culture: theory and practice. Work & Stress.
1998;12:293–306.
12. Guldenmund FW. The nature of safety culture: a review of theory and research. Saf Sci. 2000;34(1):215–57.
13. Bishop A, Fleming M, Flin R. Patient safety culture. In: Clarke S, Probst TM, Guldenmund F, Passmore J, editors. The Wiley Blackwell handbook of the psychology of occupational safety and workplace. Chichester: Wiley; 2015. p. 459–84. http://onlinelibrary.wiley.com/doi/10.1002/9781118979013.ch20/summary. 14. Alliance for Patient Medication Safety. Pharmacy quality commitment. A
continuous quality improvement program: Designed to reduce medication errors; 2011. p. 1–81.
15. Mazina N. Does your pharmacy comply with quality assurance requirements? In: Drug topics. 2015. http://drugtopics.modernmedicine. com/drug-topics/news/does-your-pharmacy-comply-quality-assurance-requirements?page=full. Accessed 1 Sept 2017.
16. Dick W, Carey L, Carey JO. The systematic design of instruction. 2005. 17. Sorra JS, Franklin M, Gray L, Streagle S, Dyer N, Smith S, et al. Development,
pilot testing, and psychometric analysis of pharmacy survey on patient safety. Culture. 2012;
18. Linacre JM. Investigating rating scale category utility. J Outcome Meas. 1998;3:103–22.
19. Warholak TL, Menke JM, Hines LE, Murphy JE, Reel S, Malone DCA. Drug-drug interaction knowledge assessment instrument for health professional students: a rasch analysis of validity evidence. Res Social Adm Pharm. 2011;7:16–26.
20. Handley LI, Warholak Jackson TL, Jackson TR. An evaluation of the validity of inferences made from 3 diabetes assessment instruments: a rasch analysis. Res Social Adm Pharm. 2008;4:67–81.
21. Aboneh EA, Look KA, Stone JA, Lester CA, Chui MA. Psychometric properties of the ahrq community pharmacy survey on patient safety culture: a factor analysis. BMJ Qual Saf. 2016;25:355–63.
22. Boyle TA, Bishop AC, Duggan K, Reid C, Mahaffey T, MacKinnon NJ, et al. Keeping the“continuous”in continuous quality improvement: exploring perceived outcomes of cqi program use in community pharmacy. Res Social Adm Pharm. 2013;10:45–57.
23. Boyle TA, MacKinnon NJ, Mahaffey T, Duggan K, Dow N. Challenges of standardized continuous quality improvement programs in community pharmacies: the case of safetynet-rx. Res Social Adm Pharm. 2012;8:499–508.
• We accept pre-submission inquiries
• Our selector tool helps you to find the most relevant journal
• We provide round the clock customer support
• Convenient online submission
• Thorough peer review
• Inclusion in PubMed and all major indexing services
• Maximum visibility for your research
Submit your manuscript at www.biomedcentral.com/submit