Improvement Of Solubility Of Cinnarizine By Using Solid Dispersion Technique
5
0
0
Full text
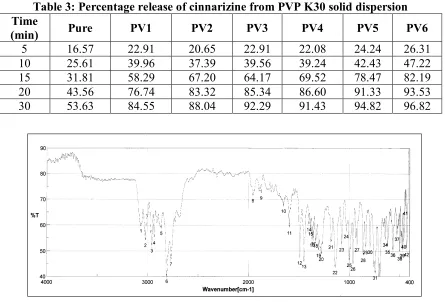
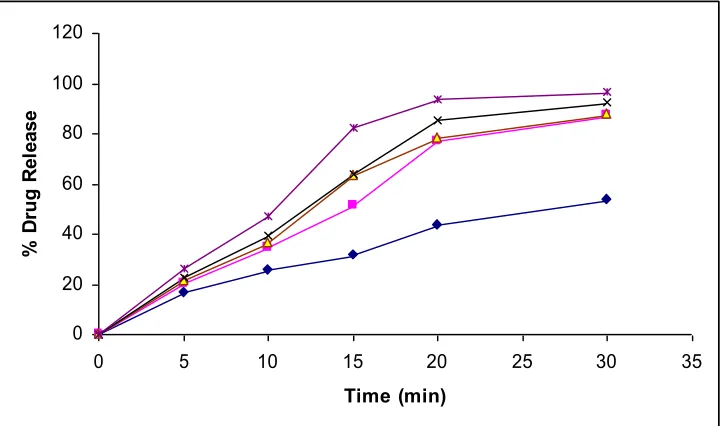
(2) Patel B et al. IRJP 1 (1) 2010 127-131 and the solution was incorporated into the melt of carrier (PEG 4000, PVP K30) at 165°, by pouring into it. It was kept in an ice bath for sudden cooling. The mass was kept in the desiccator for complete drying. The solidified mass was scrapped, crushed, pulverized, and passed through sieve no 80 mesh. Solid dispersions of drug with PEG 4000 and PVP K30 were prepared by solvent evaporation method. In this method, accurately weighed quantities of carriers (PEG 4000, PVP K30) in the stated proportions were carefully transferred into boiling test tubes, and dissolved in acetone. To these solutions, accurately weighed quantities of cinnarizine were added, and allowed to dissolve. The solution was transferred to a petridish, the solvent was allowed to evaporate at room temperature, and the dispersions were dried at room temperature for 1 h, and then dried at 65° for 6 h in a hot air oven. The mass obtained in each case was crushed, pulverized, and sifted through sieve no 80 mesh. Drug Content Analysis An accurately weighed quantity of solid dispersion equivalent to 100 mg cinnarizine was taken into 100 ml volumetric flask and shaken with 100 ml of 0.1N HCl. One ml was pipette out and than dilute up to 100 ml. Resulting solution was filtered and assayed at 253.5 nm using double beem UV/Vis spectrometer. Infrared Spectroscopy Solid dispersion of cinnarizine was characterized by infrared (IR) spectroscopy. Infrared spectra were recorded on a Jasco FT/IR 5300 infrared spectrophotometer, by using KBr disc method. The scanning range was 400 to 4000 cm -1 (figure 1). In vitro dissolution study The quantity of solid dispersions equivalent to 100 mg of cinnarizine, was filled in colorless hard gelatin capsule by the hand filling method.9 The drug-release study was carried out using a USP XXIV type-1 apparatus (Electrolab, TDT-06T, India) at 50 rpm using 900 ml of 0.1 N HCl as a dissolution medium. A sample (5 ml) of the solution was withdrawn from the dissolution apparatus at 5, 10, 15, 20 and 30 min and withdrawn volume was replaced with fresh dissolution media. The withdrawn samples filtered through a 0.45-micrometer membrane filter, diluted suitably, and analyzed spectrophotometrically. The concentration of cinnarizine in each sample was determined by using standard curve equation. RESULTS AND DISCUSSION Drug Content Estimation The drug content of cinnarizine solid dispersion was found to be in range 97.24 to 102.01 and these values are within the acceptable range. Low values of standard deviation in respect of with respect to drug content, indicate uniform drug distribution in all the solid dispersions of cinnarizine. Fourier Transform Infrared (FTIR) Spectroscopy IR spectra of cinnarizine and its binary systems with PVP K30 and PEG 4000 are presented in Figure 1. Pure cinnarizine spectra showed sharp characteristic peaks at 3040.9, 2808.2, 2765.7, 2678.9, 2341.4 and 1926.6 cm–1. All the above characteristic peaks appear in the spectra of all binary systems at same wavenumber indicating no modification or interaction between the drug and carrier. In vitro dissolution studies Cinnarizine release from the solid dispersion and alone was studied in 0.1 N HCl media up to 30 min. The average percentage release of the pure cinnarizine was found to be 53% in 30 min. In the solid dispersion formulation using Polyethylene glycol 4000 and polyvinyl pyrrolidone K30 as carrier, the dissolution rate increased with increased amount of carrier. The best results among solid dispersions with Polyethylene glycol 4000 were obtained from the formulation PE6 (Table 2) and Polyvinyl pyrrolidone K30 were obtained from formulation PV6 (Table 3) which is prepared by solvent evaporation method. Among all these formulation, PV6 is best due to higher dissolution rate that is 96.82% at 30 min (figure 2). The increased dissolution rate may be due to the higher solubility of PVP in dissolution medium and better wettability of cinnarizine. ACKNOWLEDGMENT The authors are grateful to Erica Pharma, Mumbai for providing gift sample of cinnarizine. The authors are. IRJP 1 (1) Dec 2010. Page 127-131.
(3) Patel B et al. IRJP 1 (1) 2010 127-131 also thanks to Signet Chemical Corporation, Mumbai for providing other ingredients for this work. REFERENCES 1) British Pharmacopoeia, Cinnarizine. The Stationery Office on behalf of the Medicines and Healthcare products Regulatory Agency (MHRA), 2001, 398- 400. 2) James EFR: Martindale, The extra Pharmacopoeia, Thirty-First edition, Royal Pharmaceutical Society, London, 1996, 406. 3) Cinnarizine: drug information, www.emc.medicines.org.uk, 2006. 4) Goldberg AH, Gibaldi M and Kanig JL. Increasing dissolution rates and gastrointestinal absorption of drugs via solid solutions and eutectic mixtures III - experimental evaluation of griseofulvin- succinic acid solid solution; J. Pharm. Sci., 1966, 55, 487-492 5) Hilton JE and summers MP. The effect of polyvinylpyrrolidones on intestinal ulceration caused by indomethacin Int. J. Pharm., 1986, 31, 157. 6) Najib MM, Suleiman M and Malakh AN. Characterization of a diflunisal polyethylene glycol solid dispersion system , Int. J. Pharm., 1986, 32, 229. 7) Rani G, Venkataramana D, Suryakumar J and Krishna DR. Solid dispersions of clofazimine with improved dissolution,Indian J. Pharm. Sci., 1993, 55, 61. 8) Patel DM, Shah RR and Jogani PD. Tablet formulation of piroxicam containing PVRK 30 and sodium lauryl sulphate ;Indian J. Pharm. Sci., 2004, 66, 49-55. 9) Modi A and Tayade P. Enhancement of Dissolution Profile by Solid Dispersion (Kneading) Technique; AAPS PharmSciTech.; 2006; 7 (3) 68. Table 1: Composition and batch code of solid dispersion of cinnarizine with carrier Ratio of drug Method of Drug Batch code Carrier and carrier preparation content (%) PE1 PEG 4000 1:1 Fusion 99.85 PE2 PEG 4000 1:2 Fusion 99.16 PEG 4000 1:3 Fusion 97.24 PE3 PE4 PEG 4000 1:1 Solvent evaporation 101.40 PEG 4000 1:2 Solvent evaporation 97.68 PE5 PE6 PEG 4000 1:3 Solvent evaporation 99.90 PV1 PVP K30 1:1 Fusion 100.05 PV2 PVP K30 1:2 Fusion 102.01 PV3 PVP K30 1:3 Fusion 97.92 PV4 PVP K30 1:1 Solvent evaporation 101.87 PV5 PVP K30 1:2 Solvent evaporation 100.43 PVP K30 1:3 Solvent evaporation 98.29 PV6 Table 2: Percentage release of cinnarizine from PEG 4000 solid dispersion Time Pure PE1 PE2 PE3 PE4 PE5 PE6 (min) 5 16.57 16.88 19.10 20.09 21.47 22.29 21.68 10 25.61 37.19 32.36 34.39 35.67 32.26 36.57 15 31.81 48.21 52.80 51.62 61.02 50.75 63.54 20 43.56 70.51 75.61 76.98 67.06 71.71 78.28 30 53.63 82.19 85.60 86.92 72.53 84.65 87.63. IRJP 1 (1) Dec 2010. Page 127-131.
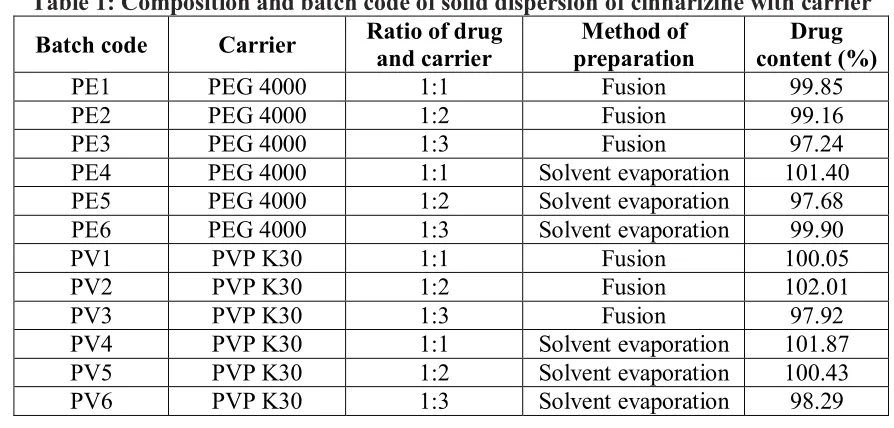
(4) Patel B et al. IRJP 1 (1) 2010 127-131. Table 3: Percentage release of cinnarizine from PVP K30 solid dispersion Time Pure PV1 PV2 PV3 PV4 PV5 PV6 (min) 16.57 22.91 20.65 22.91 22.08 24.24 26.31 5 10 25.61 39.96 37.39 39.56 39.24 42.43 47.22 15 31.81 58.29 67.20 64.17 69.52 78.47 82.19 43.56 76.74 83.32 85.34 86.60 91.33 93.53 20 30 53.63 84.55 88.04 92.29 91.43 94.82 96.82. Figure 1(A): IR spectra of pure cinnarizine. Figure 1(B): IR spectra of solid dispersion of cinnarizine and PEG 4000. IRJP 1 (1) Dec 2010. Page 127-131.
(5) Patel B et al. IRJP 1 (1) 2010 127-131. Figure 1(C): IR spectra of solid dispersion of cinnarizine and PVP K30. 120. % Drug Release. 100 80 60 40 20 0 0. 5. 10. 15. 20. 25. 30. 35. Time (min). Figure 2: %Drug release profile of pure drug (―♦―), for PE3 (―■―), for PE6 (―▲―), for PV3 (―Χ―) and for PV6 (―Ü ―) Source of support: Nil, Conflict of interest: None Declared. IRJP 1 (1) Dec 2010. Page 127-131.
(6)
Figure
Related documents
When these nations were divided into three groups, the median (range) HIV prevalence estimates remained constant at 0.7% (0.05 – 33.7%) and 0.75% (0.05% – 33.4%) for the lower
(2014) [ 63 ] QI + SQ (Hong Kong) Positive: Accessible/ efficient user-system interaction /interface; System flexibility and reliability. Negativ e: Impact on patient interaction
The subjects performed the exercise test on a modified kayak ergometer to enable power, oxygen up- take (VO2) as well as forces in the paddle and foot-rests to be
If shown to be effective, this balance program has the potential to improve the balance, mobility and function of future rehabilitation inpatients both at the study site and
Step 1 : The sensors placed in the field interfaced with the Arduino microcontroller sense real time values at user defined intervals and pass the sensed values to the
The first attempt, in 2001 [1] aimed at proving, that it was possible to reach a low root-mean-square (rms) deviation with respect to all experimental masses available at that
a ) For each training example, use the Euclidean distance metric to compute the Euclidean distances of it and the rest training examples. b ) Sort the
The Last Gentlemen: Southern Conservative Superfluity and the Work of William Alexander Percy, Walker Percy, and Peter Taylor.. William
