INTERCHANGES SAFETY: FORECAST MODEL BASED ON ISAT
ALGORITHM
Sascia Canale1, Natalia Distefano2, Salvatore Leonardi3
1, 2, 3 Department of Civil and Environmental Engineering, University of Catania, Italy
Received 16 November 2012; accepted 14 June 2013
Abstract: The ISAT algorithm (Interchange Safety Analysis Tool), developed by the Federal Highway Administration (FHWA), provides design and safety engineers with an automated tool for assessing the safety effects of geometric design and traffic control features at an existing interchange and adjacent roadway network. Concerning the default calibration coefficients and crash distributions by severity and type, the user should modify these default values to more accurately reflect the safety experience of their local/State agency prior to using ISAT to perform actual safety assessments. This paper will present the calibration process of the FHWA algorithm to the local situation of Oriental Sicily. The aim is to realize an instrument for accident forecast analyses, useful to Highway Managers, in order to individuate those infrastructural elements that can contribute to improve the safety level of interchange areas, if suitably calibrated.
Keywords: road intersections, analytic model, crash data, model calibration.
3 Corresponding author: [email protected]
1. Introduction
In recent years many studies on road infrastructure and more general on transportation systems make use of algorithms in order to optimize the choices of designers and operators. Such algorithms find application in various fields, from the environmental to that of road safety.
Dell’Acqua (2012) has used a fuzzy logic algorithm to justify highway alignment choices in environmental impact study analysis. The proposed procedure is a system for the “global evaluation” of all the useful elements for an accurate sensitivity analysis of the territory. The elements are implemented separately with different levels of assessment: 1) the degree of vulnerability of the macro area in
which the road infrastructure is to be situated, 2) the demands of homogenization, 3) the combination and comparison of different factors such as geomorphological aspects and landslide risk. The use of the procedure leads to the identification of the lower impact corridors, suitable for a highway design layout.
Tjahjono (2012) to know the motorcycle aspect as a base to implement an action program to reduce accident risks. The objectives of this research were to analyze motorcycle aspect on accident risks including tires, brakes, lamps, engines, chassis, mirrors, conspicuity, and equipments for riding.
Hasan (2012) proposes a probabilistic method for the identification of hazardous situations on the freeways. Three categories of data, i.e. traffic, weather and accident record data, were used for the analysis and modeling. In developing the crash risk probability model, classification tree based model was developed in this study. The formulated classification tree is able to identify the possible hazard and non-hazard situations on freeway.
The interchanges are generally the types of intersection with the highest levels of safety, especially because minimize the conflict points of crossing (or intersection). Nevertheless, also the intersections of this type have the critical aspects in terms of safety, which must be studied carefully. The most recent studies have made it possible to quantify the level of safety in correspondence of the various elements of the interchanges: entry lanes, exit lanes, ramps, terminals, intersections.
Chen et al. (2009) have evaluated the impacts of the number and arrangement of lanes on freeway exit ramps on the safety performance of freeway diverge areas. A comparison was conducted for comparing crash frequency, crash rate and crash severity between different types of freeway exit ramps. Crash prediction models were developed to identify the factors that contribute to the crashes reported at selected freeway segments and to provide quantified information regarding the safety impacts of different freeway exit ramps. It was found that the ramp and freeway AADT,
posted speed limit on freeway, deceleration lane length, right shoulder width, and the type of exit ramp significantly affected the safety performance of freeway diverge areas.
Chen et al. (2011) have evaluated safety performance of left-side off-ramps by comparing that of right-side off-ramps at freeway diverge areas. The comparisons indicate that the left-side off-ramp did have higher average crash counts, crash rate and percentage of severe crashes, but the difference is only statistically significant for the severe crashes at a 10% level. A crash prediction model for one-lane exit was developed to identify the factors that contribute to the crashes that have been reported for selected freeway segments.
Many studies report high accident rates on exit ramps with the highest percentage of crashes taking place in deceleration lanes. Calvi et al. (2012) describe the results of a driving simulator study that focused on driving performance while approaching a divergence area and decelerating during the exiting maneuver. The research results indicate there are considerable differences between the main assumptions of models generally used to design deceleration lanes and actual driving performance. In particular, diverging drivers begin to decelerate before arriving at the deceleration lane, causing interference with the main flow. Moreover, speeds recorded at the end of the deceleration lane exceed those for which the ramp’s curves are designed; this creates risky driving conditions that could explain the high crash rates found in studies of exit ramps.
conventional ones. Although either absolute speed or speed difference can be considered as a measure for speed consistency, few researches consider both in practice. Qu et al. (2013) have introduced the factor analysis method to extract an optimal number of factors from numerous original measures. The authors have identified two categories of factors: the first category is named “speed scale” reflecting the absolute speed, and the other one is named “speed dispersion” interpreting speed discreteness. The validation by comparing with previously developed measures shows that the proposed measure is acceptable in evaluating speed consistency.
Canale et al. (2009a) have shown that the safety requirements of the interchanges can be reduced significantly in correspondence of design elements such as ramps, entry lanes and terminals.
Canale et al. (2009b) also have suggested design criteria detailed in order to optimize the safety performance of the interchanges.
Bauer and Harwood (1998) have developed statistical models for defining the relationship between traffic accidents and highway geometric design elements and traffic volumes for interchange ramps and speed-change lanes. Data on other geometric design features, such as the ramp grades and horizontal curvature, were collected for a sample of ramps from aerial photographs and other existing highway agency files. The statistical modeling approaches used in the research included Poisson and negative binomial regression. The regression models developed, based on the negative binomial distribution, explained between 10 and 42% of the variability in the accident data, with the negative binomial distribution providing a poor to moderate fit to the data. However, most of that variability
was explained by ramp Annual Average Daily Traffic (AADT). Other variables found to be significant in some models included mainline freeway AADT, area type (rural/urban), ramp type (on/off), ramp configuration, and combined length of ramp and speed-change lane.
The tools for the prediction of road accidents can play an important role in order to highlight those elements of the interchanges that have accident rates very high and, therefore, potentially indicative of criticality associated with the geometry of the elements of the node.
The forecasting models can therefore help analysts to identify the causes of accidents and consequently to establish the appropriate corrective actions to increase the safety standards.
In this area of research, the ISAT software, developed by FHWA, can be used to predict the safety performance of design alternatives for new interchanges and prior to reconstruction of existing interchanges. According to Interchange Safety Analysis Tool (ISAT): User Manual, the primary outputs from an analysis include: the number of predicted crashes for the entire interchange area, the number of predicted crashes by interchange element type, the number of predicted crashes by year, and the number of predicted crashes by collision type.
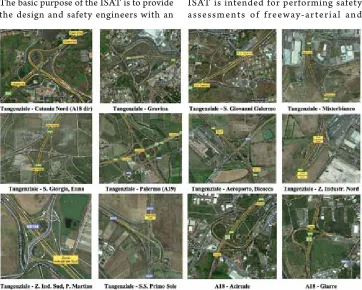
The aim of this paper is to calibrate the FHWA algorithm to the local situation. In this specific case, the investigation field is represented by the group of interchanges situated along two important road infrastructures of Oriental Sicily: the Highway A18 (Messina – Catania) and the By-pass link RA15, known as “Tangenziale Ovest of Catania”. This paper, at first, describes the work to define the calibration coefficients starting from the crash data relevant to “Tangenziale Ovest”. After, this paper checks the reliability of the model calibrated in this way, taking as reference the interchanges of the Highway A18 (Fig. 1).
2. Interchange Safety Analysis Tool (ISAT)
The basic purpose of the ISAT is to provide the design and safety engineers with an
automated tool to aid in assessing the safety effects of geometric features and traffic control options, along with traffic volumes, of an existing interchange and predicting the safety performance of a new interchange where no interchange previously existed. ISAT was developed to enable a wide range of applications, including but not limited to: A) estimating crash frequencies, severities, and types for an existing interchange for which crash data are not available; B) estimating the safety performance for a new interchange that has not yet been constructed; C) estimating crash frequencies, severities, and types for a specific proposed design alternative for an existing interchange.
ISAT is intended for performing safety assessments of freeway-arterial and
Fig. 1.
freeway-freeway interchanges. ISAT also provides the capability to perform safety assessments of adjoining mainline freeway segments, crossroad ramp terminals and intersections, and arterial crossroad roadway segments. It is not recommended to use ISAT to evaluate arterial-arterial interchanges.
The interchange/ramp safety performance functions (SPFs) incorporated within ISAT were developed using freeway locations. The SPFs for SafetyAnalyst are based upon data from California, Minnesota, Ohio, and Washington. As such, the SPFs in ISAT are valid only for application to the states and time periods for which the models were developed. However, ISAT includes calibration coefficients that allow the SPFs developed for one particular state and one particular time period to be applied to other areas and time periods. By adjusting the calibration coefficients within ISAT based upon local crash data, the calculations within ISAT are more directly applicable to the user’s own agency and more useful safety predictions are obtained, better reflecting the local safety experience. The calibration coefficients adjust the predicted number of total and fatal and injury crashes, calculated within ISAT, to account for differences in crash patterns in different geographical areas that are not directly addressed by the SPFs.
Safety assessments can be performed in interchange areas where no crash data are available; and when crash data are available, ISAT can incorporate the information and provide more accurate safety estimates. Thus, ISAT can be used in both situations (i.e., when no crash data exist and when crash data are available). ISAT uses a building-block approach to assess the safety
performance of interchanges. Users input data for the interchange as a whole and for individual components of an interchange and surrounding roadway network. Safety estimates are calculated for the individual components, and these safety estimates are summed to obtain safety performance estimates for the interchange as a whole. The primary interchange elements that can be included in an analysis are:
• mainline freeway segments (MF); • interchange ramps (R) and entry lanes
(EL);
• crossroad ramp terminals (RT) and intersections;
• crossroad roadway segments (RS).
The following sequence of steps should be followed to estimate the safety performance of an interchange:
• step 1: review default data and update values to reflect current local conditions; • step 2: identify individual components
of analysis area;
• step 3: enter general interchange data; • step 4: enter interchange element data:
mainline freeway, segments ramps, crossroad ramp terminals and intersection, crossroad roadway segments;
• step 5: perform calculations; • step 6: review results.
3. Calibration Process with Data from a
Highway of Oriental Sicily
ISAT makes use of SPFs for predicting and/ or estimating crash frequencies for individual components of an interchange and the surrounding roadway network. Safety estimates are calculated for the individual components, and these safety estimates are summed to obtain safety performance estimates for the interchange as a whole. Within ISAT default SPFs are provided for the following primary interchange elements that can be included in an analysis area: 1) mainline freeway segments, 2) interchange ramps (and entry lanes), 3) crossroad ramp terminals and intersections, 4) crossroad roadway segments. ISAT makes use of SPFs from previous and ongoing safety research. These differences may be related to differences in driver population and trip purposes, climate, animal populations, crash reporting thresholds, crash investigation practices.
The calibration coefficients are intended to account for these differences and provide crash predictions that are comparable to the estimates that a highway agency would obtain
had the SPFs in ISAT been developed using their own crash records system. The nominal or default value of the calibration coefficients is 1.00 for each of the SPFs. This nominal value for each SPF needs to be replaced with a calculated value appropriate for the highway agency applying the model. In general terms, calibration coefficients greater than 1.00 apply to agencies that experience more crashes than predicted by the default SPFs. Calibration coefficients less than 1.00 apply to agencies that experience fewer crashes than predicted by the default SPFs. The calibration coefficients process, with reference to data from 10 interchanges of the Tangenziale Ovest of Catania, has been structured into 5 steps.
3.1. Step 1. Select Sites for Use in
Applying the Calibration Procedures
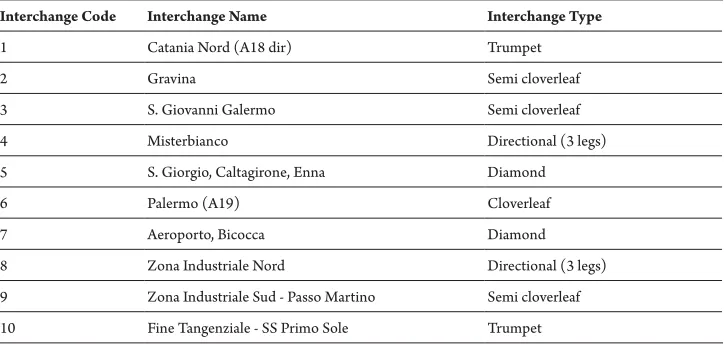
The Tangenziale Ovest of Catania is an infrastructure tangential to the city and it develops for a length of 24 km in the west part of the city. It is a fast-flowing road that connects the freeways A18 Messina-Catania, the A19 Palermo-Catania and the Catania-Siracusa. There are 10 interchanges, shown in the Table 1.
Table 1
The Interchanges on Tangenziale Ovest of Catania
Interchange Code Interchange Name Interchange Type
1 Catania Nord (A18 dir) Trumpet
2 Gravina Semi cloverleaf
3 S. Giovanni Galermo Semi cloverleaf
4 Misterbianco Directional (3 legs)
5 S. Giorgio, Caltagirone, Enna Diamond
6 Palermo (A19) Cloverleaf
7 Aeroporto, Bicocca Diamond
8 Zona Industriale Nord Directional (3 legs)
9 Zona Industriale Sud - Passo Martino Semi cloverleaf
The sites selected are a total of 204 (Table 2).
Table 2
Number of Selected Sites (Tangenziale Ovest of Catania)
Site type Sites No.
Mainline freeway segments 94
Interchange ramps (and entry lanes) 46
Crossroad ramp terminals and intersections 10
Crossroad roadway segments 54
3.2. Step 2. Select the Analysis Years
for Applying the Calibration Procedures
The period of analysis considered is 5 years (2005 to 2009). There were analyzed five crash archives, one for each year of the period under review. Each of these archives includes detailed information needed to describe each incident occurred.
In order to calibrate the distribution of crashes provided by the software ISAT with the more realistic one associated with the Catania context, the crashes distribution shown in Table 3 has been adopted.
3.3. Step 3. Predict the Total Number of
Crashes across the Selected Sites and
Analysis Years
On the Input-General worksheet, were provided the input data for variables. On the respective input worksheet either for mainline freeway segments, ramps, crossroad ramp terminals and intersections, or crossroad segments, the data were provided for the sites selected in Step 1. As part of Step 3, the calibration coefficient for the respective site subtype was modified to the default value of 1.00.
After performing the calculations, the table generated by ISAT for number of predicted crashes by interchange element type showed the number of predicted crashes for the respective interchange element type for both total and fatal and injury crash levels. Because data were input for only one subtype of the given interchange element, the predicted values are applicable to the given subtype, and these values are truly predicted values because no crash data were considered in the analysis. This calculation is represented as Eq. (1):
(1)
Table 3
Crash Type in Tangenziale Ovest of Catania
Crash No. Crash type Crash No. Crash type Crash No. Crash type
1 Unexpected object 6 Skid for the substance on the roadway or pavement
imperfection 11
Sideswipe, same direction
2 Animal 7 Other single-vehicle 12 Skid multiple-vehicle
3 Pedestrian 8 Rear end 13 Other multiple-vehicle
4 Stopped car 9 Side
where:
NA = total number of crashes for all sites for the entire analysis period;
Niy= number of crashes at site i during analysis year y.
3.4. Step 4. Determine the Total Number
of Observed Crashes across the Selected
Sites and Analysis Years
The overall number of crashes recorded by Road Police in the period from 2005 till 2009 along the Tangenziale Ovest and the areas near the interchanges is 1013, of which: 714 on the mainline freeway segments, 54 on the ramps, 8 near the crossroad ramp terminals and intersections with the minor road and 237 on the crossroad roadway segments.
The crashes are at first identified according to 3 possible severity levels: total crashes (TOT), crashes with dead and/or injured people (FI), and crashes with material damages only (PDO). Crash types were divided into 2 sub-groups in function of happening modalities: crashes with only one vehicle involved (SV), which includes the typologies from n.1 (impact against an accidental obstacle) till n.7 (another type of crash with only one vehicle involved), and the crashes with more vehicles involved (MV), including the remaining typologies (from n.8 to n.13). Further, another distinction was introduced according to the context, urban (U) or rural (R) context: in the case under examination only the interchanges of Gravina (2) and of S. G. Galermo (3) are located nearby an urban center.
The crashes relevant to the reference time period were distributed on the various design elements located along the considered
infrastructure, according to the above said classification criteria, and particularly:
• Crash Distributions for Mainline Freeways. The values for the mainline freeway segment subtypes were differentiated (i.e., mainline freeway outside interchange area and mainline freeway within interchange area). • Crash Distributions for Ramps. The values
for the ramp subtypes were differentiated (i.e., diamond off-ramp, diamond on-ramp, parclo off-on-ramp, parlco on-ramp). • Crash Distributions for Crossroad Ramp
Terminals and Intersections. The values for the crossroad ramp terminal and intersection subtypes were differentiated (i.e., 3-leg STOP-controlled [3ST], 4-leg STOP-controlled [4ST], 3-leg signalized [3SG], and 4-leg signalized [4SG]). • Crash Distributions for Crossroad
Segments. The values for the arterial crossroad roadway segment subtypes were differentiated (1-lane undivided, 2-lane undivided, 3-lane undivided, 2-lane divided, and 3-lane divided).
• Crashes distributions according to the classification that considers the different segments of the different interchange areas are reported in the Table 4.
The total number of observed crashes (O) for the entire analysis period across all individual sites of the interchange element of interest was calculated as Eq. (2):
(2)
Where Oiy represents the observed number of crashes at site i during year y.
Table 4
Proportions of Crashes by Severity and Type for Mainline Freeways (Tangenziale Ovest of Catania) Crash
No. Crash type Number of vehicles involved (SV, MV)
Area type (R, U)
Severity level (TOT, FI)
Mainline freeway outside interchange (numeric)
Mainline freeway within interchange (numeric)
1 Unexpected object SV R TOT 0.121 0.060
2 Animal SV R TOT 0.019 0.018
3 Pedestrian SV R TOT 0.005 0.000
4 Stopped car SV R TOT 0.000 0.000
5 Skid for high speed SV R TOT 0.131 0.123
6 Skid for the substance on the roadway or pavement imperfection SV R TOT 0.023 0.018
7 Other single-vehicle SV R TOT 0.112 0.113
8 Rear end MV R TOT 0.271 0.267
9 Side MV R TOT 0.019 0.056
10 Angle MV R TOT 0.000 0.011
11 Sideswipe, same direction MV R TOT 0.037 0.070
12 Skid multiple-vehicle MV R TOT 0.136 0.127
13 Other multiple-vehicle MV R TOT 0.126 0.137
Table 4 (continued)
Proportions of Crashes by Severity and Type for Mainline Freeways (Tangenziale Ovest of Catania) Crash
No. Crash type Number of vehicles involved (SV, MV)
Area type
(R, U) Severity level (TOT, FI)
Mainline freeway outside interchange (numeric)
Mainline freeway within interchange (numeric)
1 Unexpected object SV U TOT 0.048 0.098
2 Animal SV U TOT 0.058 0.027
3 Pedestrian SV U TOT 0.000 0.000
4 Stopped car SV U TOT 0.000 0.000
5 Skid for high speed SV U TOT 0.144 0.241
6 Skid for the substance on the roadway or pavement imperfection SV U TOT 0.029 0.027
7 Other single-vehicle SV U TOT 0.135 0.080
8 Rear end MV U TOT 0.260 0.223
9 Side MV U TOT 0.019 0.027
10 Angle MV U TOT 0.019 0.001
11 Sideswipe, same direction MV U TOT 0.038 0.071
12 Skid multiple-vehicle MV U TOT 0.154 0.071
Table 4 (continued)
Proportions of Crashes by Severity and Type for Mainline Freeways (Tangenziale Ovest of Catania) Crash
No. Crash type Number of vehicles involved (SV, MV)
Area type
(R, U) Severity level (TOT, FI)
Mainline freeway outside interchange (numeric)
Mainline freeway within interchange (numeric)
1 Unexpected object SV R FI 0.042 0.027
2 Animal SV R FI 0.010 0.009
3 Pedestrian SV R FI 0.010 0.000
4 Stopped car SV R FI 0.000 0.000
5 Skid for high speed SV R FI 0.156 0.161
6 Skid for the substance on the roadway or pavement imperfection SV R FI 0.000 0.000
7 Other single-vehicle SV R FI 0.073 0.036
8 Rear end MV R FI 0.354 0.321
9 Side MV R FI 0.021 0.045
10 Angle MV R FI 0.000 0.009
11 Sideswipe, same direction MV R FI 0.042 0.063
12 Skid multiple-vehicle MV R FI 0.167 0.196
13 Other multiple-vehicle MV R FI 0.125 0.134
Table 4 (continued)
Proportions of Crashes by Severity and Type for Mainline Freeways (Tangenziale Ovest of Catania) Crash
No. Crash type Number of vehicles involved (SV, MV)
Area type
(R, U) Severity level (TOT, FI)
Mainline freeway outside interchange (numeric)
Mainline freeway within interchange (numeric)
1 Unexpected object SV U FI 0.000 0.020
2 Animal SV U FI 0.021 0.001
3 Pedestrian SV U FI 0.000 0.000
4 Stopped car SV U FI 0.000 0.000
5 Skid for high speed SV U FI 0.208 0.327
6 Skid for the substance on the roadway or pavement imperfection SV U FI 0.021 0.020
7 Other single-vehicle SV U FI 0.104 0.102
8 Rear end MV U FI 0.332 0.286
9 Side MV U FI 0.021 0.061
10 Angle MV U FI 0.000 0.000
11 Sideswipe, same direction MV U FI 0.063 0.020
12 Skid multiple-vehicle MV U FI 0.167 0.061
followed shall be as follows:
• crashes that have occurred along or within mainline freeway segments, deceleration lanes, and entry lanes were attributed to mainline freeway segments;
• all crashes that have occurred within 250 ft of a crossroad ramp terminal or intersection and were classified as intersection-related were attributed to crossroad ramp terminals and intersections. All crashes that have occurred within 250 ft of a crossroad ramp terminal or intersection but were not classified as intersection-related were attributed either to ramps or crossroad roadway segments;
• all crashes that have occurred along the ramp proper portion of an interchange ramp were attributed to ramps. For crashes that have occurred on the ramp proper and were within 250 ft of the crossroad ramp terminal, if the crash was related to the operation of the ramp terminal (i.e., intersection-related), then the crash were attributed to the crossroad ramp terminal, but if the crash was not related to the operation of the ramp terminal, then the crash were attributed to the ramp;
• crashes that have occurred along or within arterial crossroad roadway segments were attributed as such, except those crashes that have occurred within 250 ft of a ramp terminal or intersection and are intersection-related, in which case the crashes were attributed to crossroad ramp terminals and intersections.
3.5. Step 5. Compute the Calibration
Coefficient
Ultimately, the value of the calibration coefficient (C) that has been entered into the calibration table for the respective SPF
is (Eq. (3)):
(3)
where:
O = total number of observed crashes (O) for the entire analysis period across all individual sites of the interchange element of interest;
NA = total number of crashes for all sites for the entire analysis period;
Oiy = observed number of crashes at site i during year y.
Niy = number of crashes at site i during analysis year y.
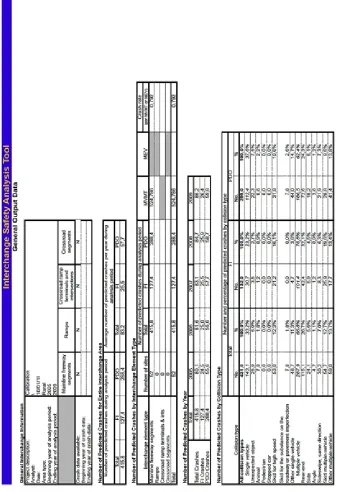
It is reported in Fig. 2, as an example, the sheet output which summarizes the first 4-steps of the calibration process for calculating the calibration coefficient for the mainline freeway segment SPF No. 1.
Plugging the predicted and observed values into Eq. (3) yields Eq. (4):
(4)
Fig. 2.
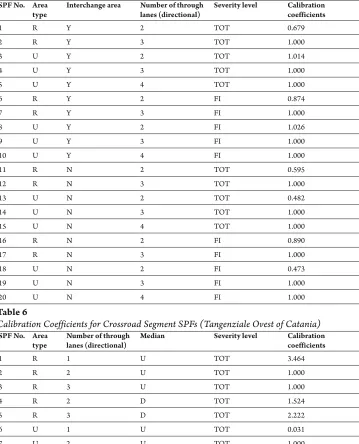
The calibration coefficients obtained according to the calibration procedure are reported in Tables 5, 6, 7 and 8.
Table 5
Calibration Coefficients for Mainline Freeway Segment SPFs (Tangenziale Ovest of Catania) SPF No. Area
type Interchange area Number of through lanes (directional) Severity level Calibration coefficients
1 R Y 2 TOT 0.679
2 R Y 3 TOT 1.000
3 U Y 2 TOT 1.014
4 U Y 3 TOT 1.000
5 U Y 4 TOT 1.000
6 R Y 2 FI 0.874
7 R Y 3 FI 1.000
8 U Y 2 FI 1.026
9 U Y 3 FI 1.000
10 U Y 4 FI 1.000
11 R N 2 TOT 0.595
12 R N 3 TOT 1.000
13 U N 2 TOT 0.482
14 U N 3 TOT 1.000
15 U N 4 TOT 1.000
16 R N 2 FI 0.890
17 R N 3 FI 1.000
18 U N 2 FI 0.473
19 U N 3 FI 1.000
20 U N 4 FI 1.000
Table 6
Calibration Coefficients for Crossroad Segment SPFs (Tangenziale Ovest of Catania) SPF No. Area
type Number of through lanes (directional) Median Severity level Calibration coefficients
1 R 1 U TOT 3.464
2 R 2 U TOT 1.000
3 R 3 U TOT 1.000
4 R 2 D TOT 1.524
5 R 3 D TOT 2.222
6 U 1 U TOT 0.031
7 U 2 U TOT 1.000
Table 6
(continued) Calibration Coefficients for Crossroad Segment SPFs (Tangenziale Ovest of Catania)
SPF No. Area type Number of through lanes
(directional) Median Severity level Calibration coefficients
9 U 2 D TOT 1.000
10 U 3 D TOT 1.000
11 R 1 U FI 4.539
12 R 2 U FI 1.000
13 R 3 U FI 1.000
14 R 2 D FI 2.389
15 R 3 D FI 2.500
16 U 1 U FI 0.033
17 U 2 U FI 1.000
18 U 3 U FI 1.000
19 U 2 D FI 1.000
20 U 3 D FI 1.000
Table 7
Calibration Coefficients for Crossroad Ramp Terminal and Intersection SPFs (Tangenziale Ovest of Catania)
SPF No. Area type Type of traffic control Number of
legs Severity level Calibration coefficients
1 R T 3 TOT 0.021
2 R SG 3 TOT 1.000
3 R ST 4 TOT 0.021
4 R SG 4 TOT 1.000
5 U ST 3 TOT 0.028
6 U SG 3 TOT 1.000
7 U ST 4 TOT 0.028
8 U SG 4 TOT 1.000
9 R ST 3 FI 0.020
10 R SG 3 FI 1.000
11 R ST 4 FI 0.020
12 R SG 4 FI 1.000
13 U ST 3 FI 0.019
14 U SG 3 FI 1.000
15 U ST 4 FI 0.019
Table 8
Calibration Coefficients for Ramp SPFs (Tangenziale Ovest of Catania)
SPF No. Area type Type of ramp Ramp configuration Severity level Calibration coefficients
1 R OFF D TOT 0.396
2 R ON D TOT 0.396
3 R OFF PL TOT 0.286
4 R ON PL TOT 0.286
5 R OFF FFL TOT 0.205
6 R ON FFL TOT 0.205
7 R FWY DIR TOT 0.205
8 U OFF D TOT 0.472
9 U ON D TOT 0.472
10 U OFF PL TOT 0.472
11 U ON PL TOT 0.472
12 U OFF FFL TOT 1.000
13 U ON FFL TOT 1.000
14 U FWY DIR TOT 1.000
15 R OFF D FI 0.490
16 R ON D FI 0.490
17 R OFF PL FI 0.343
18 R ON PL FI 0.343
19 R OFF FFL FI 0.215
20 R ON FFL FI 0.215
21 R FWY DIR FI 0.215
22 U OFF D FI 0.444
23 U ON D FI 0.444
24 U OFF PL FI 0.444
25 U ON PL FI 0.444
26 U OFF FFL FI 1.000
27 U ON FFL FI 1.000
28 U FWY DIR FI 1.000
4. Application of the Model Calibrated at
Two Interchanges
The verification procedure was executed by estimating the values of the crashes that occurred on two interchanges located in the highway A18 Catania-Messina (interchanges
“at trumpet” of Acireale and Giarre), without the input of historical data relevant to these interchanges.
the two groups of values were then calculated, in order to estimate the effectiveness of the model calibrated according to Tangenziale data, keeping unchanged the crashes distributions and the calibration coefficients previously calculated. The results of such comparison are reported in the Table 9.
The comparison shows a good prediction of the total number of crashes.
It is noted that:
• number of crashes with material damages only is always underestimated. That is because the police detects only partially the crashes with material damages only; • number of crashes with dead and/ or injured people is underestimated for interchange of Acireale and it is overestimated for interchange of Giarre. The causes of these differences are unclear. Probably the considerable overestimation of accidents provided for the interchange of Giarre is due to the unusual type of intersection: the interchange is “at reverse trumpet” and presents the geometrical characteristics abnormal (i.e. ramps of small radius to exit from the main road and ramps of large radius to exit from the secondary road).
In conclusion, the crashes underestimation by 17% for the interchange of Acireale and
the overestimation of 19% for the interchange of Giarre may be considered reasonable and therefore acceptable. The prediction of the fatal and injury crashes (FI) appears less accurate, especially in the Giarre interchange for which the model provides an excessive overestimation (the predicted crashes number is twice that of the occurred crashes).
Other applications to real cases are indispensable for the overall validation of the algorithm ISAT in order to be able to apply successfully to the Italian road interchanges.
5. Conclusion
The authors, with this paper, wanted to highlight the importance of appropriate analytical tools for the crash prediction in the interchanges. The proposed analysis has proved that the calibration of prediction models is decisive for crashes estimation, according to the crash data coming from the local situations.
It was held on the calibration of the ISAT model, created by FHWA, based on a number of parameters relating to 10 interchanges located along a highway in Oriental Sicily. The application of the model so calibrated at two interchanges present in another highway has shown encouraging results in terms of predicting the total number of crashes, although it highlighted the need to expand the survey sample, and this in order to decide permanently
Table 9
Comparison between the Crashes Occurred and Predicted (Interchanges of Acireale and Giarre)
Interchange of Acireale
Occurred crashes Predicted crashes Variation (%)
TOT FI PDO TOT FI PDO TOT FI PDO
167 69 98 138 59.9 78.1 - 17.37 - 13.19 - 20.31
Interchange of Giarre
Occurred crashes Predicted crashes Variation (%)
TOT FI PDO TOT FI PDO TOT FI PDO
on the goodness of the coefficients of calibration determined in the first part of this research.
In conclusion, the algorithm ISAT may represent a valuable instrument for Road Agencies and technical professional people working on road safety, not only for crash prediction and therefore for the individuation of the critics and more dangerous points of the existing interchanges but also to determine the most suitable design options for new interchanges or for existing interchanges requalification, through safety level prediction. In this case, safety is a worthwhile evaluation criterion for the choice of the best alternative, becoming one of the more important comparison measures to be considered and which is very often ignored during the preliminary phases of design, nowadays.
References
Bauer, K.M.; Harwood, D.W. 1998. Statistical Models of Accidents on Interchange Ramps and Speed-Change Lanes, Federal Highway Administration, Report No. FHWA-RD-97-106.
Calvi, A.; Benedetto, A.; De Blasiis, M.R. 2012. A driving simulator study of driver performance on deceleration lanes, Accident Analysis and Prevention. DOI: http:// dx.doi.org/10.1016/j.aap.2011.06.010,45(2012): 195-203.
Canale, S.; Distefano, N.; Leonardi, S. 2009a. Progettare la sicurezza stradale. Criteri e verifiche di sicurezza per la progettazione e l’adeguamento degli elementi delle infrastrutture viarie: intersezioni, tronchi, sovrastrutture, gallerie, opere idrauliche, barriere di sicurezza, illuminazione,
segnaletica ed interventi di traffic calming. EPC Libri, ISBN:
978-88-6310-129-4.
Canale, S.; Distefano, N.; Leonardi, S.; Pappalardo, G. 2009b. Progettare le intersezioni. Tecniche per la progettazione e la verifica delle intersezioni stradali in ambito urbano ed
extraurbano secondo il D.M. 19/4/2006. EPC Editore,
ISBN: 978-88-6310-352-6.
Chen, H.; Liu, P.; Lu, J.J.; Behzadi, M. 2009. Evaluating the safety impacts of the number and arrangement of lanes on freeway exit ramps, Accident Analysis and Prevention. DOI: http://dx.doi.org/10.1016/j.aap.2009.01.016, 41(3): 543-551.
Chen, H.; Zhou, H.; Zhao, J.; Hsu, P. 2011. Safety performance evaluation of left-side off-ramps at freeway diverge areas, Accident Analysis and Prevention. DOI: http://dx.doi.org/10.1016/j.aap.2010.08.019,43(3): 605-612.
Dell’Acqua, G. 2012. Using fuzzy inference systems to optimize highway alignments, International Journal for
Traffic and Transport Engineering, 2(1): 44-59.
Guo, T.; Deng, W.; Lu, J. 2010. Safety evaluation for freeway exit ramp based on speed consistency, Journal of Transportation Systems Engineering and Information
Technology. DOI:
http://dx.doi.org/10.1016/S1570-6672(09)60074-X, 10(6): 76-81.
Hasan, Md.M. 2012. Investigation of the effect of traffic parameters on road hazard using classification tree model,
International Journal for Traffic and Transport Engineering.
DOI: http://dx.doi.org/10.7708/ijtte.2012.2(3).08, 2(3): 271-285.
Qu, X.; Guo, T.Y.; Wang, W.; Hu, Q.Z. 2013. Measuring speed consistency for freeway diverge areas using factor analysis, Journal of Central South University. DOI: http:// dx.doi.org/10.1007/s11771-013-1484-0, 20(1): 267-273.
Suraji, A.; Tjahjono, N. 2012. A confirmatory factor analysis of accidents caused by the motorcycle aspect in urban area, International Journal for Traffic and Transport
Engineering, 2(1): 60-69.
Torbic, D.J.; Harwood, D.W.; Gilmore, D.K.; Richard, K.R.; Bared, J.G. 2009. Safety Analysis of Interchanges,
Transportation Research Record: Journal of the
Transportation Research Board. DOI: http://dx.doi.


![1 (4 {[(E) 5 Chloro 2 hydroxybenzylidene]amino}phenyl)ethanone oxime](data:image/gif;base64,R0lGODlhAQABAIAAAP///wAAACH5BAEAAAAALAAAAAABAAEAAAICRAEAOw==)