* To whom all correspondence should be addressed. E-mail: [email protected]
Cellular Image Segmentation using Morphological Operators
and Extraction of Features for Quantitative Measurement
Anuranjeeta1*, Sanjay Saxena1, K.K.Shukla2 and Shiru Sharma1
1School of Biomedical Engineering, 2Department of Computer Science and Engineering, Indian Institute of Technology (Banaras Hindu University), Varanasi, Uttar Pradesh - 221005, India .
http://dx.doi.org/10.13005/bbra/2139
(Received: 28 March 2016; accepted: 15 May 2016)
To address the issue of blurriness, artifacts, overlapping of cells and uneven dying of histopathology images of breast cancer cells, a computer assisted image analysis and feature extraction methods are proposed in the present paper which include pre-processing, enhancement, segmentation and features extraction. The proposed method is based on the dysplastic features that work on the computation of features for differentiation of benign and malignant cells. Morphological measures are significantly used to analyze these features. The purpose of choosing morphological operators is based on the fact that these operators principally utilize regularities and distribution of the structural features of cells. Analysis of cell morphology is an important factor that aids the complete evaluation of the microscopic cells, examination of the cell behaviour. This also provides the quantitative measure of area, perimeter, intensity, and texture, etc. present in large populations of cells. For the implementation, of proposed method publicly available image data set of 58 images (26 malignant and 32 benign) has been used. It is observed that malignant cells have the considerably greater magnitude for computed features as compared to benign. Significant variation in features values are also found in a case of malignant cells. Apart from this, an efficient approach of segmenting cells, presented in the histopathology images has been shown, that will provide assistance to the pathologist to identify malignant cells. The results reported here can be further used in the classification of cells for benign and malignant categories.
Key words: Image processing, Segmentation, Cancer, Histopathology, Morphological features.
Breast cancer is one of the most common cancers in women in the world. In 2015, an estimated 60,290 new cases of breast carcinoma were diagnosed in situ, 83% of which were ductal carcinoma in situ (DCIS) and 12% lobular carcinoma in situ (LCIS)1-2. Cancer begins when
genes in a cell become abnormal and the cell starts to growing and divide out of control. Cancerous cells replicate much faster than normal healthy cells. It divides and multiplies to form a tumor that may be benign (non-cancerous) and malignant (cancerous)3.
Histopathological studies are still most reliable and effective technique in cancer research. Till now, analysis of histopathology images has been done manually via observing dysplastic appearances such as minute structures, distribution, finding of tubules, nuclei, regularities of cell shapes and size across the tissues by the pathologist to decide whether it is benign or malignant. The distortion in the shape of cells and change in the density of cluster of cells are the signatures of the occurrence of malignancy in body tissue4-6. Pathologists face several problems while
of pathologists. For cancer detection, morphological feature extraction is the main tool for analyzing the cellular organization, abnormality, and changes in the physiological state of the cells 7-9. Analysis of the cells based on their morphological
differences was applied to study the differentiation of benign or malignant cells. A computer aided diagnosis system is proposed in this paper as a qualitative and quantitative tool for analysis and classification10-11. Several types of research have
analyzed histopathology images that relate image analysis of cells morphology to the malignancy detection. A. Madabhushi observed the challenges in digital imaging that led to improvement in image analysis techniques resulting in improved opportunities to the pathologist for the treatment of benign tissues12. A. D. Belsare et al. worked on
the tissue structure and presented cell distribution in a tissue. They described irregularities of the shapes of cells to determine the level of malignancy and benign in histopathology images13.
Bhattacharjee et al. presented a review of computer-aided diagnosis system to detect cancer from histopathology images using image processing method14. Demir et al. presented on both tissue
level and cellular level automatic diagnosis of biopsy image using image processing techniques, feature extraction and classification techniques15.
S. Petushi obtained the intensity of the pixels that are registered and calculate the mean of the neighboring pixels16. Bergmeir et al. proposed a
model to extract the various texture features contrast, correlation, energy, homogeneity, gray level, and HSV by using local histograms and GLCM17.
The aim of present work is to investigate robust and accurate image analysis algorithm for the purpose of detection of cancer cells using morphological and texture features (GLCM) extracted from the segmented histopathology images. In this work, diverse image processing techniques on histopathological images, breast cancer have been analyzed. Classification of benign and malignant cells has been done in three steps: pre-processing, segmentation and feature extraction.
The organization of this paper is as follows. Section 2 discusses methodology and proposed algorithm. Section 3 describes the results and Section 4 describes discussions. Finally,
section 5 draws the conclusion of the work presented in this paper.
MATERIALS AND METHODS
Images collection
Histopathology breast cancer cell datasets used in present work have been taken from www.bioimage.ucsb.edu (Centre for Bio-image Informatics, University of California, Santabarbara (UCSB) for analysis. Microphotographs of breast cancer histopathology of total 58 images were taken, 26 out of which were malignant and 32 are benign. With the help of cropping histopathology images are fragmented into single and group cells. A dataset of single cells consisting of 218 benign and 233 malignant and a dataset of the group of cells consisting of 72 benign and 73 malignant were framed. Structural, intensity and textures based 30 features were used to distinguish between benign and malignant cells. The images acquired from histopathology breast cancer (UCSB) datasets were already stained to visualize various parts, cellular structures such as cells, nuclei, and cytoplasm of the tissue. Certain special stains are used to bind selectively to particular components. The nuclei were stained blue with hematoxylin while cytoplasm and extra cellular components were in pink due to eosin staining.
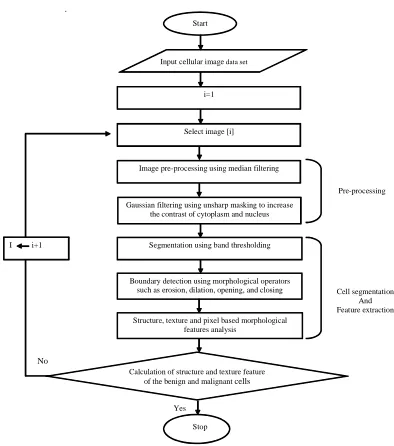
y Cell segmentation And Feature extraction Pre-processing No Yes Stop Segmentation using band thresholding
Calculation of structure and texture feature of the benign and malignant cells
Boundary detection using morphological operators such as erosion, dilation, opening, and closing
Structure, texture and pixel based morphological features analysis I i+1
Image pre-processing using median filtering Start
Input cellular image data set
Gaussian filtering using unsharp masking to increase the contrast of cytoplasm and nucleus
i=1
Select image [i]
Experimental set up
Experiments have been implemented on a 3.40 GHz CPU with 4 GB RAM, 64 bits, Windows 7 operating system, with MATLAB. Figure 1
represents the flow chart of the proposed system and basic steps involved in the cell morphological analysis.
Image pre-processing using median filtering The main purpose of the pre-processing stage was to reduce the background noise and to enhance the image to improve the image quality. In this paper, median filtering was implemented to preprocess the images to eliminate graininess. Basic fundamental of median filtering is that every output pixel comprises the median value in the 5-by-5 neighborhood around the equivalent pixel in the input image. The image was padded with zeros on the edges, so the median values for the points of 3 pixels of the edges may appear distorted. After that, the contrast is enhanced between the cytoplasm, nucleus and extracellular components using unsharp masking. The filter was applied to the image by subtracting the multiplied scaled factor, and Gaussian filtered from the input image. A rotationally symmetric Gaussian low pass filter with a standard deviation of 50 pixels was used, with a total filter size of 15-by-15 pixels. The scaling factor was 0.35.
Segmentation
Segmentation is the process where an image is divided into the different regions on some similarity basis. The basic purpose of segmentation was the extraction of important features from the image, from which information can easily be perceived. The morphological appearance of structures like size, shape, and color intensity, are important factors for the identification of the cancer cells. To analyze all these indicators, images firstly should be segmented. In this paper band thresholding was implemented to group pixels lying in the cellular region for segmentation. Basic morphological operations such as filling with holes, opening, closing dilation, erosion were done to plot the boundary of the cells [18-21]. This procedure provides user to see different outlined cells. For implementing dilation, arbitrary sized structuring element has been used. Further, for erosion implemented disk sized structuring element has been used. The region of interest (ROI) of the segmented cells was then considered for feature
manipulation. Un-weighted centroid and the weighted centroid are marked by blue and red color
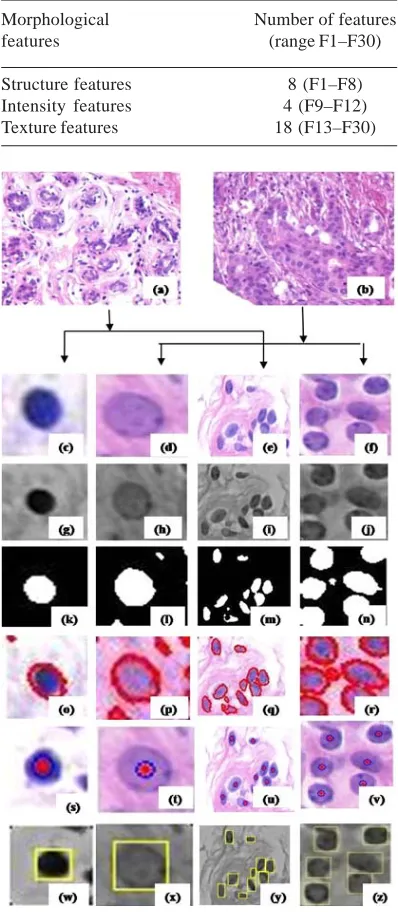
Table 1. The distribution of various features extracted from images and their ranges
Morphological Number of features
features (range F1–F30)
Structure features 8 (F1–F8)
Intensity features 4 (F9–F12)
Texture features 18 (F13–F30)
Fig. 2. Histopathology breast cancer images (a) benign cells (b) malignant cells. Selected ROI of cells in RGB (c) benign single cell (d) malignant single cell (e) benign group cells (f) malignant group cells; (g), (h), (i), (j) Converted into gray scale image respectively. (k), (l), (m), (n), after band thresholding. (o), (p), (q), (r) distinct cells. (s), (t), (u), (v) Weighted (red) unweighted (blue) marked centroid.
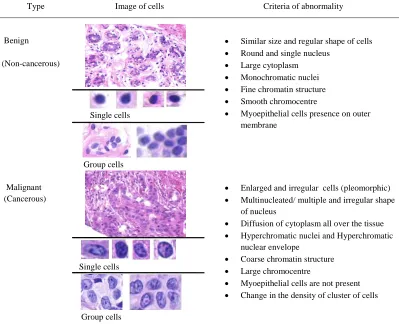
Type Image of cells Criteria of abnormality
Benign
(Non-cancerous)
Single cells
Group cells
• Similar size and regular shape of cells
• Round and single nucleus
• Large cytoplasm
• Monochromatic nuclei
• Fine chromatin structure
• Smooth chromocentre
• Myoepithelial cells presence on outer membrane
Malignant (Cancerous)
Single cells
Group cells
• Enlarged and irregular cells (pleomorphic)
• Multinucleated/ multiple and irregular shape of nucleus
• Diffusion of cytoplasm all over the tissue
• Hyperchromatic nuclei and Hyperchromatic nuclear envelope
• Coarse chromatin structure
• Large chromocentre
• Myoepithelial cells are not present
• Change in the density of cluster of cells
Table 2. Feature of cell in benign and malignant cells
boundary respectively. Standard deviation is then measured. After that, it is converted to gray level image having one bounding box marked by yellow color [22-25]. Single cells and the group of cells have been taken into account for segmentation and analysis. Figure 2 depicts the results obtained by implementing the steps discussed above. Extraction of morphological features
The most significant portion of this work is the computation of features. To do the same, the total features of the particular ROI (region of interest) are extracted to distinguish different types of cells such as benign and malignant. This based on their structural, intensity, and texture features in single cells and the group of cells were computed from the segmented cell images as shown in Table 1. Further, 30 features have been computed for the cells present in the image.
The quantification of these features helps to differentiate the malignant cells from benign
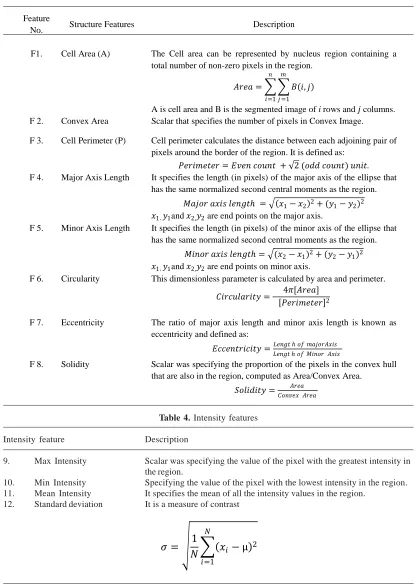
cells. Moreover, the statistics computed on these properties is used to identify cancer in a tissue. Structure-based features used in this paper are the area, convex area, perimeter, major axis length, minor axis length, circularity, eccentricity, and solidity are explained in Table 3.
Intensity features
Pixel based features provide information about the intensity (gray-level or color) histogram of the pixels located in cells. These features were extracted from the gray-level or color histogram of the image. This includes max intensity, min intensity, mean intensity and standard deviation that explained in Table 4. These types of features do not provide any information about the spatial division of the pixels.
Texture features
Table 3. Structure features
Table 4. Intensity features
Intensity feature Description
9. Max Intensity Scalar was specifying the value of the pixel with the greatest intensity in the region.
10. Min Intensity Specifying the value of the pixel with the lowest intensity in the region. 11. Mean Intensity It specifies the mean of all the intensity values in the region.
12. Standard deviation It is a measure of contrast
= 1 ( − µ)2
=1
Feature
No. Structure Features Description
F1. Cell Area (A) The Cell area can be represented by nucleus region containing a
total number of non-zero pixels in the region.
= ( , )
=1 =1
A is cell area and B is the segmented image of i rows and columns.
F 2. Convex Area Scalar that specifies the number of pixels in Convex Image.
F 3. Cell Perimeter (P) Cell perimeter calculates the distance between each adjoining pair of
pixels around the border of the region. It is defined as:
= + √2 ( ) .
F 4. Major Axis Length It specifies the length (in pixels) of the major axis of the ellipse that
has the same normalized second central moments as the region.
ℎ = ( 1− 2)2+ ( 1− 2)2
1, 1and 2, 2 are end points on the major axis.
F 5. Minor Axis Length It specifies the length (in pixels) of the minor axis of the ellipse that
has the same normalized second central moments as the region.
ℎ = ( 2− 1)2+ ( 2− 1)2
1, 1and 2, 2 are end points on minor axis.
F 6. Circularity This dimensionless parameter is calculated by area and perimeter.
= 4 [ ]
[ ]2
F 7. Eccentricity The ratio of major axis length and minor axis length is known as
eccentricity and defined as:
= ℎ ℎ
F 8. Solidity Scalar was specifying the proportion of the pixels in the convex hull
that are also in the region, computed as Area/Convex Area.
coarseness, and smoothness. The texture is a connected set of pixels that repeatedly occur in an image. The texture analysis techniques based on the gray level co-occurrence matrix is applied to histopathological images analysis. It is an estimate of image properties related to second order statistics. The gray level co-occurrence matrix GLCM quantifies the various textural features such as autocorrelation, contrast, correlation, cluster prominence, dissimilarity, energy, entropy, homogeneity, maximum probability, sum of squares, sum of average, sum of variance, sum of entropy, difference variance, difference entropy, information measure of correlation 2, inverse difference normalized (INN) and inverse difference moment normalize etc. Some of them are described in Table 5.
RESULTS
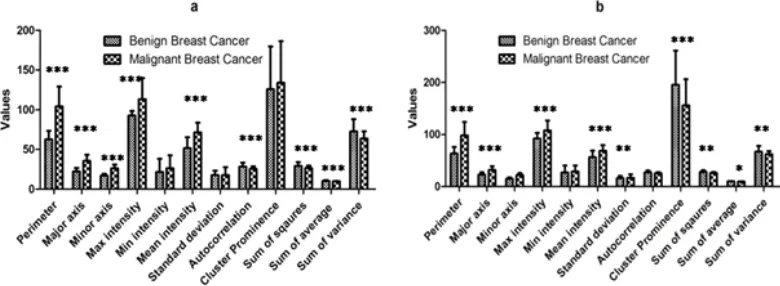
These features such as area, convex area, perimeter, major axis, minor axis, circularity, eccentricity, max intensity, mean intensity, solidity, autocorrelation, cluster prominence, sum of squares, sum of average, sum of variance, contrast, sum of entropy, and information measure of correlation 2. This yielded significant differentiation between benign and malignant cells into single cells and group cells. The reasons for choosing the group of cells over single cells are to produce the accurate result. The variations of values of various features for single cells and group cells to differentiate benign cells and malignant cells are shown in Figure 3 to Figure 6. These features show that malignant cells have the greater
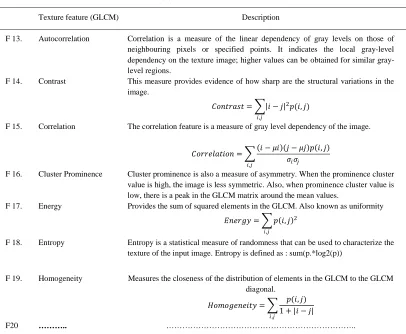
Texture feature (GLCM) Description
F 13. Autocorrelation Correlation is a measure of the linear dependency of gray levels on those of neighbouring pixels or specified points. It indicates the local gray-level dependency on the texture image; higher values can be obtained for similar gray-level regions.
F 14. Contrast
= | − |2 ( , ) ,
This measure provides evidence of how sharp are the structural variations in the image.
F 15. Correlation
= ( − )( − ) ( , )
,
The correlation feature is a measure of gray level dependency of the image.
F 16. Cluster Prominence Cluster prominence is also a measure of asymmetry. When the prominence cluster value is high, the image is less symmetric. Also, when prominence cluster value is low, there is a peak in the GLCM matrix around the mean values.
F 17. Energy
= ( , )2 ,
Provides the sum of squared elements in the GLCM. Also known as uniformity
F 18. Entropy Entropy is a statistical measure of randomness that can be used to characterize the texture of the input image. Entropy is defined as : sum(p.*log2(p))
F 19. Homogeneity
= ( , )
1 + | − |
,
Measures the closeness of the distribution of elements in the GLCM to the GLCM diagonal.
F20 ……….. ………..
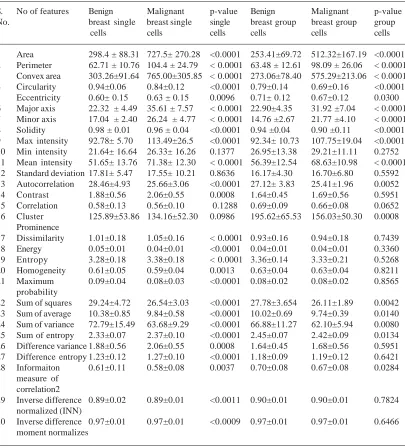
Table 6. Comparative parameter of single cells and group cells of benign and malignant cells of breast cancer image
S. No of features Benign Malignant p-value Benign Malignant p-value
No. breast single breast single single breast group breast group group
cells cells cells cells cells cells
1 Area 298.4 ± 88.31 727.5± 270.28 <0.0001 253.41±69.72 512.32±167.19 <0.0001 2 Perimeter 62.71 ± 10.76 104.4 ± 24.79 < 0.0001 63.48 ± 12.61 98.09 ± 26.06 < 0.0001 3 Convex area 303.26±91.64 765.00±305.85 < 0.0001 273.06±78.40 575.29±213.06 < 0.0001
4 Circularity 0.94±0.06 0.84±0.12 <0.0001 0.79±0.14 0.69±0.16 <0.0001
5 Eccentricity 0.60± 0.15 0.63 ± 0.15 0.0096 0.71± 0.12 0.67±0.12 0.0300
6 Major axis 22.32 ± 4.49 35.61 ± 7.57 < 0.0001 22.90±4.35 31.92 ±7.04 < 0.0001 7 Minor axis 17.04 ± 2.40 26.24 ± 4.77 < 0.0001 14.76 ±2.67 21.77 ±4.10 < 0.0001 8 Solidity 0.98 ± 0.01 0.96 ± 0.04 <0.0001 0.94 ±0.04 0.90 ±0.11 <0.0001 9 Max intensity 92.78± 5.70 113.49±26.5 <0.0001 92.34± 10.73 107.75±19.04 <0.0001 10 Min intensity 21.64± 16.64 26.33± 16.26 0.1377 26.95±13.38 29.21±11.11 0.2752 11 Mean intensity 51.65± 13.76 71.38± 12.30 < 0.0001 56.39±12.54 68.63±10.98 < 0.0001 12 Standard deviation 17.81± 5.47 17.55± 10.21 0.8636 16.17±4.30 16.70±6.80 0.5592 13 Autocorrelation 28.46±4.93 25.66±3.06 <0.0001 27.12± 3.83 25.41±1.96 0.0052
14 Contrast 1.88±0.56 2.06±0.55 0.0008 1.64±0.45 1.69±0.56 0.5951
15 Correlation 0.58±0.13 0.56±0.10 0.1288 0.69±0.09 0.66±0.08 0.0652
16 Cluster 125.89±53.86 134.16±52.30 0.0986 195.62±65.53 156.03±50.30 0.0008 Prominence
17 Dissimilarity 1.01±0.18 1.05±0.16 < 0.0001 0.93±0.16 0.94±0.18 0.7439
18 Energy 0.05±0.01 0.04±0.01 <0.0001 0.04±0.01 0.04±0.01 0.3360
19 Entropy 3.28±0.18 3.38±0.18 < 0.0001 3.36±0.14 3.33±0.21 0.5268
20 Homogeneity 0.61±0.05 0.59±0.04 0.0013 0.63±0.04 0.63±0.04 0.8211
21 Maximum 0.09±0.04 0.08±0.03 <0.0001 0.08±0.02 0.08±0.02 0.8565
probability
22 Sum of squares 29.24±4.72 26.54±3.03 <0.0001 27.78±3.654 26.11±1.89 0.0042 23 Sum of average 10.38±0.85 9.84±0.58 <0.0001 10.02±0.69 9.74±0.39 0.0140 24 Sum of variance 72.79±15.49 63.68±9.29 <0.0001 66.88±11.27 62.10±5.94 0.0080 25 Sum of entropy 2.33±0.07 2.37±0.10 <0.0001 2.45±0.07 2.42±0.09 0.0134 26 Difference variance 1.88±0.56 2.06±0.55 0.0008 1.64±0.45 1.68±0.56 0.5951 27 Difference entropy 1.23±0.12 1.27±0.10 <0.0001 1.18±0.09 1.19±0.12 0.6421
28 Informaiton 0.61±0.11 0.58±0.08 0.0037 0.70±0.08 0.67±0.08 0.0284
measure of correlation2
29 Inverse difference 0.89±0.02 0.89±0.01 <0.0011 0.90±0.01 0.90±0.01 0.7824 normalized (INN)
30 Inverse difference 0.97±0.01 0.97±0.01 <0.0009 0.97±0.01 0.97±0.01 0.6466 moment normalizes
magnitude of shape based features in comparison to benign cells, and there was variation in other features values. All the malignant cells in the single cells and the group have increased the size (area, convex area, perimeter, major axis, minor axis) and elongated shape (circularity, eccentricity) and greater magnitude of the maximum and mean intensity. This size, shape and intensity based feature were significant for the differentiation point of view for single cells and group cells. Some of
Fig. 3. Variations of values of various features for (a) single cell (b) group cells for breast cancer
Fig. 4. Variations of values of various features for (a) single cell (b) group cells for breast cancer
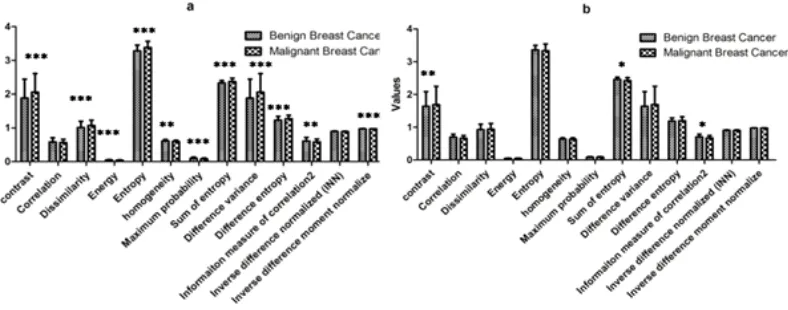
Fig. 5. Variations of values of various features for (a) single cell (b) group cells
normalizes features are significant in single cells only and insignificant in group cells. Texture feature of group cells does not belong to each single cell and the group it takes as a whole image. Cluster prominence feature is insignificant in single cells and significant in group cells.
Fig. 6. Variations of values of various features for (a) single cell (b) group cells. Following table represents the numerical value of the features of single and group cells
DISCUSSION
In this work, morphological features of breast cancer cells have been calculated in benign and malignant cells. Structure-based features of malignant cells show greater magnitude such as area, perimeter, major axis, and minor axis etc. in comparison to benign cells as shown in figures 3 to 6. Main reasons for this outcomes are that benign cells grow and divide when they receive signals from the surrounding cells and does not exhibit contact inhibition phenomenon while malignant cells have uncontrolled cell division and grow faster. Benign cells undergo through ageing and senescence process, as well as repair their physiological and chromosomal abnormalities (e.g. apoptosis) while malignant cells show neither repair nor induce apoptosis. Benign cells become specialized or mature so that they are able to carry out their function in the body. While malignant cells often reproduce very quickly and do not exhibit mature phenotypes.
Further, shape based two feature circularity and eccentricity of the cell has been taken into consideration. When shape factor circularity is taken between 0 and 1. When the value is 1 than the object is a perfect circle. In our case, for benign cells, it is found to be nearly 1 i.e. 0.94 shows that it circular in structure as compare to malignant cell nearly to 0 i.e., 0.84 have not circular structure. The eccentricity of an ellipse gives a measure of just how squashed it is. If the eccentricity is 0, it is not squashed at all and so
remain a circle. If it is 1 than completely squashed and look like a line. As per consideration of eccentricity, it is found to be nearly 1 i.e. 0.7. This shows that malignant cells have elongated structure and in concern to benign it is about 0.5 that shows circular structure as shown in Table 6. The main cause of the results obtained as malignant cells image has generally elongated, distorted or blebs shape of cells. This becomes physiologically nonfunctional such types of shape is useful for malignant cells to exhibit random migration i.e. metastasis. In normal tissues, the cells stay together and adheres to each other through specific microstructures that assist in governing the cellular function.
Our report is in agreement with the data reported by several authors Kasmin et al. extracted the features of microscopic biopsy images including (area, perimeter, convex area, solidity, major axis length, eccentricity, ratio of cell and nucleus area, circularity, and mean intensity) of cytoplasm [26]. Basavanhally et al. quantify the morphological features that classify their structure in a histopathological slide image which leads to discrimination of a cell into a particular class for the purpose of diagnosis. [27]. Sinha et al. extracted some features of histopathological images that contain the area of cells, area ratio, eccentricity, compactness, average values of color components, energy, correlation, and entropy [28].
as compared to benign where max intensity pixel values found to be almost identical to normal cells as shown in the Table1. Intensity based some of the features such as standard deviation and minimum intensity have been found insignificant in both case benign and malignant. The possible reason for this observation shows the presence of high amount of DNA (deoxyribose nucleic acids) or increase the amount of nucleoprotein synthesis in the malignant cells. This results in the larger nucleolus and dark-staining nuclei which referred as hyperchromatism. Thiran, et al. and Zhao et al. also worked on the pixel of the benign and malignant nucleus. [29-30]. C. Demir et al. reported that the intensity-based approach is employed to calculate the intensity value of pixels to define the features in a histopathological slide image [14].
Texture based feature are also helpful in distinguishing benign and malignant cells [31-33]. Hamilton et al. worked on texture analysis to develop criteria for the automatic identification of colorectal dysplasia from a background through focal areas of histologically normal tissue [34]. Mouelhi et al. classify the cancerous cells from histopathological images by using Haralick’s textures features, color component and the histogram of oriented gradients (HOG). This is based on statistical moments (CCSM) that feature selection and extraction approaches [35]. In our implementation, computed texture features can also depict the difference between benign and malignant cells Figure 5 and 6.
CONCLUSION
In this paper, the histopathological cellular image of suspected breast cancer has been analyzed using structure, intensity and texture based morphological features. The developed algorithm for automated analysis and evaluation of histopathological images will assist the pathologists and reduce the human error. Such automated cancer diagnosis facilitates mathematical judgment to the pathologist. The future work would include more features in the algorithm for efficient differentiation between benign and malignant cancer cells so that suitable classifiers may be designed.
Conflict of Interests
The authors declare that there is no conflict of interests regarding the publication of
this paper.
ACKNOWLEDGMENTS
The first author gratefull acknowledge financial assistance in the form of Rajiv Gandhi National Fellowship.
REFERENCES
1. Chen, J. M., Qu, A. P., Wang, L. W., Yuan, J. P., Yang, F., Xiang, Q. M. and Li, Y., 2015. New breast cancer prognostic factors identified by computer-aided image analysis of HE stained histopathology images. Scientific reports, 5. 2. Siegel, R.L., Miller, K.D. and Jemal, A., 2015.
Cancer statistics, 2015. CA: a cancer journal for clinicians, 65(1), pp.5-29.
3. Rubin, R., Strayer, D.S. and Rubin E. 2008 Rubin2 s Pathology, Clinicopathologic Foundations of Medicine. Philadelphia: Lippincott Williams and Wilkins.
4. Veta, M., Pluim, J.P., van Diest, P.J. and Viergever, M.A., 2014. Breast cancer histopathology image analysis: A review. Biomedical Engineering, IEEE Transactions on, 61(5), pp.1400-1411. 5. Chen, S., Zhao, M., Wu, G., Yao, C. and Zhang,
J., 2012. Recent advances in morphological cell image analysis. Computational and Mathematical Methods in Medicine.
6. Liu, B., Yin, C., Liu, Z., Zhang, Z., Gao, J., Zhu, M., Gu, J. and Xu, K., 2007. Microscopic image analysis and recognition on pathological cells. Proceeding of Electrical and Computer Engineering, Canada, 22-26, pp.1022-1025. 7. Zhang, X., Liu, W., Dundar, M., Badve, S. and
Zhang, S., 2015. Towards large-scale histopathological image analysis: Hashing-based image retrieval. Medical Imaging, IEEE Transactions on, 34(2), pp.496-506.
8. Zhang, X., Su, H., Yang, L. and Zhang, S., 2015. Fine-grained histopathological image analysis via robust segmentation and large-scale retrieval. In Proceedings of the IEEE Conference on Computer Vision and Pattern Recognition; pp. 5361-5368.
9. Gurcan, M.N., Boucheron, L.E., Can, A., Madabhushi, A., Rajpoot, N.M. and Yener, B., 2009. Histopathological image analysis: A review. Biomedical Engineering, IEEE Reviews in, 2, pp.147-171.
Computer aided abnormality detection for microscopy images of cervical tissue. In Complex Medical Engineering (CME), 2010 IEEE/ICME International Conference on (pp. 63-68). IEEE. 11. Mulrane, L., Rexhepaj, E., Penney, S., Callanan, J. J., Gallagher, W. M., 2008. Automated image analysis in histopathology: a valuable tool in medical diagnostics.
12. Madabhushi A. 2009. Digital pathology image analysis: opportunities and challenges, Imaging in medicine, 1:1pp.7-10.
13. Belsare, A. D. and Mushrif, M. M., 2012. Histopathological image analysis using image processing techniques: An overview. Signal, Image Processing, 3(4): 23.
14. Bhattacharjee, S., Mukherjee, J., Nag, S., Maitra, I. K. and Bandyopadhyay, S. K., 2014. Review on Histopathological Slide Analysis using Digital Microscopy. International Journal of Advanced Science and Technology, 62: pp.65-96. 15. Demir C. and Yener B., 2005. Automated cancer
diagnosis based on histopathological images: a systematic survey. Rensselaer Polytechnic Institute, Tech. Rep.
16. Petushi, S., Garcia, F.U., Haber, M.M., Katsinis, C. and Tozeren, A., 2006. Large-scale computations on histology images reveal grade-differentiating parameters for breast cancer. BMC Medical Imaging, 6(1), pp.14.
17. Bergmeir, C. Silvente, M. G. and Ben´ýtez, J. M., 2012. Segmentation of cervical cell nuclei in high-resolution microscopic images: a new algorithm and a web-based software framework,Computer Methods and Programs in Biomedicine, vol. 107, no. 3, pp. 497–512. 18. Sharma, N., Ray, A. K., Sharma, S., Shukla, K.
K., Aggarwal, and L., Pradhan, S., 2009. Segmentation of medical images using simulated annealing based fuzzy C Means algorithm. International Journal of Biomedical Engineering and Technology,2(3):pp. 260-278.
19. Xu, J., Agner, S. C., and Madabhushi, A., 2013. Spectral embedding based active contour (SEAC) for lesion segmentation on breast dynamic contrast enhanced magnetic resonance imaging. Medical physics, 40 (3), 032305. 20. Naik, S., Doyle, S., Agner, S., Madabhushi, A.,
Feldman, M. and Tomaszewski, J., 2008. Automated gland and nuclei segmentation for grading of prostate and breast cancer histopathology. In Biomedical Imaging: From Nano to Macro, 2008. ISBI 2008. 5th IEEE International Symposium on (pp. 284-287). IEEE.
21. Vahadane, Abhishek, and Sethi, A., 2013. Towards generalized nuclear segmentation in
histological images. Bioinformatics and Bioengineering (BIBE), 2013 IEEE 13th International Conference on. IEEE.
22. Chaddad, A., Tanougast, C., Dandache, A., and Bouridane, A., 2011. Classification of cancer cells based on morphological features from segmented multispectral bio-images. In 4th International Conference on Biomedical Electronics and Biomedical Informatics (pp. 92-97).
23. Zhao, M., Chen, L., Bian, L., Zhang, J., Yao, C. and Zhang, J., 2015. Feature Quantification and Abnormal Detection on Cervical Squamous Epithelial Cells. Computational and mathematical methods in medicine.
24. Esgiar, A.N., Naguib, R.N., Sharif, B.S., Bennett, M.K. and Murray, A., 1998. Microscopic image analysis for quantitative measurement and feature identification of normal and cancerous colonic mucosa. Information Technology in Biomedicine, IEEE Transactions on, 2(3), pp.197-203.
25. Liu, B., Yin, C., Liu, Z., Zhang, Z., Gao, J., Zhu, M., Gu, J. and Xu, K., 2007. Microscopic image analysis and recognition on pathological cells. Proceeding of Electrical and Computer Engineering, Canada, 22-26, 1022-1025. 26. F. Kasmin, A. S. Prabuwono, and A. Abdullah.,
2012. Detection of leukemia in human blood sample based on microscopic images: a study. Journal of Theoretical & Applied Information Technology, vol. 46, no. 2.
27. Basavanhally, A.N., Ganesan, S., Agner, S., Monaco, J.P., Feldman, M.D., Tomaszewski, J.E., Bhanot, G. and Madabhushi, A., 2010. Computerized image-based detection and grading of lymphocytic infiltration in HER2+ breast cancer histopathology. Biomedical Engineering, IEEE Transactions on, 57(3), pp.642-653. 28. Sinha N., and Ramkrishan, A. G., 2003.
Automation of differential blood count, in Proceedings of the Conference on Convergent Technologies for Asia-Pacific Region (TINCON ’03), pp. 547–551, Bangalore, India.
29. Thiran, J. P., and Macq, B., 1996. Morphological feature extraction for the classification of digital images of cancerous tissues. Biomedical Engineering, IEEE Transactions on, 43(10), 1011-1020.
30. Zhao, T., and Murphy, R. F., 2007. Automated learning of generative models for subcellular location: building blocks for systems biology. Cytometry Part A, 71(12), 978-990. 31. Chaddad, A., Tanougast, C.A.M.E.L., Dandache,
texture bio-images for classification of colon cancer cells. WSEAS Transactions on Biology and Biomedicine, 8(2), pp.39-50.
32. R. M. Haralick, K. Shanmugam, and I. Dinstein., 1973.Textural features for image classification, IEEE Transactions on Systems, Man and Cybernetics, vol. 3, no. 6, pp. 610–621. 33. Doyle, S., Agner, S., Madabhushi, A., Feldman,
M. and Tomaszewski, J., 2008. Automated grading of breast cancer histopathology using spectral clustering with textural and architectural image features. In Biomedical Imaging: From Nano to Macro, 2008. ISBI 2008. 5th IEEE International Symposium on pp. 496-499, IEEE.
34. Hamilton, P., Wang, Y., Crookes, D., Diamond, J., and Turner, R., 2007. Segmentation of squamous epithelium from ultra-large cervical histological virtual slides. In Engineering in Medicine and Biology Society, 2007. EMBS 2007. 29th Annual International Conference of the IEEE (pp. 775-778). IEEE