© 2016 IJSRSET | Volume 2 | Issue 2 | Print ISSN : 2395-1990 | Online ISSN : 2394-4099 Themed Section: Engineering and Technology
Performance and Emission Analysis of Karanja Oil and Its Blends with
Different Additives
M. Goudilyan, M. K. Murthi
1
PG student of Mechanical Engineering, Nandha Engineering College, Erode, Tamilnadu, India
2
Professor, Department of Mechanical Engineering, Nandha Engineering College, Erode, Tamilnadu, India
ABSTRACT
An experimental analysis was made to evaluate the performance, emission characteristics of a diesel
engine using blend (B15) of methyl ester of karanja with diesel. The main aim of the present work is to
carry out an experimental evaluation of single cylinder diesel engine by adding 5%, 10% and 15% of
ethanol with B15 biodiesel. Experiments were tested with different load conditions in terms of brake
power at a constant speed of 1500 rpm. The performance parameters were found to be extremely close to
that of diesel. The brake thermal efficiency and mechanical efficiency were superior to mineral diesel for
some particular blending ratios under certain loads. The emission characteristics were also studied and
levels of carbon monoxide, carbon dioxide, nitric oxide and hydrocarbons were found to be a little higher
than pure diesel.
Keywords
:
Karanja Oil, Ethanol, Methanol, Performance and Emission Characteristics
I.
INTRODUCTION
A. Method of Extraction
The method of processing is likely to have an effect on the composition of the oil, since the methods used, such as pressing (expelling) or solvent extraction are not likely to remove exactly the same mix of components in the same proportions [1]. The karanja oil yield that can be obtained from karanja seed kernels also varies from 25% to 45%.The oil can be obtained through pressing (crushing) of the seed kernel both through the cold pressing or through a process incorporating temperature controls [2]. karanja seed oil can also be obtained by
solvent extraction
of the pongamia seed, fruit, oil, cake or kernel. A large industry in India extracts the oil left behind in the seed cake using hexane. This solvent-extracted oil is of a worse quality as compared to the cold pressed oil and is mostly used for soap manufacturing.
karanja oil cake
is a by-product obtained in the solvent extraction method for karanja oil.B. Transesterification
The process of converting the raw vegetable oil into biodiesel, which is fatty acid alkyl ester is known as transesterification. There are three basic routes to biodiesel production from biolipids [5]. Base catalyzed transesterification of the biolipid carried out under atmospheric pressure and at temperature 60-70˚ C
Direct acid catalyzed transesterification of the biolipid
Conversion of the biolipid to its fatty acids and to biodiesel
The processing steps for the most commonly used method viz. base catalyzed transesterification of the biolipid would be as follows [6]. Exact quantity of sodium hydroxide required as determined by titration is thoroughly mixed in methanol till it dissolves completely to result in potassium methoxide. Karanja oil is heated, if required (during winter) and mixed in the sodium methoxide while with agitator running. Biodiesel fraction is then washed and dried. It is then checked for quality [7]. Methods commonly used for producing biodiesel are batch and nonstop processes. In general, smaller capacity plants and variable feedstock quality guarantee use of batch systems. Continuous systems usually lead the operation on a 24x7 basis, requiring larger capacities to validate larger staffing needs and also requiring standardized feedstock quality.
II.
METHODS AND MATERIAL
2. Washing Procedure
2.1 Significance of Washing
The methyl ester produced with the described above will work in some heating and lighting equipment and may be used as a lubricant for diesel engines [8]. Most impurities settle out into the glycerol layer including unfiltered particulates, glycerin, and methanol. Some sources support using unwashed methyl ester, because washing methyl ester is a time consuming process [9].
But some alcohol, sodium hydroxide, and soap remain suspended throughout the biodiesel after the trans esterification is complete. Water in methyl ester can lead to biological growth as the fuel degrades. Unreacted methanol in the methyl ester can lead to explosion and can corrode engine components [10]. The catalyst,
sodium hydroxide, can also attack other engine components. Since the sodium hydroxide and methanol are chemical bases, unwashed biodiesel is caustic and may damage diesel engine components [11]. Soap is not petroleum and will decrease fuel lubricity and cause injector coking and other deposits.
2.2 Removal of Unreacted Methanol
Unreacted alcohol might be distilled from the methyl ester and reclaimed for use in upcoming batches. Although alcohol recovery is beyond the scope of this publication, note that methanol boils at 148 deg at sea level. Methanol can be determined from biodiesel by heating it; do this outside or vent the methanol to the outside. Never breathe methanol fumes. A greatly improved and safer solution is to use a vacuum pump to lower the pressure of a closed tank. The methanol can be collected and reused. See the resources section on methanol reclamation.
3. Fuel Blending
3.1 Procedure
Diesel ethanol blend is selected for study. Because of the low solubility of ethanol in diesel fuel, a solvent consisting of karanja oil ester is added to ethanol-diesel blend. The mass of every constituent element was calculated based upon the volume equivalent to the selected blend proportions. As diesel has a superior specific gravity than bio-ethanol, it was splash blended on peak of bio-ethanol to allow the fuels to mix together
Figure 1. Phase separation sample 1
Figure 2. Phase separation sample 2
4. Experimental Setup
Figure 3. Engine Setup
4.1 Engine Details
Name of the engine kirloskar engine
Type Vertical type
Rated speed 1500
Rated power 7.36 kw
Bore 102 mm
Stroke 110 mm
Mode of operation 4 stroke
Cooling Water cooling
Loading Rope brake loading
A single cylinder 4-stroke water-cooled diesel engine developing about 7.36kw at 1500 rpm was used for the
research work. A rope brake type loading arrangement was used for loading the engine. A tachometer was used to measure the speed of the engine. The fuel flow rate was measured on the volumetric basis using a burette and a stopwatch. A digital temperature indicator was used to measure the outlet temperature of the exhaust.
III.
RESULTS AND DISCUSSIONThe performance of the engine with diesel-ethanol blend are presented and discussed below.
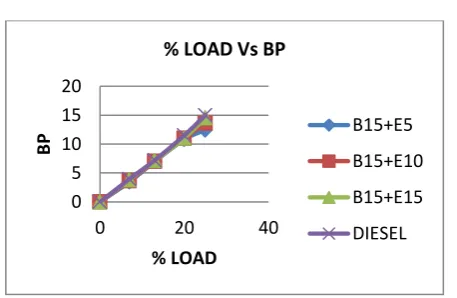
5.1 Brake power Vs % load
Figure 4. Brake power Vs % load
The influence of load on brake power for B15 biodiesel is presented in Figure-4. It can be observed from the figure that as the load increases, brake power increases to the maximum at 70% load and then decreases for all the fuel samples. When the brake power produced by the engine at different loads for different mixtures of dual fuel is compared, it is found that the brake power increases up to B15 and then it decreases.
5.2 IMEP Vs % LOAD
The variation of indicated power with brake power is shown in Fig 5. The plot it is reveals that as the load increases the indicated power decreases. The Indicated Power of karanja oil blend B15 is decreases with compared to diesel at full load condition.
0 5 10 15 20
0 20 40
BP
% LOAD
% LOAD Vs BP
B15+E5
B15+E10
B15+E15
Figure 5. IMEP Vs % LOAD
5.3 BMEP Vs % LOAD
Figure 5. BMEP Vs % LOAD
The variation of mechanical efficiency with brake power is shown in Fig. 6. From the plot it is observed as load increases mechanical efficiency is also increases for diesel as well as the blends of rice bran oil. At full load condition the mechanical efficiencies obtained 79.76% for fuels of KOME (B15) respectively. From the above results the mechanical efficiency karanja oil biodiesel B15 increases with compared diesel at full load condition.
5.4 SFC Vs % LOAD
Figure 7 shows that as the load increases, brake specific fuel consumption decreases to the minimum of at 70% load and then increases for all the fuel samples tested. This can be correlated to the test results obtained for the brake power. The specific fuel consumption (SFC) for B15 are more or less equal to that of diesel. The SFC for B30, B40, and B60 are continuously increasing and they
are less than the SFC for diesel. This may be due to the lower calorific value of biodiesel than diesel.
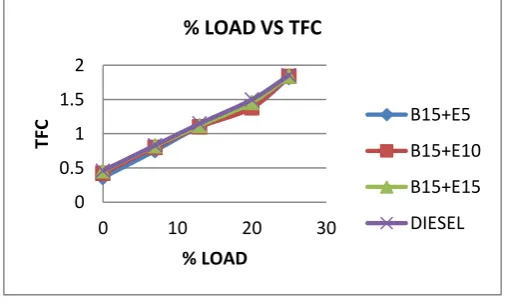
Figure 7. SFC Vs % LOAD 5.5 TFC Vs % LOAD
Figure 8 show that the total fuel consumption increases with increase in load. Total fuel consumption was least for B15 karanja biodiesel. All the three B15 blends were found to have lesser TFC when compared to diesel. At full load condition, TFC for B15 karanja biodiesel was almost 10% less than pure diesel. But TFC of B15 rapeseed was nearly equal to that of diesel.
Using additive has reduced the TFC at no load condition. At full load condition, BE-2 has lesser value of TFC than B15 blends of the three biodiesels. Moreover, TFC has reduced by more than 10% using BE-2 than pure diesel.
Figure 8. TFC Vs % LOAD
5.6 Results of B15+Methanolb15 Additives with Biodiesel Performance Results
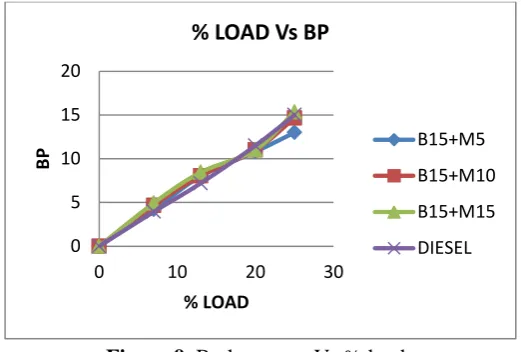
5.6 Brake power Vs % load
0 1000 2000 3000
0 10 20 30
IM
EP
% LOAD
% LOAD Vs IMEP
B15+E5
B15+E10
B15+E15
DIESEL
0 500 1000 1500 2000
0 10 20 30
B
M
EP
% LOAD
% LOAD Vs BMEP
B15+E5
B15+E10
B15+E15
DIESEL
0 0.05 0.1 0.15 0.2 0.25
0 10 20 30
SFC
% LOAD
% LOAD Vs SFC
B15+E5
B15+E10
B15+E15
DIESEL
0 0.5 1 1.5 2
0 10 20 30
TFC
% LOAD
% LOAD VS TFC
B15+E5
B15+E10
B15+E15
Figure 9. Brake power Vs % load
The influence of load on brake power for B15 biodiesel is presented in Figure 9. It can be observed from the figure that as the load increases, brake power increases to the maximum at 80% load and then decreases for all the fuel samples. When the brake power produced by the engine at different loads for different mixtures of dual fuel is compared, it is found that the brake power increases up to B15 and then it decreases.
5.7 IMEP Vs % LOAD
The variation of indicated power with brake power is shown in Fig 10. The plot it is reveals that as the load increases the indicated power decreases. The Indicated Power of karanja oil blend B15 is decreases with compared to diesel at full load condition.
Figure 10. IMEP Vs % LOAD
5.8 BMEP Vs % LOAD
The variation of mechanical efficiency with brake power is shown in Fig. 11.From the plot it is observed as load increases mechanical efficiency is also increases for
diesel as well as the blends of rice bran oil. At full load condition the mechanical efficiencies obtained 65% for fuels of KOME (B15+M15) respectively. From the above results the mechanical efficiency karanja oil biodiesel B15 increases with compared diesel at full load condition.
Figure 11. BMEP Vs % LOAD
5.9 SFC Vs % LOAD
Figure 12. SFC Vs % LOAD
Figure 12 shows that as the load increases, brake specific fuel consumption decreases to the minimum of at 70% load and then increases for all the fuel samples tested. This can be correlated to the test results obtained for the brake power. The specific fuel consumption (SFC) for B15 are more or less equal to that of diesel. The SFC for B30, B40, and B60 are continuously increasing and they are less than the SFC for diesel. This may be due to the lower calorific value of biodiesel than diesel.
5.10 TFC Vs % LOAD
0 5 10 15 20
0 10 20 30
BP
% LOAD
% LOAD Vs BP
B15+M5
B15+M10
B15+M15
DIESEL
0 1000 2000 3000 4000
0 10 20 30
IM
EP
% LOAD
% LOAD Vs IMEP
B15+M5
B15+M10
B15+M15
DIESEL
0 500 1000 1500 2000
0 10 20 30
B
M
EP
% LOAD
% LOAD Vs BMEP
B15+M5
B15+M10
B15+M15
DIESEL
-0.05 0 0.05 0.1 0.15 0.2 0.25
0 10 20 30
SFC
% LOAD
% LOAD Vs SFC
B15+M5
B15+M10
B15+M15
Figure 5.10 show that the total fuel consumption increases with increase in load. Total fuel consumption was least for B15 karanja biodiesel. All the three B15 blends were found to have lesser TFC when compared to diesel. At full load condition, TFC for B15 karanja biodiesel was almost 10% less than pure diesel. But TFC of B15 karanja seed was nearly equal to that of diesel. Using additive has reduced the TFC at no load condition. At full load condition, BE-2 has lesser value of TFC than B15 blends of the three biodiesels. Moreover, TFC has reduced by more than 6% using BE-2 than pure diesel.
Figure 13. TFC Vs % LOAD
6. Emission Parameters
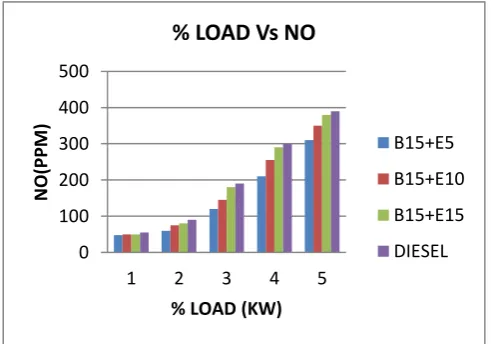
6.1 Nitric Oxide (NO)
Figure 14 shows the trend of nitric oxide emission with different blends at different loads. A majority (about 90%) of the nitrogen in the exhaust is in the form of nitric oxide. Temperature and oxygen are the two important factors which support the formation of nitric oxide.
Figure 14. Variation of nitric oxide emission with load
The slower burning character of the fuel causes a slight delay in the energy release, which results in higher temperature in the later part of power stroke and exhaust stroke. This high temperature favours the formation of nitric oxide. The higher release of nitric oxide can be attributed to presence of nitrogenous compounds in the fuels of plant origin. At higher loads, more fuel is burnt and higher temperature of the exhaust gases results in higher production of nitric oxide.
6.2 Carbon Monoxide (CO)
The emission of carbon monoxide for various blends at different loads can be seen in figure 15. The emissions are slightly higher for almost all blends. This can be attributed to higher viscosity of the fuel which results in poor atomization and incomplete combustion of the fuel. At higher load, more fuel is consumed which results in relative lowering of the availability of oxygen for the combustion of the fuel, which results in slightly higher carbon monoxide.
Figure 15. Variation of carbon monoxide emission with load
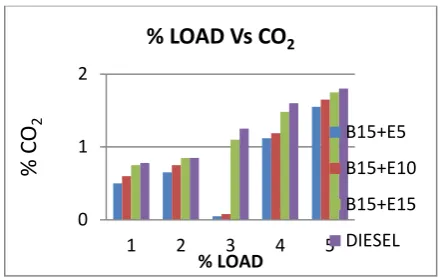
6.3 Carbon Dioxide (CO2)
Figure 16 illustrates the variation of carbon dioxide emission for various blends at varying loads. The carbon dioxide emission for the blends is higher than diesel for all loads and blends.
0 0.5 1 1.5 2
0 10 20 30
TFC
% LOAD
% LOAD VS TFC
B15+M5
B15+M10
B15+M15
DIESEL
0 100 200 300 400 500
1 2 3 4 5
N
O(PP
M
)
% LOAD (KW)
% LOAD Vs NO
B15+E5
B15+E10
B15+E15
DIESEL
0 0.05 0.1
1 2 3 4 5
%
C
O
% LOAD (KW)
% LOAD Vs CO
B15+E5
B15+E10
B15+E15
Figure 16. Variation of carbon dioxide emission with load
Carbon dioxide is formed on complete combustion of the fuel in oxygen. As the calorific value of the fuel is low, more fuel needs to be burnt to get equivalent power output. So combustion of more carbon compounds leads to higher carbon dioxide emission.
6.4 Hydrocarbons (HC)
Figure 17 shows the variation of hydrocarbon exhaust for different blends at varying loads. Hydrocarbons in exhaust are a result of incomplete burning of the carbon compounds in the fuel. Initially all blends have lower values than diesel owing to higher combustion chamber temperature which helps in cracking and faster burning.
Figure 17. Variation of unburnt hydrocarbon emission with load
But as load is increased, fuel consumption increases which results in relative reduction of oxygen in the fuel air mixture and leads to higher exhaust as compared to diesel. But Sahoo et al. [19] report reduction in HC emissions with biodiesel.
EMISSION TEST B15+METHANOL 15:
6.5 Nitric Oxide (NO)
Figure 18 shows the trend of nitric oxide emission with B15 biodiesel at different loads. A majority (about 90%) of the nitrogen in the exhaust is in the form of nitric oxide. Temperature and oxygen are the two important factors which support the formation of nitric oxide.
Figure 18. Variation of nitric oxide emission with load
The slower burning character of the fuel causes a slight delay in the energy release, which results in higher temperature in the later part of power stroke and exhaust stroke. This high temperature favours the formation of nitric oxide. The higher release of nitric oxide can be attributed to presence of nitrogenous compounds in the fuels of plant origin. At higher loads, more fuel is burnt and higher temperature of the exhaust gases results in higher production of nitric oxide.
6.6 Carbon Monoxide (CO)
The emission of carbon monoxide for B15 biodiesel at different loads can be seen in figure 19 The emissions are slightly higher for almost all blends. This can be attributed to higher viscosity of the fuel which results in poor atomization and incomplete combustion of the fuel. At higher load, more fuel is consumed which results in relative lowering of the availability of oxygen for the combustion of the fuel, which results in slightly higher carbon monoxide.
0 1 2
1 2 3 4 5
%
C
O
2% LOAD
% LOAD Vs CO
2B15+E5
B15+E10
B15+E15
DIESEL
0 5 10 15
1 2 3 4 5
%
HC
% LOAD
% LOAD Vs HC
B15+E5
B15+E10
B15+E15
DIESEL
0 100 200 300 400 500
1 2 3 4 5
NO
% LOAD
% LOAD Vs NO
B15+M5
B15+M10
B15+M15
Figure 19. Variation of carbon monoxide emission with load
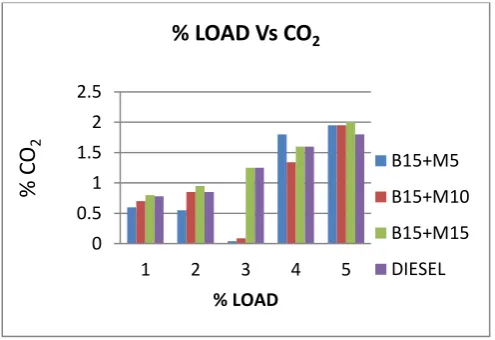
6.7 Carbon Dioxide (CO2)
Figure 20 illustrates the variation of carbon dioxide emission for B15 biodiesel at varying loads. The carbon dioxide emission for the blends is higher than diesel for all loads and blends.
Figure 20. Variation of carbon dioxide emission with load
Carbon dioxide is formed on complete combustion of the fuel in oxygen. As the calorific value of the fuel is low, more fuel needs to be burnt to get equivalent power output. So combustion of more carbon compounds leads to higher carbon dioxide emission.
6.8 Hydrocarbons (HC)
Figure 6.8 shows the variation of hydrocarbon exhaust for B15 blend of karanja oil and its varying loads. Hydrocarbons in exhaust are a result of incomplete burning of the carbon compounds in the fuel. Initially all
blends have lower values than diesel owing to higher combustion chamber temperature which helps in cracking and faster burning.
Figure 21. Variation of un burnt hydrocarbon emission with load
But as load is increased, fuel consumption increases which results in relative reduction of oxygen in the fuel air mixture and leads to higher exhaust as compared to diesel.
IV.
CONCLUSION
Production of bio-fuel from plant materials is a main step toward harnessing one of the world's most-prevalent, yet least-utilized renewable energy resources. A break through process for converting biomass into biodiesel promises an smart alternative to go green. Ethanol and methanol are the most popular and commercial bio fuel has long been refined out of plant matter, but it requires the costly, energy-intensive step of distilling every molecule of water out of the solution. In contrast, the biodiesel process is based on aqueous phase reactions, which does not to go through the expensive distillation phase.
Karanja methyl ester seems to have a potential to use as alternative fuel in diesel engines. Blending with diesel decreases the viscosity significantly. The following results are made from the experimental study-
The brake thermal efficiency of the engine with karanja methyl ester-diesel blend was marginally better than with neat diesel fuel.
0 0.1 0.2 0.3 0.4
1 2 3 4 5
%
C
O
% LOAD
% LOAD Vs CO
B15+M5
B15+M10
B15+M15
DIESEL
0 0.5 1 1.5 2 2.5
1 2 3 4 5
%
C
O
2% LOAD
% LOAD Vs CO
2B15+M5
B15+M10
B15+M15
DIESEL
0 100 200 300 400 500
1 2 3 4 5
NO
% LOAD
% LOAD Vs NO
B15+M5
B15+M10
B15+M15
Brake specific energy consumption is lower for karanja methyl ester-diesel blends than diesel at all loading.
The exhaust gas temperature is found to increase with concentration of karanja methyl ester in the fuel blend due to coarse fuel spray formation and delayed combustion.
The mechanical efficiency achieved with KME15 is higher than diesel at lower loading conditions. At higher loads, the mechanical efficiency of certain blends is almost equal to that of the diesel.
The emission characteristics are higher than the pure diesel, but the KME15 has relatively better performance with respect to other blends.
KME15 can be accepted as a suitable fuel for use in standard diesel engines and further studies can be done with certain additives to improve the emission characteristics.
V.
REFERENCES
[1] Andrzej Kowalewic, "Emission Characteristics of
Compression Ignition Engine fuelled with RME/DF and ethanol", Journal of KONES internal combustion engines, vol 11. No 1-2, 2004, pp349-357.
[2] Jincheng Huang, Yaodong Wang, Shuangding Li,
Anthony P, Roskilly, Hongdong Yu, and Huifen
Li, "Experimental investigation on the
performance and emissions of a diesel engine fuelled with ethanol-diesel blends", Applied Thermal Engineering, Volume 29, Issues 11-12, 2009.
[3] Pang X, Shi X, Mu Y, He H, Shuai S, Chen H,
and Li R, "Characteristics of carbonyl compounds from a diesel-engine using biodiesel–ethanol– diesel as fuel", Atmospheric Environment, 40, 2006, pp.7057–7065.
[4] Ribeiro N.M, Pinto A.C, Quintella C.M, da Rocha
G.O, Teixeira, L.S,.Guarieiro L.L.N, Rangel M.., Veloso M.C.C, Rezende M.J.C, Da Cru, R.S, Oliveira A.M, Torres,E.A, de Andrad, J.B, "The role of additives for diesel and diesel blended (ethanol or biodiesel) fuels: a review", Energy & Fuels 21, 2007, pp. 2433–2445.
[5] Shi X, Yu Y, He H, Shuai S, Wang J, Li R,
"Emission characteristics using methyl soyate– ethanol–diesel fuel blends on a diesel engine", Fuel 84, 2005, pp. 1543–1549.
[6] Hansen AC, Zhang Q, Lyne PWL, "Ethanol–
diesel fuel blends – a review" Bioresource Technology, 96, 2005.
[7] Hadi rahimi, Barat Ghobadian, Talal Yusaf,
Gholamhasan Najafi, Mahdi Khatamifar,
"Diesterol: An environment-friendly IC engine fuel", Renewable Energy, 34, 2009.
[8] Hwanam Kim, Byungchul Choi, "The effect of
biodiesel and bioethanol blended diesel fuel on nanoparticles and exhaust emissions from CRDI diesel engine", Renewable energy, 35, 2010.
[9] Xiaobing Pang, Xiaoyan Shi, Yujing Mu, Hong
He, shijin Shuai, Hu Chen, Rulong Li, "Characteristics of carbonyl compounds emissions from a diesel engine using biodiesel- ethanol- diesel as fuel", Atmospheric environment, 40, 2006, pp. 7057-7065.
[10] Prommes Kwanchareon, Apanee
Luengnaruemitchai, and Samai Jai-In, "Solubility of a diesel-biodiesel ethanol blend, its properties and its emission characteristics from diesel engine", DOI: 10.1016/J. Fuel.2006.09.034.
[11] Jayant Singh, T. N. Mishra, T. K. Bhattacharya,