Biological Sequence Clustering with the Symbol Table
Data Structure
Barile ´e Baridam
Department of Computer ScienceUniversity of Port Harcourt Choba, Port Harcourt
ABSTRACT
Clustering is the identification of interesting distribution patterns and similarities, natural groupings or clusters, within a collection of objects in a dataset based on some user-defined criteria. Clustering as an unsupervised learning problem can be distance-based or conceptual. In distance-based clustering the similarity criterion is based on distance. Objects belong to the same cluster if they are close according to a given distance. Conceptual clustering defines a concept common to all the objects in the cluster. In this case, objects are clustered based on their fitness to some descriptive concepts, and not according to distance or similarity measure. The extension of the usage of the common symbol table is employed in this paper to the clustering of biological sequences. The method does not depend on concept as does conceptual clustering. It does not also use distance measure, rather it uses data structures (hash table or list) and detect the occurrence of codons by way of comparing sequence to sequence (pattern-element-wise) using the codon-based scoring method. The results obtained indicate the usefulness of the symbol table in biological sequence clustering.
General Terms:
Symbol Table, Sequence Clustering
Keywords:
Clustering, Sequence, Symbol Table, Codon, Similarity measures
1. INTRODUCTION
Clustering has to do with the identification of interesting distribution patterns and similarities, natural groupings or clusters, within a collection of objects in a dataset. Clustering is an unsupervised learning problem and can be distance-based or conceptual. In distance-based clustering the similarity criterion is based on distance. Objects belong to the same cluster if they are close according to a given distance. Conceptual clustering defines a concept common to all the objects in the cluster. In this case, objects are clustered based on their fitness to some descriptive concepts, and not according to distance or similarity measure. The clustering problem can also be solved using the symbol table.
A symbol table is a compile-time data structure built up during lexical and syntactic analysis. It is used by the compiler to ensure type consistency. Type consistency check involves confirmation of the correctness of the variables, type names and functions. Type checking is done at semantic analysis stage of the program compilation process. In the management of the symbol table the following issues make the symbol table desirable: (a) the quick insertion of an identifier unto the table, (b) search for an identifier, (c) efficiency of insertion and access to information (attributes) about an identifier, and (d) time and space efficiency. A lexical analyzer is used by compilers to produce sequence of tokens from program codes. Lexical analyzer reads the program
codes (letters), and saves the letters and/or digits in a buffer. The string collected in the buffer is thereafter looked in the symbol table, using the lookup operation. If there is no entry for the string in the buffer, lookup returns 0. The buffer then contains a lexeme for a new identifier that was not found in the table. An entry for the identifier is created using insert method. The index of the symbol table entry for the string in the buffer after the insertion is made is nown+ 1. This index is communicated to the parser which in turn returns the token.
On a general programming view, a symbol table is used to associate values with keys. The application of symbol table can be extended to the design of a students database with unique security codes, Internet search with unique IP addresses, manufacturing industry with unique keys for products, intelligence monitoring system with unique keys for locations and individuals [45, 44]. In this paper the symbol table will be used in line with the codon principle implemented by COBASM in the clustering of nucleic acids sequences.
2. RELATED WORK ON CLUSTERING
Clustering is an active research area in mathematics, statistics and numerical analysis [9, 10]. Besides, clustering has been applied in the following biological areas: in p53 genetic regulatory network [29, 25], the functional partitioning of genes based on the gene ontology [49], breast and colon cancer gene expression data [22], signaling on genome evolution [32], and protein-protein interaction networks [13, 52, 4, 14, 28, 35]. Others are, on 3D microarray data [60], process monitoring and control application to continuous digesters [3], and gene expression pattern and profiles analysis [8, 46, 26, 43, 36, 57, 58, 50, 5, 24].
Clustering is employed in biology to reveal (1) evolutionary history, (2) conserved motifs or characters in nucleic or amino acids, and (3) clues about the common biological function of sequences[51]. Clustering assists in the discovery of the common 2D or 3D structure of nucleic and amino acids. Clustering also has its application in the determination of genetic network structures [51]. Also, clustering is used in the identification of transcriptional regulatory sub-networks in yeasts. Clustering, as a tool for discovering identical or related genes, helps in identifying gene function and assigning putative function to genes whose functions are unknown, and assigning similar expression to genes with known function [59].
Several methods have been employed in clustering. Conceptual clustering of nucleic acid sequences based on the codon usage model is done by Baridam and Owolabi [7]. The successful application of the average linkage hierarchical clustering algorithm for the expression data of budding yeast
Table 1. List implementation of the symbol table
Identifier Type Space(bytes)
a integer 2
b double 4
c float 4
d character 1
e boolean 1
f long 4
for example in gene expression data, has two aspects: clustering genes [8, 46], and clustering tissues or experiments [22, 24]. Other fields where clustering have been applied are in biotechnology, Web analysis, concept decomposition for large sparse data [19], high dimensional and distributed data [55, 34, 1, 2, 33], spatial data mining [9, 39], intrusion detection systems [40], imaging [41], circuit partitioning in VLSI design [17], document clustering [15], and computer vision [21]. Clustering is also applied in outlier detection or in finding unusual data objects [18].
Several clustering methods and algorithms have been proposed by researchers all occasioned by the growing concern about the quality of clusters generated by clustering algorithms. Among the clustering algorithms and methods proposed in biological sciences are: (1) CHAMELEON - used in measuring the similarity of clusters based on a dynamic model [31], (2) FOLDALIGNM - developed by Elfar Torarinsson et al [53] which makes use of multiple alignment in the clustering of RNA sequences, (3) AMICA - a metric incremental clustering algorithm [47], (4) the HMM-Clustering algorithm [48, 42], (5) WARLUS - a similarity retrieval algorithm for image databases [37], (6) Query-Dependent Banding (QDB) algorithm for RNA similarity searches [38], (7) KMS for multiple DNA sequence approximate matching [30], (8) CLARA, (9) CLARANS [39], (10) MetricMap [54], (11) QTClust algorithm employed in the identification and analysis of co-expressed genes [27], (12) CTWC algorithm for coupled two-way clustering analysis of gene microarray data [23], and (13) the 4C algorithm [11]. Eric P. Xinget al.[55] developed the CLIFF algorithm for the clustering of high-dimensional microarray data via iterative feature filtering. Zhao and Zaki [60] introduced the TRICLUSTER algorithm for the mining of coherent clusters in 3D microarray data.
3. IMPLEMENTING THE SYMBOL TABLE
It is important to note that a symbol table must allow the addition and retrieval of information. To achieve this, linear lists, hash-tables and search trees data structures are used in the implementation of the symbol table. Each of these schemes, linear list, hash-table and search tree, is evaluated on the basis of time required to addnidentifiers and makemsearches. In implementation, the linear list is simpler, space efficient, and fast insertion, but with poor performance whennandmare large. To insert an element to a table ofnelements the table would have to be searchedntimes resulting inO(n)in worst case, whereas to insertn elements, it would take O(n2)in worst case. The
time complexity for these operations (insertions and inquiries) is thereforeO(n(n+m)). On the other hand, the hash-table scheme is complicated to implement, and requires more space. However, it provides an average better performance. The search tree scheme is not as simple as the linear list. The performance rating is as well poor in comparison to the hashing scheme. The symbol table is searched every time a name is encountered in the source text. Changes to the symbol table occur if a new name or new information about an existing name is discovered. An example of a linear list implemented symbol table is given in Table 1.
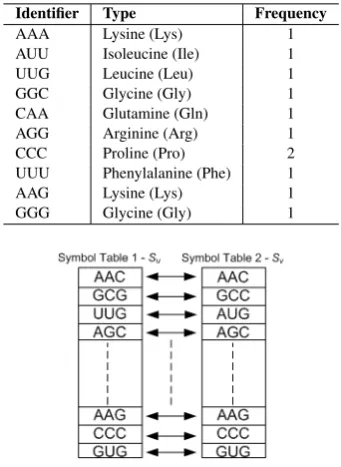
Table 2. Applying symbol table in sequence clustering
Identifier Type Frequency
AAA Lysine (Lys) 1
AUU Isoleucine (Ile) 1
UUG Leucine (Leu) 1
GGC Glycine (Gly) 1
CAA Glutamine (Gln) 1
AGG Arginine (Arg) 1
CCC Proline (Pro) 2
UUU Phenylalanine (Phe) 1
AAG Lysine (Lys) 1
GGG Glycine (Gly) 1
Fig. 1. Comparing sequences using the symbol table
4. BIOLOGICAL SEQUENCE CLUSTERING WITH SYMBOL TABLE
The linear list data structure will be used in the implementation of the symbol table used in this paper to cluster biological sequence data because of its simplicity of implementation and efficiency in relation to space. In the implementation of the symbol table to the clustering of biological sequences, codons with their corresponding code names (amino acids), as in the genetic code, are respectively used to depict identifiers and identifiers’ type. A source sequence is stored on the symbol table in the order of the occurrence of the codons. A symbol table corresponding to the constituents of the target sequence is generated. Thereafter, the target sequence is compared with the source sequence through the application of the symbol tables as shown in Figure 1. The two tables are compared based on the occurrence of the codons. Results from the comparison are stored using a boolean value (1 for true, and 0 for false) (see Table 5. The homology concept [6, 12, 16] is employed to cluster identical sequences.
Biological data being considered in this paper are those of nucleic acids - DNA and RNA. Thus biological data setSis of the form
xi= (AAAAU U U U GGGCCAAAGGCCCU U U (1)
AAGCCCGGG) for RNA
and
xi= (AAAAT T T T GGGCCAAAGGCCCT T T
(2)
AAGCCCGGG) for DNA.
Using the standard biological code (genetic code), the sequence in Equation 2 can be represented in the symbol table as given in Table 2.
sequences. The symbol table is created for each participating sequence and compared with the rest of the sequences in the data set iteratively. This method employs the creation of identifiers (codons) based on the existing source sequence. Identifiers that are not present in the source sequence are ignored. In this setup, each sequence is a potential source sequence; this means that each sequence is compared one with another. Corresponding sequences are clustered through the application of the homology principle based on the degree of closeness. It is important to note that nucleic acid sequences are considered homologous (similar) when at least 70% nucleotides are identical [16]. The homology principle is defined through the application of the codon-based scoring method (COBASM) [6].
5. THE CODON-BASED SCORING METHOD ALGORITHM
The COBASM uses the codon table (genetic code) in the clustering of biological sequences, and considers grouping the bases into three, based on their codon arrangements. The reason for considering groups of three bases is because it is biologically meaningful to consider three bases as it is useful in the formation of amino acids. Blocks of two, four or five will not give a meaningful interpretation of the concept being investigated. For example, the pairs, GC and AT, are the only compatible base pairs when considering the pairing of DNA bases in the formation of DNA’s double helix. The fact that the pair between A and C are incompatible and chemically unstable, owing to the loss of the hydrogen bond formed within the base pair, renders the choice of blocks of two, four or five irrelevant as far as this thesis is concerned. Therefore, basing the underlying concept upon a combination of bases other than the codon concept will render the algorithm ineffective and the search method inefficient.
———————————————————————— Algorithm 1: The Codon-based Scoring Method Algorithm
Step 1. Initialize source and target sequences Step 2. Compare length of sequences Step 3. Do a pattern-element-search for match
Step 4. If match = found, then score = 1; else score = 0
Step 5. Determine consecutive match Step 6. If consecutive match = 3, then
score = score+1 Step 7. GOTO Step 3
Step 8. Stop if sequence length is reached.
—————————————————————————
Letsuandsvbe the source and target sequences, respectively.
Letnrepresent the number of nucleotides in a sequence;l, the sequence length;ni, thei-th individual nucleotides (symbols) in
a sequence. The highest match count has occurred ifsuandsv
are identical, or identical and of the same lengthn. According to the definition of COBASM, the highest match count is calculated as
HCSu =i+
i 3=
4
3n. (3)
There can be any level of match count (including zero) between the source and the target sequences. The 70% homology level is now calculated from Equation (3) using
Hs=
70 100.
4 3n=
14
15n. (4)
For any two sequencessuand sv, the total match (similarity)
count,d(su, sv), is calculated using COBASM as defined in [6],
and they are considered similar if
d(su, sv)≥Hs (5)
holds.
Mathematically, COBASM can be defined as:
d(su, sv) =
PNk
i,j=1d(su[i], sv[j]) + 1 ifsu[i+ 1, i+ 2, i+ 3] =sv[j+ 1, j+ 2, j+ 3]
PNk
i,j=1d(su[i], sv[j]) Otherwise
(6) for alld(su[i], sv[j])6= 0.
6. THE CLUSTERING TASK
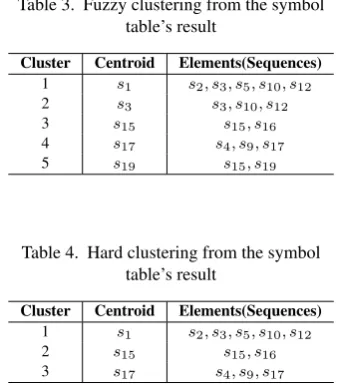
The process of clustering sequences based on the use of symbol table is very straight forward. The first sequence is picked as the initial centroid. The rest of the sequences in the data set are compared with the centroid to detect homology. The homology calculations are done per sequence. The sequence with the highest percentage homology are clustered, with the first sequence as the centroid. The next available sequence in the data set is then set as the centroid irrespective of whether it is in a cluster. The process of comparison starts again as with the first sequence. The closest sequences based on the homology principle are again grouped to form another cluster. The process starts all over again until the last sequence in the data set is clustered. The clusters generated from this initial process are then compared to find the closest sequences in the clusters. The results gives either fuzzy or hard clustering results (see Tables 3 and 4) The method initially treats all sequences as centroids, and then narrows to the most significant. So doing, eliminates the problem of convergence to a local maxima.
7. EXPERIMENTAL RESULTS
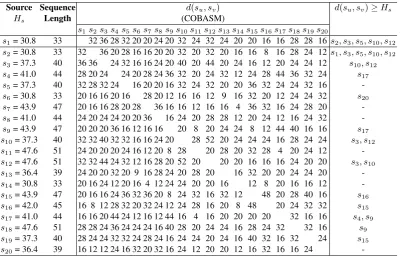
A total of 20 synthetic sequences were used for this experiment. The minimum sequence in the collection is of length 33, and the maximum 51. Part of the symbol table generated during the experiment is shown in Table 5. The result of the clustering is presented in Table 6. As already indicated, symbol tables are iteratively created, for sequences that have not been clustered, when all the elements in the data set have been examined against the source sequence. However, this only applies to sequences of least similarity with the source sequence.
Observe from Table 6 that the values ofd(su, sv) vary from
sequence to sequence when different centroid was set. As indicated earlier, individual sequences (to form centroid) were picked with their respective symbol tables. Results obtained indicates that some sequences are more similar than the other. Relationships between sequencess5ands10, s5ands12, s10and
s12, are very significant in the application of symbol table in the clustering. Observe that all sequences belonged to the same cluster whens1was set as the centroid, but the clustering ofs10
ands12is stronger than the rest of the sequences in that same cluster. Also, althoughs5, s10,ands12are in the same cluster, whens5was set as the centroid, the result became different. This same trend is noticed betweens4, s9, s17 and s15, s19. From these results, the use of symbol table becomes very important to make it easy to determine which sequence perfectly belongs to which ancestor.
as would be the case when sequences are clustered based on alignment concept.
Table 3. Fuzzy clustering from the symbol table’s result
Cluster Centroid Elements(Sequences) 1 s1 s2, s3, s5, s10, s12 2 s3 s3, s10, s12 3 s15 s15, s16 4 s17 s4, s9, s17 5 s19 s15, s19
Table 4. Hard clustering from the symbol table’s result
Cluster Centroid Elements(Sequences) 1 s1 s2, s3, s5, s10, s12 2 s15 s15, s16 3 s17 s4, s9, s17
8. CONCLUSION
This paper presented a new dimension to the clustering of biological sequences by the application of a compile-time data structure called symbol table to optimize the performance of the clustering task. Results obtained clearly shows the robustness of the method.
The method clearly eliminates the introduction of false positives and the elimination of false negatives. Although the method works differently and presents better results than clustering with sequence alignment, there could be slight similarity in clustering results with conceptual clustering when strict adherence to the genetic code is observed.
9. REFERENCES
[1] C. C. Aggarwal and P. S. Yu. Finding generalized projected clusters in high dimensional spaces. In ACM SIGMOD, pages 70–81, 2000.
[2] R. Agrawal, J. E. Gehrke, D. Gunopulos, and P. Raghavan. Automatic subspace clustering of high dimensional data for data mining applications. InACM SIGMOD, 1998. [3] T. Ahvenlampi and U. Kortela. Clustering algorithms in
process monitoring and control application to continuous digesters.Informatics, 29:101–109, 2005.
[4] G. D. Bader and C. W. Hogue. An automated method for finding molecular complexes in large protein interaction networks.BMC Bioinformatics, 4(2):448–456, 2003. [5] Z. Bar-Joseph, E. D. Demaine, D. K. Gifford, N. Srebro,
A. M. Hamel, and T. S. Jaakkola. K-ary clustering with optimal leaf ordering for gene expression data.
Bioinformatics, 19(9):1070–1078, July 2003.
[6] B. B Baridam. A scoring method for the clustering of nucleic acid sequences.International Journal of Computer Applications, 44(2):14–22, 2012.
[7] B. B. Baridam and O. Owolabi. Conceptual clustering of RNA sequences with codon usage mode.Global Journal of Computer Science and Technology, 10(8), 2010. [8] A. Ben-Dor, R. Shamir, and Z. Yakhini. Clustering gene
expression patterns. Journal of Computational Biology, 6(3/4), 2005.
[9] P. Berkhin. Survey of clustering data mining techniques. Technical Report 4, Accrue Software, Inc., San Jose, California, 2002. Available online: [www.citeseer.nj. nec.com/berkhin02survey.html].
[10] D. A. Binder.Cluster analysis under parametric models. Phd thesis, University of London, 1977.
[11] C. Bohm, K. Kailing, P. Kroger, and A. Zimek. Computing clusters of correlation connected objects. InACM SIGMOD Conference, 2004.
[12] P. E. Bourne and H. Weissig. In Phillip Bourne and Helge Weissig, editors,Structural Bioinformatics, pages 35–49. Wiley-Liss, Inc., Hoboken, New Jersey, 2003.
[13] S. Broh´ee and J. van Helden. Evaluation of clustering algorithms for protein-protein interaction networks.BMC Bioinformatics, 7(488), 2006. Available online: [www. biomedcentral.com/1471-2105/7/488].
[14] C. Brun, C. Herrmann, and A. Gu´enoche. Clustering proteins from interaction networks for the prediction of cellular functions.BMC Bioinformatics, 5(95), 2004. [15] H. Chim and X. Deng. A new suffix tree similarity
measure for document clustering. In Proceedings of the 16th international conference on World Wide Web, pages 121–130. ACM, 2007.
[16] J. Claverie and C. Notredame.Bioinformatics for dummies. Wiley, Indiana, 2nd edition, 2007.
[17] J. Cong and M. Smith. A parallel bottom-up clustering algorithm with applications to circuit partitioning in vlsi design. In Proceedings of the 30th ACM/IEEE Design Automation Conference, pages 755–760, 1993.
[18] S. J. Devlin, R. Gnanadesikan, and J. R. Kettenring. Robust estimation and outlier detection with correlation coefficients.Biometrika, 62(3):531–545, 1975.
[19] I. S. Dhillon and D. S. Modha. Concept decompositions for large sparse text data using clustering.Machine Learning, 42:143–175, 2001.
[20] M. Eisen, P. Spellman, P. Brown, and D. Botstein. Cluster analysis and display of genome-wide expression patterns. In Proceedings National Academy of Science, USA, volume 95, pages 14863–14868, 1998.
[21] H. Frigui and R. Krishnapuram. A robust competitive clustering algorithm with applications in computer vision. In IEEE Transactions on Pattern Analysis and Machine Intelligence, volume 21, pages 450–465, May 1999. [22] G. Getz, H. Gal, I. Kela, D. A. Notterman, and E. Domany.
Coupled two-way clustering analysis of breast cancer and colon cancer gene expression data. Bioinformatics, 19(9):1079–1089, 2003.
[23] G. Getz, E. Levine, and E. Domany. Coupled two-way clustering analysis of gene microarray data. InProceedings of National Academy of Science, USA, volume 97, pages 12079–12084, 2000.
[24] G. Getz, E. Levine, E. Domany, and M. Q. Zhang. Super-parametric clustering of yeast gene expression profiles.
Physica A, 279:457–464, 2000.
[25] J. S. Hallinan. Cluster analysis of the p53 genetic regulatory network: Topology and biology. InProceedings of the 2004 IEEE Symposium on Computational Intelligence in Bioinformatics and Computational Biology, pages 1–8, October 2004.
Table 5. Implementation of the symbol table for sequence clustering
Identifier Type Frequency Contains identifier?
s2s3s4s5s6s7s8s9s10s11s12s13s14s15s16s17s18s19s20
AAA Lysine (Lys) 1 1 1 1 0 0 1 1 0 1 1 1 1 0 1 1 0 1 1 0
AUU Isoleucine (Ile) 1 1 1 1 1 0 0 1 1 1 1 1 1 1 0 0 1 0 1 1
UUG Leucine (Leu) 1 0 0 1 1 1 1 1 0 0 1 0 1 0 1 1 0 0 1 1
GGC Glycine (Gly) 1 1 1 1 1 0 0 0 0 1 1 1 0 0 1 0 0 1 1 0
CAA Glutamine (Gln) 1 1 1 0 1 1 0 0 1 1 0 1 0 1 1 0 0 1 1 0
AGG Arginine (Arg) 1 1 1 1 1 0 1 1 1 1 0 1 1 0 0 1 1 1 1 0
CCC Proline (Pro) 2 1 1 1 1 1 1 1 1 1 0 1 0 0 0 0 1 1 0 1
UUU Phenylalanine (Phe) 1 1 1 0 0 1 0 1 1 1 1 1 1 1 0 0 0 1 0 1
AAG Lysine (Lys) 1 0 1 1 1 0 0 0 0 1 0 1 0 1 0 1 1 0 0 0
GGG Glycine (Gly) 1 1 1 0 1 1 1 0 0 0 1 0 1 1 1 0 0 1 1 0
Table 6. Results of sequence clustering with symbol table
Source Sequence d(su, sv) d(su, sv)≥Hs
Hs Length (COBASM)
s1s2s3s4s5s6s7s8s9s10s11s12s13s14s15s16s17s18s19s20
s1= 30.8 33 32 36 28 32 20 20 24 20 32 24 32 24 20 20 16 16 28 28 16s2, s3, s5, s10, s12 s2= 30.8 33 32 36 20 28 16 16 20 20 32 20 32 20 16 16 8 16 28 24 12s1, s3, s5, s10, s12 s3= 37.3 40 36 36 24 32 16 16 24 20 40 20 44 20 24 16 12 20 24 24 12 s10, s12 s4= 41.0 44 28 20 24 24 20 28 24 36 32 20 24 32 12 24 28 44 36 32 24 s17 s5= 37.3 40 32 28 32 24 16 20 20 16 32 24 32 20 20 36 32 24 24 32 16
-s6= 30.8 33 20 16 16 20 16 28 20 12 16 16 12 9 16 32 20 12 24 24 32 s20 s7= 43.9 47 20 16 16 28 20 28 36 16 16 12 16 16 4 36 32 16 24 28 20
-s8= 41.0 44 24 20 24 24 20 20 36 16 24 20 28 28 12 20 24 12 16 24 32
-s9= 43.9 47 20 20 20 36 16 12 16 16 20 8 20 24 24 8 12 44 40 16 16 s17 s10= 37.3 40 32 32 40 32 32 16 16 24 20 28 52 20 24 24 24 16 28 24 24 s3, s12 s11= 47.6 51 24 20 20 20 24 16 12 20 8 28 20 28 20 32 28 4 20 24 12
-s12= 47.6 51 32 32 44 24 32 12 16 28 20 52 20 20 20 16 16 16 24 20 20 s3, s10 s13= 36.4 39 24 20 20 32 20 9 16 28 24 20 28 20 16 32 20 20 24 24 20
-s14= 30.8 33 20 16 24 12 20 16 4 12 24 24 20 20 16 12 8 20 16 16 12
-s15= 43.9 47 20 16 16 24 36 32 36 20 8 24 32 16 32 12 48 20 28 40 16 s16 s16= 42.0 45 16 8 12 28 32 20 32 24 12 24 28 16 20 8 48 20 24 32 32 s15 s17= 41.0 44 16 16 20 44 24 12 16 12 44 16 4 16 20 20 20 20 32 16 16 s4, s9 s18= 47.6 51 28 28 24 36 24 24 24 16 40 28 20 24 24 16 28 24 32 32 16 s9 s19= 37.3 40 28 24 24 32 32 24 28 24 16 24 24 20 24 16 40 32 16 32 24 s15 s20= 36.4 39 16 12 12 24 16 32 20 32 16 24 12 20 20 12 16 32 16 16 24
-[27] L. J. Heyer, S. Kruglyak, and S. Yooseph. Exploring expression data: Identification and analysis of coexpressed genes.Genome Research, 9:1106–1115, 1999.
[28] X. Hu, I. Yoo, I. Song, M. Song, J. Han, and M. Lechner. Extracting and mining protein-protein interaction network from biomedical literature. In Proceedings of the IEEE Symposium on Computational Intelligence in Bioinformatics and Computational Biology, pages 244–251, 2004.
[29] K. Kannan, N. Amariglio, G. Rechavi, J. Jakob-Hirsch, I. Kela, N. Kaminski, G. Getz, and E. Domany. DNA microarrays identification of primary and secondary target genes regulated by p53.Oncogene, 20:2225–2234, 2001. [30] K. M. Kaplan and J. J. Kaplan. Multiple DNA
sequence approximate matching. In Proceedings of the IEEE Symposium on Computational Intelligence in Bioinformatics and Computational Biology, pages 79–86, 2004.
[31] G. Karypis, E. Han, and V. Kumar. CHAMELEON: A hierarchical clustering algorithm using dynamic modeling.
IEEE Transaction on Computers, 32(8):68–75, 1999. [32] V. Kirzhner, A. Paz, Z. Volkovich, E. Nevo, and A. Korol.
Different clustering of genomes across life using the
A-T-C-G and degenerate R-Y alphabets: Early and late signaling on genome evolution. Journal of Molecular Evolution, 64:448–456, 2007.
[33] T. Li, S. Zhu, and M. Ogihara. Algorithms for clustering high dimensional and distributed data. Intelligent Data Analysis, 7(4):305–326, 2003.
[34] J. Liu and W. Wang. OP-cluster: Clustering by tendency in high dimensional space. InProceedings of the Third IEEE International Conference on Data Mining, 2003.
[35] H. Lu, X. Zhu, H. Liu, G. Skogerbo, J. Zhang, Y. Zhang, L. Cai, Y. Zhao, S. Sun, J. Xu, D. Bu, and R. Chen. The interactome as a tree - an attempt to visualize the protein-protein interaction network in yeast.Nucleic Acids Research, 32(16):4804–4811, 2004.
[36] C. S. Moller-Levet, F. Klowonn, K. H. Cho, H. Yin, and O. Wolkenhauer. Clustering of unevenly sampled gene expression time-series data.Fuzzy Sets and Systems, 152:49–66, 2005.
[37] A. Natsev, R. Rastogi, and K. Shim. WALRUS: A similarity retrieval algorithm for image databases.
[38] E. P. Nawrocki and S. R. Eddy. Query-dependent banding (QDB) for faster RNA similarity searches.PLOS Computational Biology, 3(3):0540–0554, 2007.
[39] R. Ng and J. Han. CLARANS: A method for clustering objects for spartial data mining. IEEE Transaction on Knowledge and Data Engineering, 14(5):1003–1016, 2004.
[40] V. Nikulin. Weighted threshold-based clustering for intrusion detection system. International Journal of Computational Intelligence and Applications, 6(1):31–19, 2006.
[41] M. G. H. Omran.Particle Swarm Optimization Methods for Pattern Recognition and Image Processing. Phd thesis, University of Pretoria, Faculty of Engineering, Built Environment and Information Technology, Department of Computer Science, November 2004.
[42] F. Porikli. Clustering variable length sequences by eigenvector decomposition using HMM. Springer, 3138, 2004.
[43] M. F. Ramoni, P. Sebastiani, and I. I. Kohane. Cluster analysis of gene expression dynamics. InProceedings of National Academy of Science, volume 99, pages 9121– 9126, July 2002.
[44] R. Sedgewick and M. Schidlowsky. Algorithms in Java, Part 5: Graph Algorithms. Addison-Wesley Longman Publishing Co., Inc., 2003.
[45] R. Sedgewick and K. Wayne.Introduction to programming in Java: an interdisciplinary approach. Addison-Wesley Publishing Company, 2007.
[46] R. Sharan and R. Shamir. CLICK: A clustering algorithm with applications to gene expression analysis. In
Proceedings of International Conference on Intelligent Systems and Molecular Biology, volume 8, pages 307–316, 2000.
[47] D. Simovici, N. Singla, and M. Kuperberg. Metric incremental clustering of nominal data. InProceedings of the Fourth IEEE International Conference on Data Mining (ICDM’04), volume 00, pages 523–526, 2004.
[48] P. Smyth. Clustering sequences with hidden markov models. Advances in Neural Information Processing Systems, 648, 1997.
[49] N. Speer, C. Spieth, and A. Zell. A mimetic clustering algorithm for the functional partition of genes based on the gene ontology. InProceedings of the IEEE Symposium on Computational Intelligence in Bioinformatics and Computational Biology, pages 252–259, 2004.
[50] C. Tang, L. Zhang, and A. Zhang. Interrelated two-way clustering: An unsupervised approach for gene expression data analysis. In Proceedings of the IEEE 2nd International Symposium on Bioinformatics and Bioengineering Conference, pages 41–48, November 2001. [51] S. Tavazoie, J. Hughes, M. Campbell, R. Cho, and G. Church. Systematic determination of genetic network architecture.Nature genetics, 22:281–285, 2001.
[52] I. Tetko, A. Facius, A. Ruepp, and H. Mewes. Super parametric clustering of protein sequences. BMC Bioinformatics, 6(82), 2005.
[53] E. Torarinsson, J. H. Havgaard, and J. Gorodkin. Multiple structure alignment and clustering of RNA sequences.
Bioinformatics, 23(8):926–932, 2007.
[54] X. Wang, J. T. Wang, K. Lin, D. Shasha, B. A. Shapiro, and K. Zhang. An index structure for data mining and clustering.Knowledge and Information Systems, 2(2):161– 184, June 2000.
[55] E. P. Xing and R. M. Karp. CLIFF: Clustering of high-dimensional microarray data via iterative feature filtering using normalized cuts. Bioinformatics, 17(1):306–315, 2001.
[56] R. Xu and D. Wunsch II. Survey of clustering algorithms.
IEEE Transactions on Neural Networks, 16(3):601–614, May 2005.
[57] Y. Xu, V. Olman, and D. Xu. Clustering gene expression data using a graph theoretic approach: an application of minimum spanning trees.Bioinformatics, 18(4):536–545, 2002.
[58] K. Y. Yeung, D. R. Haynor, and W. L. Ruzzo. Validating clustering for gene expression data. Bioinformatics, 17(4):309–318, 2001.
[59] S. Yoo, C. Park, and S. Cho. Analyzing fuzzy partitions of saccharomyces cerevisiae cell-cycle gene expression data by bayesian validation method. In Proceedings of the IEEE Symposium on Computational Intelligence in Bioinformatics and Computational Biology, pages 116– 122, 2004.