University of South Carolina
Scholar Commons
Theses and Dissertations
2017
Assessing Aberrant Glycosylation With Synthetic
Lectins To Detect And Stage Prostate Cancer
Anna Veldkamp
University of South Carolina
Follow this and additional works at:https://scholarcommons.sc.edu/etd Part of theChemistry Commons
Recommended Citation
A
SSESSINGA
BERRANTG
LYCOSYLATIONW
ITHS
YNTHETICL
ECTINS TOD
ETECT ANDS
TAGEP
ROSTATEC
ANCERby
Anna Veldkamp
Bachelor of Science
Georgia Southern University, 2011
Submitted in Partial Fulfillment of the Requirements
For the Degree of Doctor of Philosophy in
Chemistry
College of Arts and Sciences
University of South Carolina
2017
Accepted by:
John J. Lavigne, Major Professor
Caryn Outten, Chair, Examining Committee
Andrew Greytak, Committee Member
Marjorette Pena, Committee Member
DEDICATION
This work is dedicated to my parents, Kenneth and Ruth Veldkamp, who are the
strongest and most wonderful people I know. Without your guidance, love, and support, I
ACKNOWLEDGMENTS
Those of you who know me will know that this is the hardest part for me. There is
no way I could ever show the gratitude and appreciation I have for everyone that has
helped me throughout this degree (and life) but I will try to do my best.
To God, thank you for blessing me with the life I have. Thank you for all of the
people mentioned in this acknowledgment and all of the wonderful things you have
placed before me. It is through you that all things are possible.
Mom and Dad, thank you for always believing in me and never letting me give up. You
have made me the person I am today. Thank you for loving me even with all of my
mistakes and faults. I can never express my gratitude for everything you have done to
make my life what it has been.
To Leah, thank you for showing me the love only a sister could. You have shown me that
love can exist between two people no matter their differences or disagreements. You have
always been the strong support I needed. I am amazed by your tenaciousness. You have
taught me to always stay firm with what I believe and not let anyone change it. Thank
you to James for being the best brother-in-law I could have hoped for and thank you for
loving and supporting me just like my sister does.
To Matthew, thank you for choosing to do life with me. You are the person that sees the
me that God is the reason for everything. I love you so much more than I could ever
express.
To my friends throughout my life that has made life fun and worth living (Courtney,
Erica, Vinnie, Matt, Alicia, Tony, Martina, Steven, Jung), thank you. I will cherish the
good times always. Shawna, thank you for being my “ride or die.” You were my ray of
sunshine through the darkest part of life. I wouldn’t have made it through without you.
To my lab members, thank you. Min, Shakena, Xiaoning, and Matt, thank you for your
willingness to help me and teach me how to be a graduate student. Vinnie, I am so
thankful we joined the same lab. It was less scary being new with you. To the girls
(Kathy, Erin, and Tanya), thank you for putting up with my unwarranted mood swings. It
is our little group of 4 (withstanding two to three hour subgroup meetings and lab
“cleanups”) that I will remember most about lab. Kathy, thank you for your support. You
always gave the comforting words of encouragement I needed through my candidacy
“hurdles.” Tanya, thank you for being as sweet and supportive as you are and thank you
for always finding food with me.
To Erin, thank you is not enough. I have never met someone who
complements/completes the person I am better than you. Thank you for being whatever I
needed (a rock, a shoulder to cry on, a planner, a cook, a statistician, a drinking buddy, an
aunt to my fur babies) without me even telling you and for being a pseudo-adult with me.
You are my second half and graduate school would not have been possible without you.
God knew what he was doing when he placed you in my life. I never want to forget how
To my committee members, thank you for always pushing me to be my best and for
always having an open door policy. I am so thankful that each of you said yes when I
asked for you to be on my committee.
And last but definitely not least, to Dr. Lavigne, thank you. Thank you for putting up with
all of the tears. I’m sure I owe you many boxes of tissues. No other professor would have
put up with all of the emotional breakdowns that you have and I cannot be more thankful
that you did. You invited me to join your group and took a chance on me knowing that I
didn’t know anything (735). You have not only been my research advisor; you have also
been a life coach, mentor, and friend. If I can say I know any chemistry at all, it is
because you taught it to me. Thank you for everything and thank you for teaching me the
ABSTRACT
Aberrant glycosylation takes place during the onset of cancer and throughout the
progression of the disease allowing certain glycans to serve as biomarkers1. Boronic acid
functionalized synthetic lectins (SLs) have been shown to bind selectively and
cross-reactively to certain glycoproteins through covalent yet reversible interactions between
the boronic acids and 1,2- or 1,3-diols found on saccharides2. This project focuses on 1)
data acquisition optimization of an existing SL array; 2) the identification, isolation, and
characterization of new SLs that interact with proteins and glycoproteins targeting the
prostate and prostate cancer; and 3) the utilization of new SLs in cross-reactive sensor
arrays to distinguish between prostate cells with differing metastatic potential. This
differentiation is based on the ability of the SLs to detect the subtle glycan changes in
diseased cells. The results presented in this dissertation highlight the immense potential
TABLE OF CONTENTS
DEDICATION ... iii
ACKNOWLEDGMENTS ... iv
ABSTRACT ... vii
LIST OF TABLES ... xi
LIST OF FIGURES ... xii
LIST OF ABBREVIATIONS ... xviii
: INTRODUCTION AND BACKGROUND ... 1
CHAPTER 1 1.0 ABSTRACT ... 1
1.1 CANCER STATISTICS ... 1
1.2 CANCER DETECTION AND DIAGNOSIS ... 1
1.3 ABERRANT GLYOSYLATION ... 3
1.4 CANCER ASSOCIATED GLYCANS ... 4
1.5 DETECTION OF GLYCANS ... 6
1.6 BORONIC ACID-DIOL INTERACTION ... 6
1.7 BORONIC ACID FUNCTIONALIZED SENSORS ... 8
1.8 BORONIC ACID FUNCTIONALIZED SYNTHETIC LECTINS ... 11
1.9 THE NEED FOR NEW SLs ... 14
2.3 EDMAN DEGREDATION ... 17
2.4 SCREENING AGAINST MEMBRANE EXTRACTED GLYCOPROTEINS ... 20
2.5 DUAL DYE SCREENING ... 25
2.6 RESYNTHESIZING SL10-14 ... 27
2.7 CONCLUSION ... 27
2.8 EXPERIMENTAL METHODS ... 28
: PROSTATE SELECTED SYNTHETIC LECTINS ... 33
CHAPTER 3 3.1 CROSS-REACTIVITY WITH PROSTATE CELL LINES ... 33
3.2 SL10-14 PROSTATE CELL LINE DISCRIMINATION ... 34
3.3 PROSTATE CANCER VS. COLON CANCER ... 37
3.4 THE UTILITY OF SL11 ... 37
3.5 TWO PBA VS. THREE PBA ... 38
3.6 CONCLUSION ... 39
3.7 EXPERIMENTAL METHODS ... 41
: OPTIMIZATION OF DATA ACQUISITION ... 46
CHAPTER 4 4.1 SL ARRAY DATA ACQUISITION ... 46
4.2 OBTAINING DATA FOR MATLAB ... 46
4.3 MATLAB ... 47
4.4 REGION OF INTEREST ... 48
4.5 COLOR SPACES ... 49
4.6 CONCLUSION ... 50
4.7 EXPERIMENTAL METHODS ... 51
REFERENCES ... 57
APPENDIX A : SL IMAGING MATLAB CODE ... 60
LIST OF TABLES
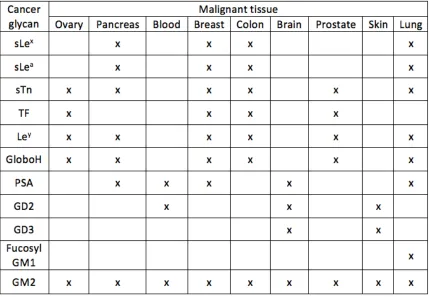
Table 1.1 Common overexpression patterns of cancer associated glycans on malignant
tissues18. ... 5
Table 1.2 Sequences of SLs screened against purified glycoproteins PSM and OVA. .... 12
Table 2.1 SL10-14 sequences, selectivity and the analyte it was screened against. ... 24
Table 3.1 Prostate cell lines with metastatic potential listed. ... 33
Table 3.2 Prostate and colon cell lines with metastatic potential listed. ... 37
Table 3.3 Classification matrix for SL11 with prostate cell lines generated by LDA. ... 38
Table 4.1 SL sequences used in colon cancer array. ... 46
LIST OF FIGURES
Figure 1.1 Aberrant Glycosylation. After the onset of cancer, normal glycan structures (the green chains on the left) are altered. The glycans can be over, under, or newly
expressed, represented in the red and yellow chains. ... 4
Figure 1.2 Common cancer associated glycan structures. ... 4
Figure 1.3 Interaction between boronic acids and 1,2- or 1,3- cis diols. ... 6
Figure 1.4 The equilibrium between phenylboronic acid and a diol. ... 7
Figure 1.5 An aminomethyl group ortho to phenylboronic acid facilitates binding with diols at physiological pH. ... 8
Figure 1.6 Structures of boronic acid functionalized sensors used for sugar sensing. (a) first fluorescent probe, (b) Intramolecular charge transfer (ICT) sensors, (c-e) Photoinduced electron transfer (PET) sensors, (f-g) electrochemical sensors. ... 9
Figure 1.7 Cartoon of cross-reactive sensors/receptors arranged into a sensor array. In this figure, four of the receptors bind to a single analyte differently. The combined signals from the receptors create a unique pattern for the analyte. ... 12
Figure 1.8 SL cross-reactive sensor array discriminating seven colon cell types. A) The two-dimensional (2-D) LDA score plot of the SL array discriminating seven colon cell types. The green curved lines highlight the separation of healthy, cancerous/non-metastatic, and cancerous/metastatic cell types. B) Leave-one-out cross validation classification matrix for the discrimination of the seven colon cell types. Overall classification accuracy was 92% with a classification error of 8%. The expected chance accuracy of the SL array was 14.3%. ... 13
Figure 2.2 Mechanism for Edman Degradation. The N-terminus amino group reacts with phenyl isothiocyanate under basic conditions. The resulting cyclic phenylthiocarbamoyl derivative is then cleaved under strong acidic conditions to produce an anilinothiazolinone derivative, which is selectively extracted with an organic solvent. The derivative is then converted to phenylthiohydrantoin (PTH) under strong acidic conditions. ... 18
Figure 2.3 Fmoc deprotection mechanism. Under basic conditions, the fluorenyl proton is deprotected to which produces the deprotected amino group, dibenzofulvene, and carbon dioxide. ... 19
Figure 2.4 Orbitrap LC chromatogram of SL11. ... 20
Figure 2.5 Orbitrap MS spectrum of SL11. The 1751 peak correlates with the total weight of SL11 with 3 PBA groups. ... 20
Figure 2.6 Workflow for screening a SL library to identify hits. Prostate cells are cultured and the membrane proteins and glycoproteins were extracted with Qiagen Plasma Membrane Protein Kit. After the extraction, the sample was labeled with fluorescein and then incubated with the SL library. The unbound fluorescent sample was washed away and library resin that was fluorescent were identified and isolated for sequencing. ... 22
Figure 2.7 SL10 hit located in the top left of the frame. This SL was screened against F-PC3. ... 23
Figure 2.8 SL13 hit located in the top right of the frame. This SL was screened against F-RWPE-1. ... 23
Figure 2.9 SL14 hit located in the top right of the frame. This SL was screed against R-PC3. ... 23
Figure 2.10 Dual Dye Screening Process. In order to select SLs that were selective, a dual dye screening process was used. In this process, the membrane glycoproteins from two different cell lines, one non-cancerous and the other cancerous-metastatic, were labeled with fluorescent dyes of different colors. In this figure, the non-cancerous glycoproteins were labeled with fluorescein and the cancerous-metastatic glycoproteins were labeled with rhodamine. ... 25
Figure 2.11 SL11 hit. This hit was found by dual dye screening with F-RWPE-1 and R-PC3. The hit is located in the bottom middle part of the right frame. ... 26
Figure 2.12 SL12 hit. This hit was found by dual dye screening with F-RWPE-1 and R-PC3. The hit is located in the middle part of the left frame. ... 27
Figure 3.2 LDA plot of SL10-14 classified by prostate cell line. ... 35
Figure 3.3 LDA of SL10-14 classified by metastatic potential. ... 36
Figure 3.4 LDA of SL1, 3, 4, 5 and SL10-14 Prostate by metastatic potential. ... 36
Figure 3.5 LDA plot of SL10 2BA-SL14 2BA classified by metastatic potential. ... 39
Figure 4.1 LDA plot for discrimination of three colon cancer cell lines by metastatic potential. This analysis was based on data acquisition without an ROI. ... 48
Figure 4.2 LDA plot for discrimination of three colon cancer cell lines by metastatic potential. This analysis was based on data acquisition with an ROI. ... 49
Figure 4.3 LDA plot for discrimination of three colon cancer cell lines by metastatic potential. This analysis was based on data acquisition using only bright numbers. . 50
Figure 4.4 LDA plot for discrimination of three colon cancer cell lines by metastatic potential. This analysis was based on data acquisition using all three color spaces. 50 Figure 5.1 SL10 AA 8. The sequence of SL10 is R-L-D*-A-R-S-D*-G-B-B-R-M. R is a fixed position in the SL library. ... 77
Figure 5.2: SL10 AA 7. The sequence of SL10 is R-L-D*-A-R-S-D*-G-B-B-R-M. L is a random position in the SL library. ... 78
Figure 5.3: SL10 AA 6. The sequence of SL10 is R-L-D*-A-R-S-D*-G-B-B-R-M. D* is a fixed position in the library and is not recognized by Edman Degradation. The fixed position of this AA identifies where it falls in the SL sequence. It is also important to note that while L does show in the cycle of the sequence, the amount decreases from the cycle before. ... 79
Figure 5.4: SL10 AA 5. The sequence of SL10 is R-L-D*-A-R-S-D*-G-B-B-R-M. A is a random position in the library. ... 80
Figure 5.5: SL10 AA 4. The sequence of SL10 is R-L-D*-A-R-S-D*-G-B-B-R-M. R is a random position in the library. ... 81
Figure 5.6: SL10 AA 3. The sequence of SL10 is R-L-D*-A-R-S-D*-G-B-B-R-M. S is a random position in the library. ... 82
Figure 5.8: SL10 AA 1. The sequence of SL10 is R-L-D*-A-R-S-D*-G-B-B-R-M. G is a random position in the library. ... 84
Figure 5.9: SL11 AA 8. The sequence of SL11 is R-L-D*-Y-L-T-D*-R-B-B-R-M. R is a fixed position in library. ... 85
Figure 5.10: SL11 AA 7. The sequence of SL11 is R-L-D*-Y-L-T-D*-R-B-B-R-M. L is a random position in library. ... 86
Figure 5.11: SL11 AA 6. The sequence of SL11 is R-L-D*-Y-L-T-D*-R-B-B-R-M. D* is a fixed position in library. ... 87
Figure 5.12: SL11 AA 5. The sequence of SL11 is R-L-D*-Y-L-T-D*-R-B-B-R-M. Y is a random position in library. ... 88
Figure 5.13: SL11 AA 4. The sequence of SL11 is R-L-D*-Y-L-T-D*-R-B-B-R-M. L is a random position in library. ... 89
Figure 5.14: SL11 AA 3. The sequence of SL11 is R-L-D*-Y-L-T-D*-R-B-B-R-M. T is a random position in library. ... 90
Figure 5.15: SL11 AA 2. The sequence of SL11 is R-L-D*-Y-L-T-D*-R-B-B-R-M. D* is a random position in library. ... 91
Figure 5.16: SL11 AA 1. The sequence of SL11 is R-L-D*-Y-L-T-D*-R-B-B-R-M. R is a random position in library. ... 92
Figure 5.17: SL12 AA 8. The sequence of SL12 is R-L-D*-G-F-Y-D*-Q-B-B-R-M. R is a fixed position in library. ... 93
Figure 5.18: SL12 AA 7. The sequence of SL12 is R-L-D*-G-F-Y-D*-Q-B-B-R-M. L is a random position in library. ... 94
Figure 5.19: SL12 AA 6. The sequence of SL12 is R-L-D*-G-F-Y-D*-Q-B-B-R-M. D* is a fixed position in library. ... 95
Figure 5.20: SL12 AA 5. The sequence of SL12 is R-L-D*-G-F-Y-D*-Q-B-B-R-M. G is a random position in library. ... 96
Figure 5.21: SL12 AA 4. The sequence of SL12 is R-L-D*-G-F-Y-D*-Q-B-B-R-M. F is a random position in library. ... 97
Figure 5.23: SL12 AA 2. The sequence of SL12 is R-L-D*-G-F-Y-D*-Q-B-B-R-M. D* is a fixed position in library. ... 99
Figure 5.24: SL12 AA 1. The sequence of SL12 is R-L-D*-G-F-Y-D*-Q-B-B-R-M. Q is a random position in library. ... 100
Figure 5.25: SL13 AA 8. The sequence of SL13 is R-T-D*-G-L-A-D*-V-B-B-R-M. R is a fixed position in library. ... 101
Figure 5.26: SL13 AA 7. The sequence of SL13 is R-T-D*-G-L-A-D*-V-B-B-R-M. T is a random position in library. ... 102
Figure 5.27: SL13 AA 6. The sequence of SL13 is R-T-D*-G-L-A-D*-V-B-B-R-M. D* is a fixed position in library. ... 103
Figure 5.28: SL13 AA 5. The sequence of SL13 is R-T-D*-G-L-A-D*-V-B-B-R-M. G is a random position in library. ... 104
Figure 5.29: SL13 AA 4. The sequence of SL13 is R-T-D*-G-L-A-D*-V-B-B-R-M. L is a random position in library. ... 105
Figure 5.30: SL13 AA 3. The sequence of SL13 is R-T-D*-G-L-A-D*-V-B-B-R-M. A is a random position in library. ... 106
Figure 5.31: SL13 AA 2. The sequence of SL13 is R-T-D*-G-L-A-D*-V-B-B-R-M. D* is a fixed position in library. ... 107
Figure 5.32: SL13 AA 1. The sequence of SL13 is R-T-D*-G-L-A-D*-V-B-B-R-M. V is a random position in library. ... 108
Figure 5.33: SL14 AA 8. The sequence of SL14 is R-Y-D*-R-A-S-D*-V-B-B-R-M. R is a fixed position in library. ... 109
Figure 5.34: SL14 AA 7. The sequence of SL14 is R-Y-D*-R-A-S-D*-V-B-B-R-M. Y is a random position in library. ... 110
Figure 5.35: SL14 AA 6. The sequence of SL14 is R-Y-D*-R-A-S-D*-V-B-B-R-M. D* is a fixed position in library. ... 111
Figure 5.36: SL14 AA 5. The sequence of SL14 is R-Y-D*-R-A-S-D*-V-B-B-R-M. R is a random position in library. ... 112
Figure 5.38: SL14 AA 3. The sequence of SL14 is R-Y-D*-R-A-S-D*-V-B-B-R-M. S is a random position in library. ... 114
Figure 5.39: SL14 AA 2. The sequence of SL14 is R-Y-D*-R-A-S-D*-V-B-B-R-M. D* is a fixed position in library. ... 115
LIST OF ABBREVIATIONS
2-D ... Two Dimensional
AA ... Amino Acid
BSM ... Bovine Submaxillary Mucin
DMF ... N,N-Dimethylformamide
Dab ... Diaminobutyric Acid
Fmoc ... Fluorenylmethyloxycarbonyl
HBTU ... O-Benzotriazole-N,N,N’,N’-tetramethyl-uronium-hexafluoro-phosphate
H2O ... Water
ivDde ... 1-(4,4-Dimethyl-2,6-dioxocyclo-hexylidene)-3-methylbutyl
MALDI ... Matrix Assisted Laser Desorption/Ionization
MeOH ... Methanol
MS/MS ... Mass Spectrometry/Mass Spectrometry
OVA ... Ovalbumin
PBA ... Phenylboronic Acid
PSA ... Prostate Specific Antigen
PSM ... Porcine Submaxillary Mucin
SL ... Synthetic Lectin
:
CHAPTER 1
INTRODUCTION AND BACKGROUND
1.0 ABSTRACT
Cancer, the uncontrolled growth of abnormal cells in the body, is one of the
leading causes of death not only in the United States but also worldwide. Cancer
diagnostics that can detect the disease in early stages have become a necessary means of
increasing a patient’s survival rate. Changes in glycosylation take place during the onset
of cancer and throughout the progression of the disease, which allows these glycans to
serve as biomarkers. This chapter will describe how boronic acid functionalized synthetic
lectins (SLs) have been developed as glycan sensors and how cross-reactive sensor arrays
can be a useful tool in designing a novel cancer diagnostic.
1.1 CANCER STATISTICS
According to the National Cancer Institute, it is estimated that there will be
1,685,210 new cases of cancer and 595,690 people will die from the disease in 2016. In
2013, approximately 14,140,254 people were living with cancer of any site in the United
States with the most common types of cancer being breast, lung and bronchus, prostate,
colon and rectum, and bladder cancer3.
1.2 CANCER DETECTION AND DIAGNOSIS
Early detection and treatment of cancer has shown to increase survival rates in
Even though there are ways of diagnosing cancer, many of the procedures are associated
with disadvantages.
One example of a “gold standard” cancer diagnostic is a colonoscopy, which is a
procedure that uses a colonoscope to examine the colon for abnormal growths. While it
has is the best way to visualize tumor growth, the test is expensive and invasive. Some
studies have shown that the efficacy of the procedure depends where the cancer is located
within the colon5-6. Colonoscopies can also cause potential health complications such as
lacerations, bleeding, and infection in the colon7.
Most diagnostics are also associated with false positives and false negatives.
False positives lead a patient to believe that they have cancer when they do not. The
procedures that follow a primary diagnosis cause the patient emotional stress and more
financial burden. For example, an exam that was previously used to diagnose prostate
cancer, the prostate specific antigen (PSA) test, has a 75% false positive test result rate,
meaning that only 25% of the men that undergo biopsies actually have cancer8. False
negatives lead a patient to believe that they do not have cancer when they really do,
preventing the patient from seeking medical attention sooner, which can lead to a more
advanced cancer before treatment. Due to its inability to diagnose prostate cancer
effectively, the PSA test is now being used as a means to monitor cancer progression in
patients that have been diagnosed through systematic prostate biopsy under ultrasound
guidance9.
Not only are cancer diagnostics associated with high false positive and false
known to be associated with colon cancer, the CEA test is only 4% and 25% effective in
the first and second stages of cancer, respectively10. This test was also discontinued as a
screening test and utilized as a cancer progression monitor similar to the PSA test11.
Relatively new tests such as the fecal immunochemical test (FIT) and the guaiac-based
fecal occult blood test (gFOBT) have emerged as screening tools. These tests detect
blood in stool that is present due to colon cancer. While these tests are less invasive than
a colonoscopy, they also cannot detect new growth, which leads to false negatives12-14.
Clearly there is a dire need for new cancer screening tests. An ideal test would
quick, inexpensive, and have a low amount of risk associated with it. The test would also
need to have low false positive and false negative rates.
1.3 ABERRANT GLYOSYLATION
Proteins that have carbohydrate chains (glycans) attached to them via co- or
post-translational glycosylation are glycoproteins. Over 70% of proteins are glycosylated15.
Glycans are linked to proteins in two different ways: N-linked, where the glycan is
attached through the side chain of an asparagine residue, or O-linked, where the glycan is
attached through a serine or threonine residue16. During the onset of cancer, aberrant
glycosylation takes place in which glycan structures are over, under, or neo-expressed
(Figure 1.1). The expression of glycans not only changes on inter-membrane
glycoproteins but also on glycoproteins that are secreted. These changes continue
throughout the progression of the disease and therefore create specific biomarkers for
Figure 1.1 Aberrant Glycosylation. After the onset of cancer, normal glycan structures (the green chains on the left) are altered. The glycans can be over, under, or newly expressed, represented in the red and yellow chains.
1.4 CANCER ASSOCIATED GLYCANS
The glycosylation changes that take place are due to changes in glycotransferase
levels. These glycotransferase changes alter the composition of the glycan chains that are
Many glycan structures have been found to be associated with certain cancer
types (Table 1.1)18. It is important to note that not one type of cancer listed has the same
combination of cancer-associated glycans, which creates a specific pattern for each
cancer type. It is also important to add that some cancers have very similar patterns. For
example breast and colon cancer have the same pattern except for the overexpression of
polysialic acid in breast cancer. It is also interesting that breast and prostate cancer have
very different patterns, differing by three cancer-associated glycans. The ability to detect
the different patterns would provide a potential cancer diagnostic.
Table 1.1 Common overexpression patterns of cancer associated glycans on malignant tissues18.
While many glycoproteins have been used to detect cancer, such as PSA and
CEA, these diagnostics rely on detecting the amount of the glycoproteins themselves and
associated with high false positive and high false negative rates, therefore many of these
diagnostics have become methods to monitor the disease after the disease has been
confirmed10.
1.5 DETECTION OF GLYCANS
An ideal sensor that could detect the glycans and the changes occurring would
have high specificity towards its target, stability, and low costs. Natural lectins are
carbohydrate-binding proteins that have a high affinity to sugars and high specificity.
These proteins could act as sensors in a cancer diagnostic but are costly and
experimentally challenging19.
1.6 BORONIC ACID-DIOL INTERACTION
In order to circumvent the previously stated disadvantages of natural lectins,
boronic acids have been utilized in several different glycan sensors because boronic acids
are known to form covalent yet reversible boronate esters with 1,2- and 1,3- diols, which
are found on glycans, to produce cyclic boronate esters. The interaction between boronic
acids and diols commonly found on glycans can be found in Figure 1.3.
Figure 1.3 Interaction between boronic acids and 1,2- or 1,3- cis diols.
When using boronic acids in glycan sensors, it is important to understand what
influences the boronic acid-diol interaction. The equilibrium between phenylboronic acid
Figure 1.4 The equilibrium between phenylboronic acid and a diol.
The equilibrium is very dependent on pH. At higher pH, boronic acid becomes a boronate
anion (in Figure 1.4, 1 à 2 or 3 à 4). The boronate anion has a tetrahedral geometry
making the bond angles around the boron similar to the bond angle of the cycle boronate
ester. This limits the use of boronic acid functionalized sensors at physiological pH20.
In order to use boronic acids on sensors at physiological pH, the Anslyn group
investigated intramolecular boron-nitrogen interactions. They found that in neutral
aqueous solutions, the incorporation of an ortho aminomethyl group to phenylboronic
acid allowed boronic ester formation with diols21. The aminomethyl group interacts with
the empty p orbital on the boron transforming the geometry into the favored tetrahedral
conformation. The Anslyn group proposes two reasons for this boronate ester formation
Bronsted-Lowry base. Second, there is a weak dative bond between the nitrogen and the
boron. Both of these explanations facilitate the boronate ester formation at physiological
pH (Figure 1.521).
Figure 1.5 An aminomethyl group ortho to phenylboronic acid facilitates binding with diols at physiological pH.
1.7 BORONIC ACID FUNCTIONALIZED SENSORS
Many boronic acid functionalized sensors have been developed for different types
of saccharide sensing with particular interest in D-glucose. As previously stated, sensing
sugars can be valuable when trying to diagnose cancer and other diseases. The specific
recognition of boronic acid for cis-diols provides selectivity in sensing. The structures of
many different boronic acid functionalized sensors used in fluorescent, colorimetric, and
electrochemical methods are in Figure 1.6.
Yoon and Czarnik used the first fluorescent probe using anthrylboronic acid
(Figure 1.6a)22. When the boronic acid was bound to a sugar, the anionic boronate ester
was formed and fluorescence intensity decreased by 40%. This decrease in fluorescence
intensity was not extensively studied but it was thought that the boronate ester formation
quenched the anthracene fluorescence. This sensor encouraged other researchers to work
in this field of chemistry.
Intramolecular charge transfer (ICT) was also applied to develop fluorescent
acid and the R group was an electron-donating group such as an amine or methoxy group.
Therefore, electrons were transferred from an donating group to the
electron-accepting boron through a spacer fluorophore. When the boronic acid converted to the
boronate ester in the addition of a sugar at high pH, the boron does not accept electrons
anymore and this loss of charge transfer disrupts the fluorescent properties.
Figure 1.6 Structures of boronic acid functionalized sensors used for sugar sensing. (a) first fluorescent probe, (b) Intramolecular charge transfer (ICT) sensors, (c-e) Photoinduced electron transfer (PET) sensors, (f-g) electrochemical sensors.
Shinkai’s group was the first to design PET sensors for sugars (Figure 1.6c)24.
They used N-methyl-o-(aminomethyl)phenylboronic acid as the recognition motif and
connected to a fluorophore anthracene through a methylene spacer. The amine in close
proximity to the boronic acid allows for the interaction between the boronic acid and
diols at neutral pH. Also, the amine-boron interaction dictates the molecule’s ability to
fluoresce. Without the sugar binding, the sensor is in an “off” state due to the nitrogen’s
sugar, the nitrogen coordinates with the boron and prevents fluorescence quenching by
PET. These sensors exhibited some selectivity for sugars with it being the most selective
for D-fructose. Unfortunately, the selectivity was altered when the amounts of boronic
acid or the geometry around the boron was changed. Another example of an
anthracene-based diboronic acid system is shown in Figure 1.6d25. This sensor had high selectivity
for D-glucose over other sugars.
Wang’s group developed a series of diboronic acid sensors using a similar
strategy to the PET mechanism. This series had different linkers between two anthracene
fluorophores (Figure 1.6e)26-27. The investigated these sensors’ ability to selectively bind
to cancer associated glycans. Wang’s group found that the compounds with the
para-benzene linker showed moderate selectivity for Sialyl Lewis X.
Other sensors that were developed were electrochemical sensors. James’s group28
attached electro-active ferrocene to monoboronic acid (Figure 1.6f) or diboronic acid
(Figure 1.6g). Overall, the diboronic acid sensor was more selective for glucose and
D-galactose compared to the monobonoric acid sensor.
As discussed earlier, the recognition of more complex saccharides can play a
valuable role in the detection of many different diseases. This is due to the cis-diols that
are found on glycans and glycoproteins and their ability to interact with boronic acids.
The differences in the sugar structures in glycans and glycoproteins in cancerous states
create the need for sensors and therefore, boronic acids have been incorporated into many
biosensors for their application in cancer diagnostics.
One important feature of the sensors was the biocompatibility. In order to optimize these
sensors, they needed to have good water solubility, low toxicity, and more stability than
the other sugar sensors. Most of the fluorescent boronic acid sensors had poor water
solubility and therefore needed organic co-solvents for sugar binding studies. Wang’s
group developed different sensors that contained quinolone and naphthalene. These
structures improved water solubility and stability. When binding to glycans, the
fluorescence of these sensors changed. The changes were specific to each glycan29-34.
While all of these sensors were promising in glycan sensing, they still had
limitations. In order to overcome these limitations, Hall used a library technique to find
sensors that targeted the TF antigen, which is a cancer-associated glycan. He used a
peptide backbone due to its biocompatible properties. The peptide backbone also had the
potential to have secondary interactions with the glycans, which could enhance binding
affinity and selectivity. Hall found that peptides functionalized with boroxoles or boronic
acids had more selectivity for the TF antigen compared to peptides without those
groups35.
1.8 BORONIC ACID FUNCTIONALIZED SYNTHETIC LECTINS
Previously, an array of boronic acid functionalized synthetic lectins (SLs) was
isolated from a fixed-position library screening against purified glycoproteins PSM and
OVA. The general sequence of the SLs was Ac-R-X-D*-X-X-X-D*-X-B-B-R-M-resin
where X denotes a random AA position, D* denotes Dab functionalized with PBA, and B
denotes beta-alanine, which acts as a spacer between the resin and the peptide sequence.
Table 1.2 Sequences of SLs screened against purified glycoproteins PSM and OVA.
SL Hit Sequence
SL1 Ac-R-G-D*-V-T-F-D*-R-B-B-R-M-resin
SL3 Ac-R-S-D*-V-T-T-D*-R-B-B-R-M-resin
SL4 Ac-R-R-D*-T-Q-T-D*-Q-B-B-R-M-resin
SL5 Ac-R-A-D*-T-R-V-D*-V-B-B-R-M-resin
After the SLs were sequenced and resynthesized, the SLs were incubated with the
purified glycoproteins to assess the selectivity/cross-reactivity of each SL. Unlike a
“lock-and-key” approach, the SLs were not highly selective for one glycoprotein.
This is not a problem when using the SLs in an array because the SLs only need
to have different affinities for a certain analyte, which produces a unique fingerprint
pattern (Figure 1.7). Cross-reactive sensor arrays are similar to the mammalian sense of
taste. It is not how one taste bud reacts with a type of food but how all of the taste buds
react to form a pattern that the brain stores as a certain taste.
Through linear discriminant analysis, previous lab members have used the four
SL array to distinguish between seven colon cancer cell lines with 92% classification
accuracy (Figure 1.8).
Figure 1.8 SL cross-reactive sensor array discriminating seven colon cell types. A) The two-dimensional (2-D) LDA score plot of the SL array discriminating seven colon cell types. The green curved lines highlight the separation of healthy, cancerous/non-metastatic, and cancerous/metastatic cell types. B) Leave-one-out cross validation classification matrix for the discrimination of the seven colon cell types. Overall classification accuracy was 92% with a classification error of 8%. The expected chance accuracy of the SL array was 14.3%.
While being able to distinguish cell lines is important, in thinking about a
clinically relevant diagnostic there are two important initial questions: Does the patient
have cancer? Has the cancer metastasized? With this in mind, the analysis was done to
see if the array can differentiate based on metastatic potential (non-cancerous, cancerous
low metastatic, and cancerous high metastatic. The array was also able to differentiate the
Figure 1.9 Discrimination of seven colon cell types by metastatic potential. A) 2-D LDA score plot of the SL cross-reactive array discriminating the seven colon cell types healthy, cancerous/non-metastatic, and cancerous/metastatic. B) 2-D LDA score plot of the SL cross-reactive array ungrouping the cancerous/non-metastatic cell types: HCT116, CT-26, and HT-29. C) 2-D LDA score plot of the SL cross-reactive array ungrouping the cancerous/metastatic cell types: CT-26-F1, CT-26-FL3, and LoVo.
1.9 THE NEED FOR NEW SLs
While the previous SLs show promise for a colon cancer diagnostic, there is a
need for new screening methods that utilize proteins and glycoproteins that come from
human sources. The SLs in the previous array were screened against purified
glycoproteins that were isolated from animal sources. Also, the array’s ability to
:
CHAPTER 2
LIBRARY SCREENING
2.1 LIBRARY SYNTHESIS
Previous work was done to optimize the SL library screening against purified
glycoproteins. The general peptide sequence that was found to have the most diversity
with relatively easy sequencing ability when using Matrix Assisted Laser
Desorption/Ionization (MALDI) was Ac-R-X-D*-X-X-X-D*-X-B-B-R-M-Resin, where
the boronic acid moieties are fixed; D* denotes phenylboronic acid (PBA) functionalized
Diaminobutyric acid (Dab), B represents β-alanine, and X is a randomized amino acid.
Dab is used in place of Lys because of its shorter side chain, which is thought to reduce
background binding and increase interactions between the glycoproteins and the peptide
backbone. O-aminomethyl PBA is incorporated because of its ability to bind to diols
under physiological conditions. To create the peptide chain, standard
Fluorenylmethyloxycarbonyl (Fmoc) protocols were used with
O-Benzotriazole-N,N,N’,N’-tetramethyl-uronium-hexafluoro-phosphate (HBTU) activation. The MRBB
sequence was coupled to all beads. Methionine is the first AA because it provides a way
to cleave the peptide from the resin using cyanogen bromide. Arginine was incorporated
because it aids in MS/MS sequencing by integrating a positive charge and the β-alanine
acts as spacers, which increases the distance between the remaining sequence and resin.
PBA moieties were fixed to also aid in MS/MS sequencing. The randomized amino acids
Figure 2.1 Split and pool combinatorial methods used to generate SL peptide libraries. For randomized AA positions in the SL library, the resin is separated equally into 11 tubes and a different activated AA is added to each tube. Once the AA is coupled, the resin from all the tubes is combined to deprotect the N-terminus Fmoc protecting group.
Of the 20 AAs, methionine, cysteine, isoleucine, proline, histidine, glutamic acid,
aspartic acid, lysine, and tryptophan were excluded from the randomized positions.
Methionine is used as the first amino acid in all of the SL sequences to enable peptide
cleavage from the bead when treated with cyanogen bromide so methionine and cysteine
are not used in the randomized amino acid positions to eliminate the chance of cutting the
peptide sequence into pieces. Isoleucine is omitted to eliminate the chance of mistaking
the amino acid for leucine when sequencing unknown SLs. Proline is excluded to avoid
having SLs with turns. Histidine, glutamic acid, aspartic acid, and lysine were not used
due to charged side chains. Tryptophan is not included because of its big and bulky side
chain. The N-terminus arginine has the same benefits as the first arginine and the acetyl
The PBA functional group was attached through a reductive amination reaction
once the protecting group on the commercially available Dab was removed. The peptide
was then treated with TFA to remove the remaining side-chain protecting groups.
2.2 MS/MS SEQUENCING
After the library was incubated with a fluorescently labeled analyte and hits were
manually isolated, the SL was prepared for MS/MS sequencing. The analyte were washed
away from the SL and the PBAs were removed as well. The SL peptide was then cleaved
from the Tentagel resin.
Previous lab members used MALDI to sequence SLs. However, due to
instrumentation complications and lab conditions, the hits isolated from screenings
against the prostate analytes could not be sequenced. In attempts to still recover the
sequence, another MS/MS technique, Orbitrap, was used. While the orbitrap has the
ability to detect the small amount of peptide from one bead, it was still unable to
sequence the cleave peptide from the hits.
2.3 EDMAN DEGREDATION
In order to sequence hits from library screenings against prostate analytes, an
alternative method of peptide sequencing, Edman Degradation, was used. However, due
Figure 2.2 Mechanism for Edman Degradation. The N-terminus amino group reacts with phenyl isothiocyanate under basic conditions. The resulting cyclic phenylthiocarbamoyl derivative is then cleaved under strong acidic conditions to produce an anilinothiazolinone derivative, which is selectively extracted with an organic solvent. The derivative is then converted to phenylthiohydrantoin (PTH) under strong acidic conditions.
In the first step of Edman Degradation, the N-terminus amine reacts with
phenylisothiocyanate to form a phenylthiocarbamyl-peptide derivative. If the N-terminus
is chemically modified with an acyl (Ac) group, the reaction cannot take place and
therefore sequencing cannot take place. In the original peptide synthesizing procedure,
the Ac protected the terminal amine from being functionalized with PBA. The synthetic
method was modified so that after the last arginine was coupled to the resin, the Fmoc
protecting group was not deprotected with 20% piperidine in DMF. This step was
removed and the rest of the steps continued in the same order. The ivDde-protecting
group on Dab was removed with 5% hydrazine in DMF and PBA was attached. The
After screening the new library and sequencing hits against the prostate
membrane extracted proteins and glycoproteins, the SLs were resynthesized using the
same protocol for Edman Degradation sequencing. Orbitrap MS/MS was used to verify
the peptide sequence of the resynthesized SL and the number of boronic acids attached to
the peptide.
Figure 2.3 Fmoc deprotection mechanism. Under basic conditions, the fluorenyl proton is deprotected to which produces the deprotected amino group, dibenzofulvene, and carbon dioxide.
The Fmoc deprotection mechanism is shown in Figure 2.3. Because the
β-hydrogen of the Fmoc group is so acidic, bases such as piperidine can drive the
deprotection of Fmoc. Hydrazine, which has a slightly higher pKb than piperidine, can
also act as a base and deprotect the Fmoc as well. Orbitrap MS/MS concluded that the
Fmoc group was deprotected by the 5% hydrazine in DMF solution that also deprotected
the ivDde-protecting group on Dab. This means that when the boronic acid coupling
occurred, 3 boronic acids were attached to the SL sequence; two located on the side
Figure 2.4 Orbitrap LC chromatogram of SL11.
Figure 2.5 Orbitrap MS spectrum of SL11. The 1751 peak correlates with the total weight of SL11 with 3 PBA groups.
2.4 SCREENING AGAINST MEMBRANE EXTRACTED GLYCOPROTEINS
Previous lab members identified SLs that interacted with glycoproteins by
screening the library against PSM, BSM, and OVA. These glycoproteins were chosen
sequenced through MS/MS. When arranged in a cross-reactive sensor array, the 4 SLs
discriminated 7 colon cancer cell lines with 92% classification accuracy determined by 3
different cross-validation techniques: Jackknife, Boot-strap, and Training/test set.
Furthermore, when discriminating the 7 cell lines by metastatic potential, the array had
97% classification accuracy2.
When using the 4 SL cross-reactive sensor array to discriminate prostate cancer
cell lines, the classification accuracy decreased. In order to discover SLs that
discriminated prostate cancer cell lines with high classification accuracy and had
potential to be used in a prostate cancer diagnostic, a solution containing membrane
bound proteins and glycoproteins were used as a screening analyte. Figure 2.6 is a
general schematic for the screening procedure with membrane proteins and
glycoproteins.
Two different prostate cell lines RWPE-1 and PC3, not cancerous and
cancerous-metastatic, respectively, were chosen as analytes. The membrane proteins and
glycoproteins were extracted using the membrane extraction kit that was used for the
colon cancer cell line discrimination. By using the proteins and glycoproteins from
prostate cell membranes, the hits isolated from the screening were more specific to
Figure 2.6 Workflow for screening a SL library to identify hits. Prostate cells are cultured and the membrane proteins and glycoproteins were extracted with Qiagen Plasma Membrane Protein Kit. After the extraction, the sample was labeled with fluorescein and then incubated with the SL library. The unbound fluorescent sample was washed away and library resin that was fluorescent were identified and isolated for sequencing.
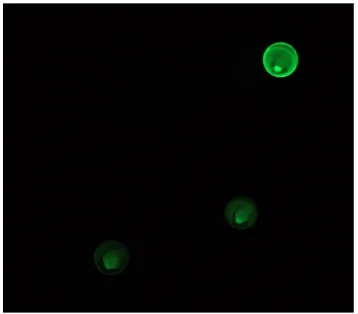
Three hits were found when screening against fluorescent prostate cell membrane
extracts. The first hit, SL10, was found when screening against F-PC3 (Figure 2.7). The
second hit, SL13, was found when screening against F-RWPE-1 (Figure 2.8). The third
hit, SL14, was found when screening against R-PC3 (Figure 2.9). For each hit, the SL
that was more fluorescent than the surrounding SLs was manually removed. The
fluorescent proteins and glycoproteins were removed from the SL by three alternating
acid/base washes (70% TFA in H2O and 0.1 M NaOH) and then the individual SLs was
sent to Tufts University Core Facility where the resin was sequencing by Edman
Figure 2.7 SL10 hit located in the top left of the frame. This SL was screened against F-PC3.
Figure 2.8 SL13 hit located in the top right of the frame. This SL was screened against F-RWPE-1.
The sequences for SL10, SL13, and SL14 can be found in Table 2.1 (for all
Edman Degradation sequencing data, see Appendix A). Sequencing for B-B-R-M was
not performed because the first AA was manually coupled and the next three AAs were
coupled to the resin using a peptide synthesizer. When looking at the sequencing data,
many of the AA positions are clear but some are difficult to distinguish.
Table 2.1 SL10-14 sequences, selectivity and the analyte it was screened against.
SL Sequence Screened Against Selectivity
SINGLE ANALYTE SCREEN
SL10 R-L-D*-A-R-S-D*-G-B-B-R-M F PC3
SL13 R-T-D*-G-L-A-D*-V-B-B-R-M F RWPE-1
SL14 R-Y-D*-R-A-S-D*-V-B-B-R-M R PC3
DUAL ANALYTE SCREEN
SL11 R-L-D*-Y-L-T-D*-R-B-B-R-M F RWPE-1/R PC3 PC3
SL12 R-L-D*-G-F-Y-D*-Q-B-B-R-M F RWPE-1/R PC3 RWPE-1
In all of hits, the last AA, arginine, is not conclusive from the chromatogram but
the last AA is a fixed position in the library. The arginine was manually coupled to the
combined library at one time and the coupling was verified through a ninhydrin test. It is
also hard to distinguish the Dab positions when referring to the sequencing
chromatograms but it is similar to the last AA position. It is most important to look for
changes from cycle to cycle within the SL sequence. The absolute quantities of the AAs
in a single cycle is not as important due to the fact that different AAs have different
background levels. Appendix B contains all chromatograms from the protein sequencing
2.5 DUAL DYE SCREENING
As stated above, the purpose of the library screenings against prostate membrane
extracts was to find SLs that interacted with relevant prostate proteins and glycoproteins.
In order to identify SLs that could bind differently to non-cancerous samples versus
cancerous samples, the prostate analytes that were used in the single screenings were
combined to create a dual dye library screening.
Figure 2.10 Dual Dye Screening Process. In order to select SLs that were selective, a dual dye screening process was used. In this process, the membrane glycoproteins from two different cell lines, one non-cancerous and the other cancerous-metastatic, were labeled with fluorescent dyes of different colors. In this figure, the non-cancerous glycoproteins were labeled with fluorescein and the cancerous-metastatic glycoproteins were labeled with rhodamine.
The general schematic for the dual dye screening is in Figure 2.10. The
fluorescein-labeled non-cancerous RWPE-1 membrane proteins and glycoproteins were
combined with rhodamine-labeled PC3 membrane proteins and glycoproteins and
incubated with the library. After the resin was washed, the SLs that were fluorescent were
identified. The reverse dual dye screening was also performed where RWPE-1 was
fluorescent in the green channel than any of the other beads in that channel but was not
more fluorescent than the other beads in the red channel (or vice versa) was selected.
Two hits were isolated from the dual dye screening. The sequences for both SLs
can be found in Table 2.1 and the sequencing data can be found in Appendix A. The first
hit from dual dye screening was SL11. The SL was isolated from the library screening
against F-RWPE-1 and R-PC3 combined. It was more fluorescent than the SLs
surrounding it in the red channel but it was not more fluorescent than the same beads in
the green channel (Figure 2.11). This means that SL11 bound more to PC3 membrane
extract that the other SLs but it did not bind more to RWPE-1 than the other SLs.
Figure 2.11 SL11 hit. This hit was found by dual dye screening with F-RWPE-1 and R-PC3. The hit is located in the bottom middle part of the right frame.
The second hit from the dual dye screening was SL12. It was also isolated from
the library screening against F-RWPE-1 and R-PC3 but it was more fluorescent in the
green channel versus the red channel meaning that it interacted more with RWPE-1 than
Figure 2.12 SL12 hit. This hit was found by dual dye screening with F-RWPE-1 and R-PC3. The hit is located in the middle part of the left frame.
2.6 RESYNTHESIZING SL10-14
After the sequences of SL10-14 were identified, the SLs were resynthesized to
confirm the structure of the overall SL. As stated previously, the new library synthesis
protocol did not remove the Fmoc protecting group with 20% piperidine in DMF before
deprotecting the ivDde protecting group on Dab. However, due to hydrazine’s ability to
act as a base like piperidine, hydrazine could remove the Fmoc protecting group and
therefore allow for a third PBA group to be present.
To verify the structure, the SLs were first resynthesized using the same protocol as
the new library. Once the peptide sequences had been coupled to resin, the ivDde groups
were deprotected and PBAs were attached. The Fmoc group was then deprotected and the
acid labile groups were removed. The SL was then cleaved from the bead using cyanogen
bromide overnight and analyzed by Orbitrap (Figure 2.4 and Figure 2.5). The masses
found for each SL showed that the SL had three PBA groups instead of two like the
previous SL1, 3, 4, and 5.
2.7 CONCLUSION
In this chapter, library synthesis and screening against prostate specific analytes is
(R-X-D*-X-X-X-D*-X-B-B-R-M) and the general library screening procedure. While the SLs that
were discovered through previous screenings were useful in discriminating colon cancer
cell lines, they did not discriminate prostate cell lines with the same classification
accuracy. Screening the library against prostate cell membrane extracts, which contained
the membrane proteins and glycoproteins from prostate cells, identified new SLs
(SL10-14). Once the SLs binding to the analytes had been isolated, the bound glycoproteins
were removed and sequenced. Due to instrumentation complications, the MALDI,
technique used by former lab members to sequence the SLs, could not be used and
Edman Degradation was used instead. SL10, 13, and 14 were isolated from library
screenings against single analytes such as RWPE-1 (non-cancerous) and PC3
(cancerous-metastatic). SL11 and SL12 were isolated from library screenings against the two single
analytes combined together. In order to see the selectivity for one analyte versus another,
the analytes were labeled with different fluorophores. Once the new SLs were
resynthesized, Orbitrap was used to validate the overall structure of the SLs. Instead of
just two PBA groups located on the fixed Dab positions, a third was also present on the
N-terminus end of the peptide.
2.8 EXPERIMENTAL METHODS
Chemicals
All AA and HBTU were purchased from EMD Millipore. Prostate Specific
Antigen was purchased from Sigma-Aldrich. TentaGel resin (Cat. No. MB-300-002;
loading level 0.25-0.3 mmol/g) was purchased from Rapp Polymere. All other chemicals
A Leica MZ 16F microscope was used to evaluate the binding of SLs and analytes
of interest. A GFP3 filter set with an excitation 450-490 nm and emission 500-550 nm.
Images were taken using a QImaging MicroPublisher 5.0 RTV digital camera associated
with the microscope. Images were analyzed by MATLAB, which provided SL
fluorescence information.
Library Synthesis
The general sequence of the library was R-X-D*-X-X-X-D*-X-B-B-R-M-Bead,
which means that the first four amino acids were the same for all the beads in the library.
The first AA, methionine, was attached manually by activating FMOC-met-OH in a 5%
N-methylmorpholine in DMF solution and then mixing the AA solution with Tentagel
resin beads (300 µm). After incubating the AA solution with the beads for roughly an
hour, the AA solution was removed and a ninhydrin test was preformed to confirm that
the AA had coupled to the bead. If the ninhydrin test was positive, the beads were put
onto the Protein Technologies Peptide Synthesizer (PS3) where the next 3 AAs (R, B, B)
were coupled to the library of beads. After the beads were removed from the PS3, the
random AA was coupled to the beads using a split-and-pool method. Briefly, the beads
are split into 11 different reaction vessels. In each vessel, a different activated AA is
coupled to the beads. The beads are then combined back into one vessel and deprotected.
Because the next position is fixed with Dab, the beads are coupled to the AA and
deprotected in the same vessel. The next 6 AAs are coupled depending on the fixed or
random position of that particular AA.
Once all of the AAs are coupled, the ivDde protecting group of D* is removed by
FMOC protecting group on the final R of the peptide sequence. The PBA functional
groups are added through reductive amination by incubating the beads with a 2% MeOH
in DMF solution containing an 8 equivalent ratio of bead to 2-formylphenyl boronic acid.
The remaining side-chain protecting groups are removed using a 95% TFA, 2.5% TIS,
and 2.5% H2O.
MS/MS Analysis
To cleave the peptide from the resin, the beads were treated with 50 μl of 40
mg/ml CNBr in 0.1 M HCl for 16 hr in the dark. The beads were removed from the
solution and the excess CNBR, TFA, and water were removed under reduced pressure by
using an AES1010 SpeedVac system. The cleaved peptides were re-dissolved in 10 μl of
0.1% TFA in water. 1 μl of matrix containing saturated α-cyano-4-hydroxycinniamic
acid (CHCA) in 50:50:0.1 acetonitrile/water/TFA was positioned on to a MALDI plate
and mixed with 2 μl of the cleaved SL solution. Samples were then analyzed by
MALDI-TOF/MS and MS/MS techniques.
Cell Culture
VWR was the supplier for all supplements and media for all cell lines. The media
for RWPE-1 was K-SFM supplemented with recombinant human Epidermal Growth
Factor (rhEGF) and Bovine Pituitary Extract (BPE). The media for PC3 was RPMI 1640
with 10% FBS. The cells were grown in T75 flasks at 37 degrees Celsius.
PBS
To make a 4L solution of PBS, sodium phosphate monobasic (monohydrate) (27.6
7.2-7.3 using 3 M NaOH and then the solution was diluted to 4L by adding DI water.
Fluorescent Labeling of Prostate Cell Membrane Extracts
The Qiagen Plasma Membrane Protein Kit was used to extract plasma membrane
proteins and glycoproteins. The extract was spun into carbonate buffer pH 9.8 and a BCA
assay was performed to obtain the concentration of the extract. The amount of protein
needed for library screening was added to carbonate buffer to a total volume of 600 µL.
Depending on which dye was being used to label, 0.07 µmol fluorescein or
NHS-rodamine was added and the solution was incubated at 37°C and tumbled for 1 hr.
Amicon Pro Centrifugal Filter (10 kDa) were used to remove excess dye and to
concentrate the proteins and glycoproteins after the 1 hr incubation.
BCA Assay
The Thermo Scientific BCA kit was purchased from VWR. A serial dilution of
the BCA 2 mg/mL standard was used for the analysis. Standards and samples (10 µL)
were placed in a 96 well plate in triplicate and combined with 200 µL of the reagent from
the BCA kit. After the wells had been mixed thoroughly, plate was incubated in an oven
for approximately 30 minutes at 370C. The absorbance of the wells was read on a plate
reader at 562 nm.
Library Screening for Single Analytes
Approximately 2 mg of library resin was rinsed in PBS twice and then
pre-incubated with 1% BSA in PBS with 10% glycerol for 15 minutes. This pre-incubation
was to reduce the nonspecific binding between the SL and proteins. The 1% BSA in PBS
with 10% glycerol solution was then removed from the beads and 1 mL of a 0.0002
incubated with the beads for 6 hrs at room temperature with gentle shaking. After
incubation, the beads were rinsed with PBS three times and imaged with a fluorescent
microscope, Leica MZ 16F.
Library Screening Dual Dye Analytes
The library screening for dual dye analytes compared to single analytes were
almost completely identical. The only significant difference was the amount of each
analyte that was used for the study. Instead of using 1 mL containing 0.0002 mg of both
analytes to give a total concentration of 0.0004 mg/mL of protein, only 0.0001 mg was
:
CHAPTER 3
PROSTATE SELECTED SYNTHETIC LECTINS
3.1 CROSS-REACTIVITY WITH PROSTATE CELL LINES
Previously, SLs that were isolated through library screenings against purified
glycoproteins PSM and OVA were found to be cross-reactive to purified glycoproteins as
well as cancer associated glycans and colon cancer cell lines. It is important to mention
that the cross-reactivity of the SLs is what gives the SL array the ability to discriminate
the different glycoproteins they interact with. In order to evaluate the selectivity or
cross-reactivity of SL10-14 identified in Chapter 2, the SLs were resynthesized using the same
general library synthesis methods as discussed in Chapter 2.
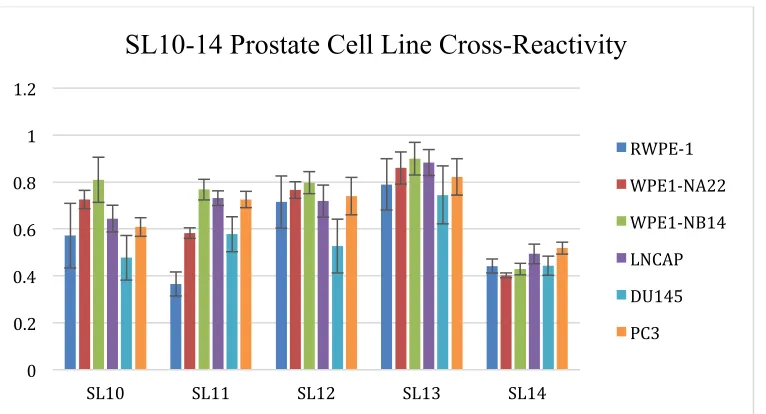
As seen in Figure 3.1, SL10-14 are cross-reactive to 6 prostate cell lines with
varying metastatic potential. The prostate cell lines used can be found in Table 3.1
Table 3.1 Prostate cell lines with metastatic potential listed.
Cell Line Tissue Type Metastatic Potential
RWPE-1 Prostate Non-Cancerous
WPE1-NA22 Prostate Cancerous/Non-Metastatic
WPE1-NB14 Prostate Cancerous/Non-Metastatic
LNCaP Prostate Cancerous/Metastatic
DU145 Prostate Cancerous/Metastatic
While some SLs interact more with one cell line over another (e.g. SL10 binding
with WPE1-NB14 vs. its binding with DU145), not one is selective for one prostate cell
line. Each SL binds cross-reactively to the prostate cell lines.
Figure 3.1 Binding patterns/ “Fingerprint patterns” of SL10-14 with prostate cell lines. 3.2 SL10-14 PROSTATE CELL LINE DISCRIMINATION
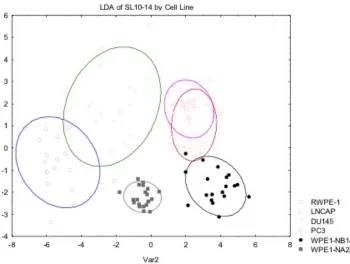
As mentioned before in Chapter 1, because it is difficult to see how the SLs are
binding differently to cell lines, LDA is the statistical analysis used to better understand
the similarities and differences in the data above. When using LDA, SL10-14
discriminated prostate cell lines with 83% classification accuracy (Figure 3.2). 0
0.2 0.4 0.6 0.8 1 1.2
SL10 SL11 SL12 SL13 SL14
SL10-14 Prostate Cell Line Cross-Reactivity
Figure 3.2 LDA plot of SL10-14 classified by prostate cell line.
While it is beneficial to have an array that can correctly identify the different cell
lines present, it is more important to evaluate the array’s ability to distinguish the cell
lines’ metastatic potential when developing a cancer screening array.
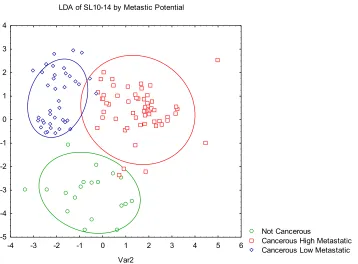
When discriminating the prostate cell lines by metastatic potential (Table 3.2) the
classification accuracy was 92% (Figure 3.3). By incorporating the SLs in the former SL
array, SL1, 3, 4, and 5, into an array with the new SLs, the classification accuracy
Figure 3.3 LDA of SL10-14 classified by metastatic potential. LDA of SL10-14 by Metastic Potential
Not Cancerous
Cancerous High Metastatic Cancerous Low Metastatic
-4 -3 -2 -1 0 1 2 3 4 5 6
Var2 -5 -4 -3 -2 -1 0 1 2 3 4
LDA of SL1,3,4,5 and SL10-14 with Prostate by Metastatic Potential
Not Cancerous
Cancerous High Metastatic Cancerous Low Metastatic
-10 -8 -6 -4 -2 0 2 4 6 8 10
3.3 PROSTATE CANCER VS. COLON CANCER
An ideal cancer diagnostic would not only be able to diagnose the severity of the
disease but also what kind of cancer is present. Using the prostate and colon cell lines in
Table 3.2, LDA was used to discriminate the two types of tissue. When using the SL
array found by former lab members (SL1, 3, 4, and 5) the classification accuracy was
66%. When using the prostate selected SLs, the classification accuracy increased to 95%.
The combined arrays were able to discriminate between prostate cell lines and colon cell
lines with 97% classification accuracy. This information suggests that the prostate
selected SLs bind to the glycoproteins from the two types of tissues in different ways.
Table 3.2 Prostate and colon cell lines with metastatic potential listed.
Type of Tissue Metastatic Potential
RWPE-1 Prostate Non-Cancerous
CCD 841 CoN Colon Non-Cancerous
WPE1-NA22 Prostate Lowly Metastatic WPE1-NB14 Prostate Lowly Metastatic
HCT 116 Colon Lowly Metastatic
HT-29 Colon Lowly Metastatic
LNCAP Prostate Highly Metastatic
DU145 Prostate Highly Metastatic
PC3 Prostate Highly Metastatic
LoVo Colon Highly Metastatic
3.4 THE UTILITY OF SL11
LDA provides more information than just classification accuracies. It can also
information about which SL is most important for discrimination. It provides this
information through an F-to-remove value, which is a value that describes the variables
importance in the discrimination being performed37. If the variable with a large
F-to-remove was F-to-removed from the analysis, the discrimination accuracy would decrease. In
To see just how powerful SL11 is in discriminating the prostate cell lines, LDA
was used to get classification accuracies. Each analysis was SL11 discriminating one cell
line vs. a different cell line. The results are listed in Table 3.3.
SL11 can discriminate all of the cell lines with high classification accuracies
except for distinguishing WPE1-NA22 from DU145 and LNCaP from PC3. What is the
most important to note is that SL11 has high classification accuracies for distinguishing
the non-cancerous cell line from all of the other cell lines regardless of their varying
metastatic potential.
Table 3.3 Classification matrix for SL11 with prostate cell lines generated by LDA.
RWPE-1 WPE1-NA22 WPE1-NB14 LNCaP DU145 PC3
RWPE-1 NA 97 100 100 92 100
WPE1-NA22 97 NA 100 100 60 100
WPE1-NB14 100 100 NA 74 97 70
LNCAP 100 100 74 NA 97 57
DU145 92 60 97 97 NA 97
PC3 100 100 70 57 97 NA
3.5 TWO PBA VS. THREE PBA
In order to sequence hits, the synthesis of the library had to be altered from
previous libraries. After resynthesizing the hits found from screening against prostate
membrane proteins and glycoproteins, Orbitrap MS data confirmed there were three PBA
groups attached to the peptide backbone instead of two PBA groups. Because the PBA
groups interact with the sugars present on the glycoproteins, it is important to understand
how the new SL structure plays a role in discriminating cell lines.
2BA-incorporating another boronic acid group to the SL sequence, the SLs have more possible
interactions with the glycans present.
Figure 3.5 LDA plot of SL10 2BA-SL14 2BA classified by metastatic potential. 3.6 CONCLUSION
In this chapter, the prostate selected SLs that were isolated and characterized in
Chapter 2 have been resynthesized and bound to analytes of interest. The prostate
selected SL array (SL10-14) has the ability to discriminate 6 prostate cell lines with 83%
classification accuracy. While it is important to be able to distinguish between the cell
lines, it is more important to be able to discriminate the prostate cell lines by metastatic
potential. The SL array had a 92% classification accuracy when discriminating the
prostate cell lines by metastatic potential (non-cancerous, cancerous/non-metastatic, and
cancerous/metastatic). By incorporating the SLs isolated by former lab members into the LDA of SL10 2BA-SL14 2BA by Metastatic Potential
Not Cancerous
Cancerous High Metastatic Cancerous Low Metastatic
-6 -4 -2 0 2 4 6
Var2 -3