A new in
s
trument for the
s
tudy of wave-particle interaction
s
in
s
pace:
One-chip Wave-Particle Interaction Analyzer
Hajime Fukuhara1, Hirotsugu Kojima2, Yoshikatsu Ueda2, Yoshiharu Omura2, Yuto Katoh3, and Hiroshi Yamakawa2
1Graduate School of Engineering, Kyoto University, Kyotodaigaku-katsura, Kyoto 615-8510, Japan 2Research Institute for Sustainable Humanosphere, Kyoto university, Gokasho, Uji, Kyoto 611-0011, Japan
3Planetary Plasma and Atmospheric Research Center, Graduate School of Science, Tohoku University, Sendai, Miyagi 980-8578, Japan
(Received September 2, 2008; Revised December 7, 2008; Accepted December 7, 2008; Online published July 27, 2009)
Wave-particle interactions in a collisionless plasma have been analyzed in several past space sciencemissions but direct and quantitative measurement of the interactions has not been conducted. We here introduce the Wave-Particle Interaction Analyzer (WPIA) to observe wave-particle interactions directly by calculating the inner product between the electric field of plasma waves and of plasma particles. The WPIA has four fundamental functions: waveformcalibration, coordinate transformation, time correction, and interaction calculation. We demonstrate the feasibility of One-chip WPIA (O-WPIA) using a Field Programmable Gate Array (FPGA) as a testmodel for future sciencemissions. The O-WPIA is capable of real-time processing with low power consumption. We validate the performance of the O-WPIA including determination of errors in the calibration and power consumption.
Key words:Wave-particle interaction, plasma waves, collisionless plasma, FPGA.
1.
Introduction
Since space plasmas are essentially collisionless, their ki-netic energies are alteredmainly through wave-particle in-teractions. While plasma waves are destabilized by absorb-ing kinetic energy, the excited waves result in damping by energizing the plasma. Plasma wave receivers and plasma instruments on-board spacecraft take on the role of observ-ing wave-particle interactions in space. Previous plasma wave receivers and plasma instruments were completely in-dependent. In typical space missions, they were not con-trolled in coordinated ways and did not interact with each other. This independencemade it difficult to quantitatively study wave-particle interactions. For example, direct cor-relation analyses using waveforms and velocity distribution functions were usually impossible by the difference in time resolutions.
Extensive attempts have been made in the past sev-eral decades to identify wave-particle interaction processes. There exist roughly two different methods for rocket or spacecraft observations. One is based on particle corre-lation techniques (Gough et al., 1995; Gough, 1998). It calculates an autocorrelation (or cross-correlation) function using the particle detection pulses. Since the results depend on velocitymodulations in the plasmas in phase space due to wave-particle interactions, they enable one to identify the energy source of plasma waves by comparing enhance-ments in the autocorrelation functions in different energy ranges with the plasma wave frequencies. Gough (1998) reported the auto correlation function had beenmodulated
Copyright cThe Society of Geomagnetismand Earth, Planetary and Space Sci-ences (SGEPSS); The Seismological Society of Japan; The Volcanological Society of Japan; The Geodetic Society of Japan; The Japanese Society for Planetary Sci-ences; TERRAPUB.
with the upper hybrid frequency by an injection of elec-tron beam into the ionosphere. Buckleyet al.(2000) in-troduced an outline of the particle correlator for the Cluster mission and evidenced the capability of the correlator to de-tect wave particle interactions by simulation. Furthermore, the flight data of the particle correlator on board the Cluster spacecraft show the good correlation of the detected parti-clemodulation frequencies with the frequencies of the ob-served plasma waves in themagnetosheath (Buckleyet al., 2001).
The other systemis the so-called “Wave-Particle Correla-tor (WPC)” (Ergunet al., 1991, 1998). The preceding cor-relatormakes use of only the data fromparticle instruments, whereas the wave-particle correlator uses data from both plasma waves and particle instruments. It counts particle events detected by plasma instruments taking into account the phase observed by the plasma wave receivers. The ad-vantage of this technique is it allows one to identify the di-rection of energy flow between plasma waves and plasmas, as well as to find out the wave energy sources. Kletzinget al.(2005) developed a new wave-particle correlator, which counts up detected particles according to phase divided into 16 bins. These wave-particle correlators showed the corre-lation between the phase of the Langmuir waves and the ob-served electron counts in the polar region. Of course, their technique can be applied to other waves in other regions.
In summary, the particle correlator provides autocorre-lation functions, which are equivalent to the modulation frequency of plasmas in phase space, whereas the wave-particle correlator provides the number of particles detected during the period of a specific wave phase. In the present paper, we propose a new type of instrument with the ca-pability to conduct direct and quantitativemeasurements of
wave-particle interactions. We name it the “Wave-Particle Interaction Analyzer (WPIA).” The WPIA quantifies the ki-netic energy flow by the inner product of the amplitudes of the observed waves and velocities of the detected particles. The othermethods do not consider all of the properties of the observed waveforms and particles. However, the WPIA considers instantaneous wave amplitudes and velocities of particles, as well as the phase relations between the waves and particles. Furthermore, since the wave-particle interac-tions are confined to specific direcinterac-tions relative to the am -bient magnetic field, the WPIA also accounts for the di-rection of the ambient magnetic field in the above calcu-lations. These calculations should be conducted on-board spacecraft since sending all of the data for the calculations needs a wide communication band of telemetry, which is actually not available.
The detailed principle of the WPIA is described in Sec-tion 2 and consists of complicated processes in its func-tion. One of the easiest way to realize the WPIA is to de-velop software running on a digital processor on-board a spacecraft. However, the heavy load of the WPIA requires a dedicated processor on a real-time basis. This require-ment does not alwaysmeet the capabilities of a spacecraft. Therefore, we have developed a Field Programmable Gate Array (FPGA) with all of the necessary functions of the WPIA. We call it the “One-chip Wave-Particle Interaction Analyzer (O-WPIA).” The O-WPIA realizes the capability of the WPIA with real-time processing and low-power con-sumption.
We submitted our proposal of the SCOPE (cross-Scale COupling in the Plasma universE)mission to JAXA (Japan Aerospace Exploration Agency) (SCOPE working group, 2008). The SCOPE targets the investigation of the cross-scale coupling in the terrestrialmagnetosphere. If the pro-posal is approved, the SCOPE spacecraft will be launched in 2017. In thismission, since the wave-particle interaction is the key observational subject, we believe that the quan-titative data of the O-WPIA will be exceedingly significant in thismission. On the other hand, we also join another proposal of themission called “ERG (Energization and Ra-diation in Geospace)” (ERG working group, 2008). It is a small satellitemission, which focuses on the observation of the radiation belts of the Earth. In thismission, we propose the software-type WPIA (S-WPIA). In the S-WPIA, the functions and logics of the WPIA are realized by the soft-ware running on the on board general purpose processor. Since the S-WPIA does not have exclusive hardware, we cannot expect real-time operations of the WPIA. However, it is very efficient in the small satellitemission, in which the available resources of the satellite are very limited.
In this paper, we introduce the basic physical concept of the WPIA in Section 2. We also show the hardware logic of the WPIA installed in the one-chip FPGA in Section 3. After introduction of the hardware, we describe the test-design of the one-chip WPIA in Section 4. We evaluate the systemoperation, the errors, and the power consumption in the installed WPIA in Section 5. Finally, we summarize and conclude the paper in Section 6.
2.
Principle and Significance of the WPIA
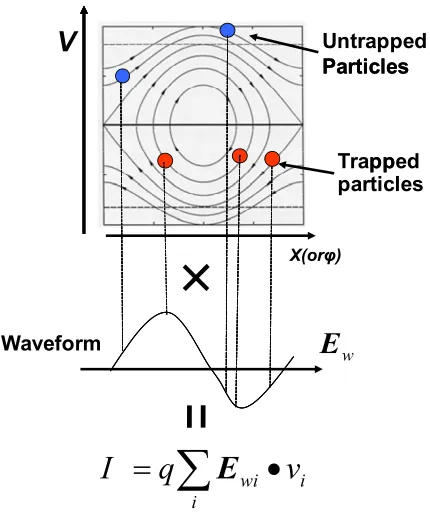
The present section demonstrates the principle and sig-nificance of the WPIA by comparing it with the conven-tional methods used in earlier studies. In the conven-tional method for the study of wave-particle interactions using spacecraft observation data, one calculates the cor-relation of plasma wave data (such as frequency spectra) with plasma particle data (such as energy spectra). When attempting to identify physicalmechanisms of plasma wave instabilities in detail, the reduced velocity distribution func-tions are examined in the periods of notable plasma wave activities. Since the correlation is visually examined in such methods, qualitative results are unavoidable. Moreover, one frequently faces a lack of time resolution in this conven-tional method. Since the energies of the particles fluctu-ate at a characteristic timescale in wave-particle interactions such as at an electron beaminstability, the time resolution of the data should be high enough to trace the phenomenon. An electron beaminstability is a good example to dem on-strate the advantage of the WPIA. Figure 1 schem ati-cally shows the relation between the velocity distribution (Fig. 1(a)) and phase space trajectories for beamparticles (Fig. 1(b)) in the nonlinear stage. The vertical axis in Fig. 1(b) denotes the velocity component parallel to the am -bientmagnetic field, and the horizontal axis represents the phase relation of the particles and plasma waves (that is, the position of particles relative to the spatial structure of the electrostatic potentials). The center of the trajectories is aligned with the phase velocity (vφ) of destabilized plasma waves. As the wave growth in the linear phase leads to the formation of an electrostatic potential, beamparticles start getting trapped in the hatched region in Fig. 1(b) by losing their kinetic energies. The velocity width in the trapping region is defined by the trapping velocity (Vt),
Vt=2
plasma frequency, respectively. Once particles are trapped, their kinetic energies are exchanged with plasma wave ener-gies, and the direction of energy flow (waves to particles or vice versa) is defined by the phase relation between the par-ticles and plasma waves. A series of these processes results in the appearance of fluctuations with a width of 2Vtaround
vφ in the reduced velocity distribution shown in Fig. 1(b).
In conventional data processing for calculating velocity dis-tributions, data integration of longer than a few seconds is necessary. This data integration process averages the fluc-tuations, resulting in the disappearance of the variations in the velocity distribution. Furthermore, despite the im por-tance of the phase relation between the plasma waves and particles, the reduced velocity distribution loses the phase information.
-Trapping Velocity (2V )
f(V)
V
V
(a)
a part of the distribution to be fluctuated
Untrapped Particles
Phase velocity (V )
Trapped Particles
x(or )
(b)
Observed velocity distribution Particle trajectory in phase space
t
Fig. 1. Classicalmethod in studying wave-particle interactions. The phase relation of the plasmas and plasma waves disappear in the reduced velocity distributions.
ine phase information of the waveforms. They also pro-vide an opportunity to examine quick changes in wave fea-tures, because they do not require data accumulation, in contrast to the spectral analysis. On the other hand, high time resolutions in the velocity distributionmeasurements remain an important issue for future missions. The real-ization of superior plasma instruments with high time res-olution is an excellent sres-olution for quantitative research on wave-particle interactions in space plasmas. However, we believe that the WPIA provides another solution for future work. The WPIAmeasures an important physical quantity,
Ew·v, which quantitatively represents the wave-particle
in-teraction, whereEwis the instantaneous electric field vector
andvis the velocity vector of a plasma particle. Note that
Ew·vis equivalent to a time variation in the kinetic energy
of a single particle according to d
dt
m0c2(γ−1)
=qEw·v, (2)
wherem0,q,c, andγ denote the restmass, charge of a
par-ticle, light speed, and Lorentz factor, respectively. The cal-culation of this physical value at the source region allows us to do quantitative studies of the wave-particle interac-tion. Since it is not enough to do the calculation for only one particle, we need some accumulation over a time pe-riod of at least several characteristic timescales in the target phenomenon as follows,
I =q
i
Ewi ·vi. (3)
Equation (3) is valid for the kinetic energy transfer in any wave-particle interaction process. Themost significant dif-ference between this method and the conventional one is that the data accumulation is conducted after considering the phase relation ofEwandv(see Fig. 2) as well as am
pli-tude and velocities. Furthermore, the accumulationmethod is flexible. For example, we can examine the results with
Fig. 2. Principle of the WPIA. The WPIA calculatesEw ·v before
accumulating the observed data.
fixed phase differences between the plasma waves and par-ticles. In short, themain function of the WPIA is to calcu-late the physical quantityEw·vand to accumulate it for a
specific time period, i.e., the quantity “I” fromEq. (3), in various ways.
In order to calculateEw·vwithout any integration or
two instruments and generates the physical quantityEw·v.
While the waveform data are continuously input to the WPIA, output pulses with information on the arrival time and equivalent energy are impulsively input to the WPIA. The WPIA can also accumulateEw·vin various ways.
Similar attempts to focus on the phase relation between the observed waves and timing of particle detection pulses have been conducted in previous rocket and satellitem is-sions (Ergun et al., 1991; Kletzing et al., 2005). They counted up the number of particle detection pulses in refer-ence to the phase of the observed Langmuir waves. In keep-ing the phase relation of waves and particles, their principle is similar to that of the WPIA. However, because they do not take into account the phase relation between the electric field vector and the particle velocity vector, their outputs are not quantitative physical values. In contrast, the WPIA pro-videsEw·v, which is equivalent to the time variation of the
kinetic energies. This is the significant and unique point of the WPIA compared with previous instruments.
The detailed inner processes of the WPIA are described in Section 3. The most important issue in realizing the WPIA is that it requires high-performance digital process-ing. For example, the WPIA needs the functions of FFT (Fast Fourier Transform) and IFFT (Inverse Fast Fourier Transform) as well as the calculation ofEw·v. Since the
WPIA needs to calibrate the observed waveforms before calculatingEw·v, the FFT and IFFT processes are
essen-tial. The one-chip WPIA provides a solution for realizing a WPIA by keeping itsmass and power consumption as small as possible.
3.
Wave-Particle Interaction Analyzer (WPIA)
3.1 Interconnectionswith necessarysensors
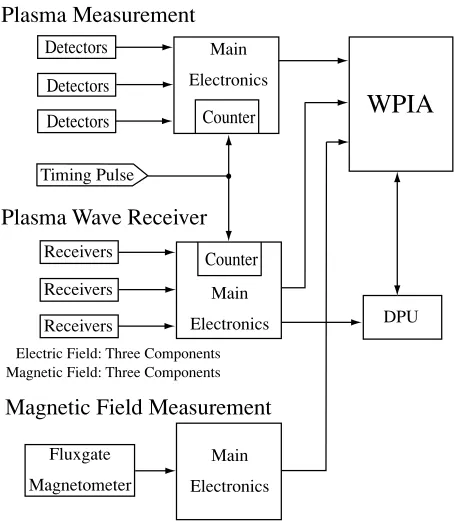
In Section 2, we described the principle of the Wave-Particle Interaction Analyzer (WPIA) and stressed its ad-vantage in studying wave-particle interactions via space-craft observations. In conducting on-board calculations of energy exchanges among plasma particles and waves by the WPIA, it is indispensable to coordinate the plasma wave receivers with the plasma andmagnetic field instruments. Figure 3 shows the interconnection of the WPIA with other sensors. Since the WPIA systemcalculatesEw·von-board
a spacecraft, it requires input of data from plasma sen-sors and fluxgate magnetometers as well as plasma wave sensors. Although scientific instruments on-board space-craft are usually operated independently of other obser-vation instruments, the WPIA works cooperatively with plasma wave, plasma, andmagnetic fieldmeasurement in-struments. Plasma wave receivers and plasma instruments transfer their observed data to the WPIA including their phase information. Thismeans that plasma wave receivers and particle instruments should transmit the observed wave-form data and the timing of the particle detection pulses with their energy information. Additional information such as the incoming directions of the detected particles are also sent to the WPIA. Further, the wave-particle interactions should be referred to the direction of the ambientmagnetic field. For example, in the case of the interaction of electron beams and Langmuir waves, the calculation ofE·vis es-sential, whereE andv denote the instantaneous electric
Plasma Measurement
Plasma Wave Receiver
Magnetic Field Measurement
Electric Field: Three Components Magnetic Field: Three ComponentsMain Electronics
Receivers Timing Pulse
Receivers Receivers
Detectors Detectors
Counter Detectors
Main Electronics
Counter
Fluxgate Magnetometer
DPU
WPIA
Main Electronics
Fig. 3. Interconnection of the WPIA with other instruments.
field vector and the detected particle velocity vector relative to the ambientmagnetic field, respectively. For this trans-formation of the coordinate systemin wave vectors and ve-locity vectors of particles, the data of the fluxgatem agne-tometer are used. Real-time operation of the WPIA requires the data transmission line to have a large enough capacity to send all of the data without any delays to the WPIA. If the systemcannot provide enough data transmission capac-ity to the WPIA, some data buffers for storing the observed waveforms and particle information should be prepared. In that case, it is difficult to guarantee the real-time calculation ofE·v.
3.2 Blocksto be implemented
Figure 4 shows a block diagramof the WPIA. It de-scribes the necessary functions to be implemented in the WPIA. As alreadymentioned, knowing the precise phase relation between the waveforms and the timing of the pulses is very important. Therefore, waveformcalibration and data conversion such as transformation of the coordinate system are essential functions of the WPIA. In addition, as particle data are asynchronously obtained with respect to waveform data, we need information on their relative time difference to calculateEw·vaccurately.
Because the characteristics of wave receivers and sensors affect the amplitude and phase of the observed waveform, we need to calibrate the waveforms. The “Waveform Cal-ibration” block shown in Fig. 4 takes the role of canceling the effects of analog circuits and sensors. The importance of the phase relation between the observed electric field vec-tor and particle velocity vecvec-tor is stressed. It is essential to obtain calibrated phase in the WPIA. The calibration is conducted by the FFT (F) and IFFT (F−1) calculations
E 1, E 2, E// Waveform
Ex, Ey, Ez
I , I//
Ambient Magnetic Field (Elevation and Azimuth Angle) Incoming Pulse
v 1, v 2, v//
v 1, v 2, v// Waveform
Calibration
Coordinate Transformation
Coordinate Transformation
w
Time Correction
E v
Calculation / Data Accumulation
Fig. 4. Data flow diagramof the WPIA.
sensors,
X(f)=F[x(t)], (4) xcal(t)=F−1
G−1(f)X(f), (5) where x(t) denotes a time series of sampled raw wave-formdata,G(f)is the transfer function of the plasma wave receiver including its sensor characteristics measured in ground tests, andxcal(t)is the time series data of calibrated
waveforms. This calibration process should be applied to each component of a waveform. When the plasma wave receiver observes six components of waveforms sim ultane-ously (i.e., three components for electric fields and three components formagnetic fields), six calibration processes will run on the WPIA in parallel. Thus, the calibration pro-cess causes the heaviest load on the WPIA. In the SCOPE mission including the one-chip type of the WPIA, satel-lites are spin-stabilized and have short rigid electric anten-nas along the satellite spin axis. Though the sensitivity of the short rigid antenna is generallymuch worse than a long wire antenna deployed perpendicular to the spin axis, the spin-axis antenna will have enough sensitivity for observing target plasma waves because of the low noise preamplifier. Therefore, there is a difference of characteristics between the spin-axis antenna and wire antennas. The WPIA can calibrate waveforms using the independent calibration data for each axis of the antennas to providemeasurements of the three components of the electric field with good precision.
The physical properties of the wave-particle interactions should be referenced to the local ambientmagnetic field di-rection. The “Coordinate Transformation” block transforms the observed waveforms and particles relative to the am -bientmagnetic field. Figure 5 shows a typical coordinate systemin a spin-stabilized spacecraft.Bin Fig. 5 is the lo-cal ambientmagnetic field vector. The transform matrix is given by
rLM=
ˆ
α φˆrSC, rLM=
r⊥1,r⊥2,rT, rSC=
rx,ry,rz T
, (6)
ˆ φ=
⎛
⎝−cossinφφcossinφφ00
0 0 1
⎞ ⎠,αˆ=
⎛
⎝cos0α01 −sin0 α sinα 0 cosα
⎞ ⎠,
r
zr
r
//r
1r
r
2y
x
B
Fig. 5. Relation between the coordinate systemof the spacecraft and the ambientmagnetic field.
r
r
r
zx
y
v
Waveform
Time Incoming
Particle
Incoming Pulse
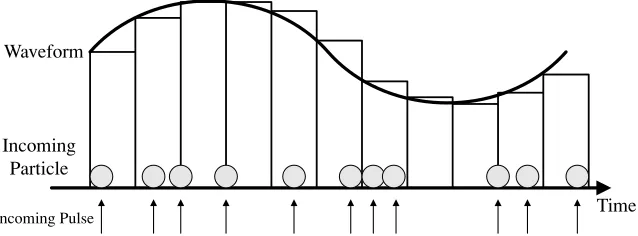
Fig. 7. Schematic illustration indicating that a waveformis sampled and held at a sampling frequency although the particles are asynchronously caught by the particle detector.
whererLMandrSCare given vectors fixed in the localm
ag-netic coordinate system and in the spacecraft coordinate system, respectively. Both suffixes ‘LM’ and ‘SC’ are ap-pended to electric field vectorE, and particle velocity vector
vin this paper. In the local ambientmagnetic field coordi-nate system, ⊥1 and⊥2 are two orthogonal components in the plane perpendicular to the ambientmagnetic field, means the direction parallel to themagnetic fieldB,φand
αare an azimuth and elevation angle, respectively.
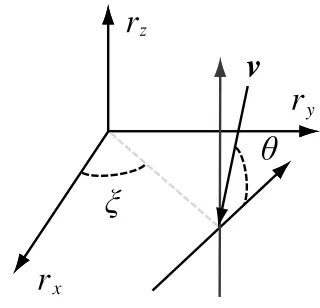
Moreover, since plasma sensors are independently lo-cated in different positions on the spacecraft, we need an-other transformation calculation. If we obtain particle data as shown in Fig. 6, the transformation for particle data is given by Eq. (7), whereξ is the constant angle between the particle sensor and therx-axis of the spacecraft coordinate
system,
vSC=
vx, vy, vzT
=v ⎛
⎝cossinξξ −cossinξξ 00
0 0 1
⎞ ⎠ ⎛ ⎝cos0θ
sinθ
⎞ ⎠=
⎛
⎝−vvcossinξξcoscosθθ
vsinθ
⎞ ⎠.
(7) The timing of particle detection pulses is not synchro-nized with the sampled waveforms of the plasma waves. The “Time Correction” block corrects the time difference in the observations of the waveforms and incoming particle pulses as shown in Fig. 7. To conduct the time correction, we need to know the precise relative time difference. The “Time Correction” block works as a controller to calculate
Ew·vwith enough accuracy in view of the relative time
difference.
The “Ew·vCalculation/Data accumulation” block
cal-culates Ew·vand sums up the results in the parallel and
perpendicular directions relative to the ambient magnetic field,
˜
I⊥=E⊥1v⊥1+E⊥2v⊥2, (8)
˜
I=Ev, (9)
where I˜⊥ and I˜ are the perpendicular and parallel components relative to the magnetic field, respectively, E⊥1,E⊥2, v⊥1, v⊥2 are the electric fields and particle
ve-locities in the perpendicular directions, and E, v are the
parallel components. Furthermore, “Ew·vCalculation”
ac-cumulatesI˜⊥andI˜to detect the wave-particle interactions, I⊥=I˜⊥=(E⊥1v⊥1+E⊥2v⊥2) , (10)
I=I˜=Ev. (11) The accumulated values of I⊥ and I are obtained as the physicalmeasure of the wave-particle interactions.
4.
One-chip WPIA
4.1 Advantagesof the One-chip WPIA
The fundamental functions and interconnections of the WPIA with other sensors were described in Section 3. The major functions of the WPIA can be realized by software running on a high-performance Central Processing Unit (CPU) or Digital Signal Processor (DSP). However, almost every computational resource of CPU or DSP is assigned to the WPIA due to the heavy load in the waveform calibra-tions andmanagement of the data transfer fromother sen-sors. We propose a one-chip WPIA as a solution for this dif-ficulty. The one-chip WPIA possesses all of the necessary functions described in Section 3. All of the functions are in-stalled in the Field Programmable Gate Array (FPGA). The one-chip WPIA has such advantages as real-time process-ing and low power consumption.
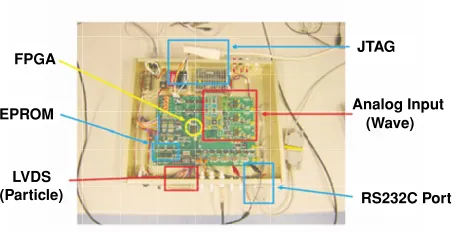
Figure 8 shows an evaluation board used in the develop-ment of the one-chip WPIA. It contains three channels of plasma wave receivers, input channels of themagnetic field and plasma instruments, as well as the FPGA. The three channels of plasma wave receivers collect waveforms at a sampling frequency of 62.5 kHz and transfer the waveform data with 16 bits to the WPIA through First-In First-Out (FIFO)memories. The frequency range to be observed in the plasma wave receivers is assumed to be fromseveral hundred Hz to around a dozen kHz in the SCOPEmission. Therefore the O-WPIA is expected to observe wave particle interactions involving plasma waves such as whistler-mode chorus, Langmuir wave, or etc. which have a frequency of less than a dozen kHz. These specifications of the plasma wave receivers are almost the same as those of typical ones for targeting observations in the terrestrialmagnetosphere.
FPGA
EPROM
LVDS (Particle)
JTAG
Analog Input
RS232C Port (Wave)
Fig. 8. Evaluation board for developing the one-chip WPIA. It contains the FPGA device (located in the center of the figure) and peripheral circuits including simple plasma wave receivers and simulators of plasma and
magnetic field sensors.
Table 1. Logic cells of Virtex-II XC2V1000 FG456.
Function Number
Logic Cells 11,520
Block Select RAM (kb) 720
18×18 Multipliers 40
Digital Clock Management Blocks 8
Max Dist RAM (kb) 160
Max Available User I/O 432
duration, the phase of the observed waves in the frequency range fromseveral hundreds of Hz to several kHz rotates much faster than the spacecraft spin velocity. Thismeans the O-WPIA can accumulate a lot of data on the phase relation ofEw·veven if the phase resolution of the particle
detector is coarse. Thus, it can keep enough signal-to-noise ratio with limitation of the field of view.
We adopt the FPGA of the XILINX XC2V1000 with 1 million gates. The operational clock frequency can be selected with an on-board switch as 1.920, 4.096, 40, or 100 MHz or by the external optional clock signal. In the present paper, we set the clock frequency to 4 MHz by feed-ing in an external clock signal. Constant values such as the calibration data of the waveforms can be loaded onto the FPGA fromthe Erasable Programmable Read-Only Mem -ory (EPROM) installed on the evaluation board. Detailed specifications of the FPGA applied to the one-chip WPIA are summarized in Table 1.
4.2 Design of the One-chip WPIA
4.2.1 Waveform Calibration Figure 9 shows the state transition diagram of the “Waveform Calibration” block. Asmentioned in Section 3, wemake use of the FFT and IFFT functions in the “WaveformCalibration” block. The transforms are implemented as complex FFT and IFFT which can concurrently transformtwo components of wave-forms by inputting two data sets into their real and im agi-nary parts. Therefore, two pairs of FFT and IFFT blocks are enough to conduct the calibration of three components of waveforms at once. We show a block diagramof the “Wave-formCalibration” in Fig. 10. The forward FFT blocks read the sampled raw waveforms fromthe FIFOs of the plasma wave receiver and obtain the results of the FFT
correspond-Initialize
Wait
FFT
Data Ready
Calibration
Start
Initilization Done
Fig. 9. State transition diagramof the “WaveformCalibration” block.
ing toX(f)in Eq. (4). Themultipliers calculate the prod-uct of the results of the FFT and calibration data which are loaded fromthe on-board EPROM into Block Select RAM memory (inside the FPGA) at the initialization stage of the system. The inverse FFT block calculates the inverse trans-formof the product and outputs the calibrated waveforms. The calibrated waveforms are stored in FIFOs on the FPGA and read out the sampling frequency at the next block.
In the FFT, the discrete frequency is
fk=
fs
Lk (k=0,1,2,· · ·L−1), (12) where L is the number of sampled data points and fs is
the sampling frequency, respectively. Note that X(k) is symmetrical, as indicated by Eqs. (14) and (15),
X(k)=
L−1
n=0
x(n)e−j2πLkn, (n =0,1,2,· · ·L−1) (13)
Re [X(L−k)]=Re [X(k)], (14) Im[X(L−k)]= −Im[X(k)], (15) whereX(k)can be obtained fromX(0)toX(L−1) sequen-tially and ismultiplied byH(k)which is the calibration data given by
H(k)=G−1(f)f=f
k =
e−jϕ(fk)
A(fk), (16)
=
⎧ ⎪ ⎪ ⎨ ⎪ ⎪ ⎩
Hreal(k)+ j Himag(k)
(0≤k<L/2−1) Hreal(L−k)−j Himag(L−k)
(L/2≤k<L−1),
(17)
whereA(fk), ande−jϕ(fk)denote the calibration data of the
plasma wave receiver in gain and phase, respectively. The calibrated waveformxcal(n)is obtained fromthe following
IFFT,
xcal(n)=
1 L
L−1
k=0
H(k)X(k)ej2πLnk. (18)
FIFO (in FPGA): 16bits x 1024words RAM: 2 kByte
FFT & IFFT: 1024 length Complex FFT
Calibration
Fig. 10. Block diagramof the “WaveformCalibration”.
FIFO. The number of data L affects the frequency resolu-tion as well as the processing time (equivalent to the time resolution). We need to choose it by considering the target phenomena fromthe point of view of frequency and time resolution. We also need to take into account the available logic gates of the FPGA in determiningL. In this paper,L is fixed at 1024, which is equivalent to a frequency resolu-tion of 61 Hz.
Since the load of the FFT calculations is the heaviest in the one-chip WPIA system, an estimation of the process-ing time of the FFT including the coordinate transform a-tion is important. The period (Tin) required to obtain the
waveforms depends on the number of dataL. Further, the period to calculate the forward and inverse FFTs (Tcal) also
depends onL. The “Coordinate Transformation” block pro-cesses the data inTtransequivalent to three cycles of the
sys-temclock. Thus, the total time (Ttotal) can be estimated as
the sumofTin,Tcal, andTtrans. The particle data to be
pro-cessed with the waveformdata are kept in the Block Select RAM during the period of Ttotal in order tomake it
possi-ble to conduct a series of calculations without delay. These periods are given by
4 MHz is the clock frequency of the FPGA, and Ncal and
Ntrans are the number of clock cycles of calibration and
coordinate transformation, respectively. In the case ofL = 1024, Ncal = 12542 cycles are needed to complete the
whole calibration process (data load and transformation: 6264 cycles/FFT, delay to output: 7 cycles/FFT; determined by specification of applied Intellectual Property (IP) core). Thus, the period and number of clock cycles are calculated
to be
Equation (27) implies that the calibrated waveforms are obtained after 78081 clock cycles.
The count rate of the plasma detectors should also be con-sidered in the design of the one-chip WPIA. It strongly de-pends on the plasma flux and on the sensitivity of the plasma sensors. In our current design of the one-chip WPIA, we as-sume themaximumcount rate is expected to be 105/s in the
SCOPEmission along its orbit inside the magnetosphere. Therefore the expected number of particle count pulses for the period ofTtotal =19.52025ms is 1952. The bit width
of the Block Select RAMs for particle data is 65, since we need to store 16-bit velocity data for particles in three di-mensions and 17-bit time information at which each parti-cle is detected. In considering the amount of RAM to keep the particle data, wemust setL to be less than or equal to 1024.
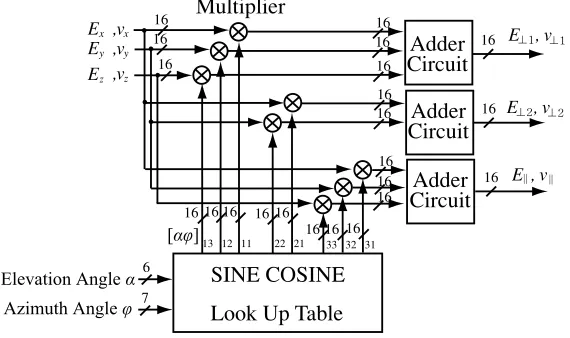
4.2.2 Coordinate Transformation The “Coordinate Transformation” blocks calculate the parallel and perpen-dicular components of the waves and velocities of the parti-cles in reference to the ambientmagnetic field,
ELM=
It is necessary to calculate the product of the twomatrices
ˆ
E
Adder
Circuit
SINE COSINE
Look Up Table
Multiplier
7 6
13 12 11 22 21 33 32 31
16 16
16
16 16 16 16 16
16 16 16 16 16 16 16 16 16
16 16
16 16 16
x ,vx E , v
E , v
E , v ,vy
,vz Ey Ez
Adder
Circuit
Adder
Circuit
Fig. 11. Block diagramof the “Coordinate Transformation” for the ambientmagnetic field coordinate system.
Particle Velocity v
Delay
SINE COSINE
Look Up Table
Multiplier
3
16 5
16 16
16 16 16
vx
vy
vz
Fig. 12. Block diagramof the “Coordinate Transformation” for the spacecraft coordinate system.
Waveform
Input
Output Calibration &
Coordinate Transformation
Particle Data Waiting
Calculating
Time Synchronize RAM 0
RAM 0 RAM 0
RAM 1 RAM 1
Fig. 13. Timing chart for the time correction. After the first input of waveformdata, calculations of the waveformcalibration and coordinate transformation start while the second input starts. The first particle data set is written in RAM0 and waits for the end of the calculations of the first waveformdata set. When the calculations are finished, RAM0 transfers the first data set and RAM1 takes the role of RAM0.
multiplication,
ELM=
ˆ
αφESC, (30)
vLM=
ˆ
αφvSC, (31)
ˆ αφ=
⎛ ⎝
cos(α+φ)+cos(α−φ)
2
sin(α+φ)−sin(α−φ)
2 sinα
−sinφ cosφ 0
sin(α+φ)+sin(α−φ) 2
−cos(α+φ)+cos(α−φ) 2 cosα
⎞ ⎠,
(32) where sinα, cosα, sinφ, cosφ, sin(α+φ), cos(α+
φ), sin(α−φ),and cos(α−φ)are obtained fromsine and cosine lookup tables.
The “Coordinate Transformation” needs three clock cy-cles. Two clock cycles are necessary for themultiplication and one clock cycle is necessary for loading the values from the tables.
The design of the “Coordinate Transformation” block for the spacecraft coordinate systemis shown in Fig. 12. This block transforms the speed of a particle and its incoming direction into the velocities (vx, vy, vz) before the other transformation is performed.
Time Incoming
Pulse
control bus data bus
Reference Clock Counter
Write Clock Counter
RAM0
RAM1
Multiplexer
Controller 17
10 10 17
16
16
48
16 vx
vy
vz
vx
vy
vz
16
16 16 16
Data
Write Address Counter Read Address Counter
Data Address
Address
Fig. 14. Block diagramof the “Time Correction”.
Incoming Pulse
78073 78074 78075 78076 78077 78078 78079 78080 78080
0
0 1 2 3 4 5 6 7
RAM Select Signal
v , v , v
Fig. 15. Datavandθare captured when the incoming pulse becomes ‘High’. It takes seven clock cycles to transformvandθintov⊥1,v⊥2, andv.
The incoming pulse is held in seven clock cycles to save information about time. Thus the “Reference Clock” is reset and the RAM select signal is inverted seven clock cycles behind the reset of the “Write Clock”.
Fig. 13. The “Time Correction” is a controller that syn-chronizes the waveform and particle data, as sketched in Fig. 14.
In the “Time Correction” block, the one-chip WPIA has two clock counters, which indicate the relative time differ-ence of the sampled waveforms and the detected plasma pulses. Both counters count at the clock frequency of the FPGA. One of the clocks is called the “Write Clock” and the other is the “Reference Clock.” While the “Write Clock” starts counting when the sampling of the raw wave-forms starts, the “Reference Clock” begins when the first calibrated waveforms are generated. The “Write Clock” and “Reference Clock” are reset to zero if the count of each clock reachesNtotalof 78081 clock cycles. Since two
Block Select RAMs are prepared inside the FPGA, they are switched between reading and writing by so-called switch-ing buffers. Both RAMs have individual address counters and they are reset to zero when the RAMs are switched. The transformation for the particle data needs seven clock cycles (load trigonometric function values: 2 cycles, twice multiplication: 2×2 cycles, hold sumof the products, 1 cy-cles). The “Reference Clock” is reset every seven clock cycles behind the reset of the “Write Clock” to synchronize accurately, as shown in Fig. 15. When an incoming pulse fromthe plasma instruments is detected, the count number of the “Write Clock” is held in a temporarymemory and the address counter of the writing RAM process is incremented.
The held count is stored again with the transformed velocity (v⊥1, v⊥2, v), in the area which the writing RAM address
indicates. After switching the roles of the RAMs, the stored count is compared with the “Reference Clock” count. If the stored count and the “Reference Clock” are equal to each other, the stored velocity is read out fromthe RAM and the RAM address is incremented. We can thereby obtain synchronized particle data with calibrated waveforms and calculateEw·v.
4.3 Calculation ofEw·v/Accumulation
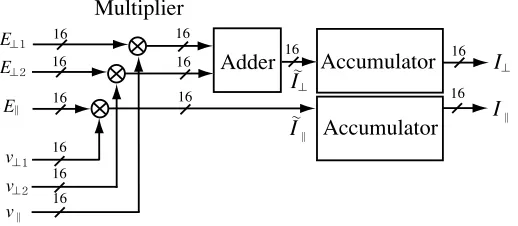
In the “Calculation ofEw·v/Accumulation” block, I⊥,
and I are calculated and accumulated for a given period represented by Eqs. (10) and (11). The accumulation time depends on the required time resolution. The amount of time needed to accumulateIandI⊥should be a few times larger than one period of the observed waves since we should consider phase relation between the plasma waves and particles for various phases of the plasma waves. The frequency of observed plasma waves is assumed to be less than a dozen kHz in the SCOPEmission. In this study, we use a period of 64 times theEw·vcalculation. Assuming
a particle count rate of 105/s, the time resolution is 640μs. This value is sufficient since it is equal to a few times larger than one period of the waves.
The design of the “Calculation of Ew · v” block is
Accumulator
Accumulator
Adder
I
I
Multiplier
16 16
16
16
16 16 16
16 16
16 16 16 E
v
v v E
E
I
I
Fig. 16. Block diagramof the “Ew·vCalculation”.
0 0.1 0.2 0.3 0.4 0.5 0.6 0.7 0.8 0.9 0
5 10 15 20 25 30
Time [sec]
I(t)
Fig. 17. Ten results ofI(t)=E(t)·v(t). There is only a time distinction between the curves.
E⊥1v⊥1,E⊥2v⊥2,andEv. Products in two perpendicular
directions (E⊥1v⊥1andE⊥2v⊥2) are added before accum
u-lation. The calculations ofI˜⊥andI˜are held in two separate accumulators. Themultipliers are enabled every time that particle data are read out fromthe “Time Correction” and the accumulators are enabled two clock cycles later.
5.
Performance
In this section, we demonstrate that the one-chip WPIA properly functions on the FPGA. We also estimate the power consumption of the one-chip WPIA with application to futuremissions inmind.
5.1 Operational accuracy
We checked the one-chip WPIA functions by giving it
E(t)andv(t)dummy data, which are time series of electric field and particle velocity vectors, respectively. In order to make it easy to examine the functions, we use the following simple dummy data,
E(t)=(E0sin(2πf t+ϕ),0,0)T, (33)
v(t)=
# v0
k δ
t− k fv
,0,0
$T
. (34)
HereEis a sinusoidal wave with frequency f, andvis a series of periodic pulses at a cycle of 1/fv expressed as
a sumof delta functions, respectively. Both Eand vare generated within the FPGA.
Assuming the ratio of f/fv is equal to an integer, the
output of the one-chip WPIA should be
I(t)∝t. (35) By using these dummy data, we can confirmthe functions of the whole one-chip WPIA including the “Waveform Cali-bration”, “Time Correction”, “Coordinate Transformation”, and “Calculation ofEw·v.”
Figure 17 shows the output I(t)of the one-chip WPIA for the above check configuration. Both of the frequencies f and fvare set to 3.90625 kHz, which is equal to exactly
1/16 of the sampling frequency of the wave receiver. The output I(t) is reset every 524ms in order to avoid over-flow of the accumulators in the “Calculation of Ew ·v.”
0 10 20 30 40 50 0
5 10
A
v
erage Error [de
grees]
†
†
3.90625kHz 5kHz 10kHz 15kHz 20kHz
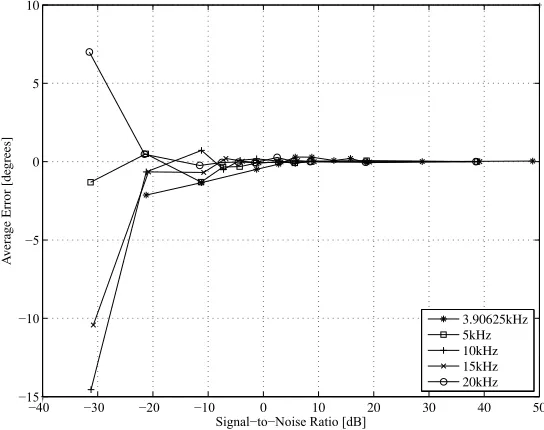
Fig. 18. Average errors in the “WaveformCalibration” are plotted against the signal-to-noise ratio at the frequencies of the input waveformof 3.90625 kHz, 5 kHz, 10 kHz, 15 kHz, and 20 kHz.
calculation ofEw·vwork properly.
5.2 Calibration errors
The phase of the collected waveforms are important in calculatingEw·v. We therefore need to evaluate the
ex-pected phase errors depending on the signal-to-noise-ratio (SNR). To do so, wemeasure the errors in the “Waveform Calibration” to examine the influence of noise.
The errors in the “WaveformCalibration” aremeasured as follows:
1. A sinusoidal waveformwith a fixed frequency is fed to the plasma wave receiver on the evaluation board. 2. The digitized waveformfromthe A/D converter is
in-put to the one-chip WPIA through the FIFO.
3. The waveforms at the input and output of the “Wave-formCalibration” block are transfered to the worksta-tion through the Joint Test Acworksta-tion Group (JTAG) cable. 4. The phase errors are measured by comparing the phases of the input and output waveforms on the work-station.
In thesemeasurements, wemake use of the calibration ta-ble in the whole frequency range at a gain of 0 dB and phase of 90◦. The frequencies are 5 kHz, 10 kHz, 15 kHz, 20 kHz, and 3.90625 kHz (= fs/16), which is chosen to investigate
the influence of the discretization. Themeasurements are conducted twenty times under the same conditions except for the initial phase of the raw waveforms. The average and standard deviation are calculated at each frequency.
In Figs. 18 and 19, these errors are plotted versus the SNR, at the indicated frequencies. The average errors are larger than 0 dB at small SNR because of the increased noise. The standard deviation of the errors becomes large when the SNR is smaller than 10 dB. Furthermore, at low frequency the standard deviation increases. The rela-tive difference between the true frequency of the raw wave-form and the discrete frequency of the calibrated
wave-forms is not related to the increase in the standard devia-tion at 3.90625 kHz. Therefore, since the waveformperiod in a fixed length FFT decreases with decreasing frequency, the larger standard deviation is caused by the growing data spread due to the difference in the initial phase of the wave-form.
In general, the angular resolution of a plasma detector is 20◦. If we assume that the errors have a normal distribution and less than 1% fall outside of the angular resolution range, then the SNR has to reduce the standard deviation to less than 1/2.576 of 10◦. That is, the SNR needs to be not less than−3 dB (at 3.90625 kHz) to realize the assumed precision. If less than 0.1% of the errors are to be out of the range, then the SNR should be at least 0 dB.
5.3 Power consumption
The power budget is a critical issue to be resolved in spacemissions. The allocation to each instrument depends on the spacecraft configuration. It is important to estimate the power consumption of the one-chip WPIA and its de-pendence on variations in its design.
The power consumption of the FPGA can be calculated using Xilinx Virtex-II Web Power Tool by inputing the number of logic gates and the systemclock frequency. The power consumed by the FPGA is 410mW with the one-chip WPIA configured by the “WaveformCalibration” con-taining two pairs of FFT-IFFT for three components of the waveforms, and the “Time Correction” with the allocation of 2048 words in the Block Select RAMs. The toggle rates are set to 20% and 5% for the “Waveform Calibration” and other components, respectively. These use a FFT data length of 1024 and a particle count rate of 105/s. In
0 10 20 30 40 50 0
5 10 15 20 25 30 35
Standard De
viation of Error [de
grees]
†
†
3.90625kHz 5kHz 10kHz 15kHz 20kHz
Fig. 19. Standard deviation of the errors in the “WaveformCalibration” are plotted against the signal-to-noise ratio at the frequencies of the input waveformof 3.90625 kHz, 5 kHz, 10 kHz, 15 kHz, and 20 kHz.
this total power consumption of 500mW is feasible for the SCOPEmission.
6.
Summary and Conclu
s
ion
Conventionally, the study of wave-particle interactions using observational data has been conducted by comparing the spectra of plasma waves with energy spectra or veloc-ity distributions of plasmas. However, the relation between the phase and timing of the detected particles has been ig-nored, despite its importance in wave-particle interactions. Some attempts at directlymeasuring the wave-particle in-teractions have beenmade by rocket experiments and space-craft observations (e.g., Ergunet al., 1991; Kletzinget al., 2005). They have focused on the relationship between the observed phase and the timing of the particle detections. However, since they counted particles by considering the observed wave phase, they did not obtain the physical en-ergy flows. The WPIA provides Ew·v, incorporating the
time variation of the kinetic energies during the interactions of the waves and particles.
The calculation ofEw·vrequires several procedures
in-cluding waveformcalibration and coordinate transform a-tion. The waveform calibration is essential to obtain the correct phase fromthe observed data. The calibration con-sists of a calculation of the FFT and IFFT. It requires a ded-icated digital processing component with high performance to accomplish real-time operation of the WPIA.
We succeeded in developing a new scientific instrument for studying wave-particle interactions in space. We called it the one-chip WPIA. It provides a solution for realizing the WPIA on a real-time basis with minimumresources. The one-chip WPIA is the FPGA which implements all of the necessary functions. The one-chip WPIA has been pro-posed for SCOPE (cross-Scale COupling in the Plasma uni-versE)mission which targets the investigation of the cross-scale coupling in the terrestrial magnetosphere (SCOPE
working group, 2008). In the present paper, we dem on-strated the design, functions, and performance of the one-chip WPIA. It consists of 4 blocks for individual functions of waveform calibration, coordinate transformation, time correction, and calculation of Ew·v. These blocks
oper-ate in cooperation with other necessary sensors. Since the one-chip WPIA calculatesEw·vin reference to the ambient
magnetic field, it needs data fromthe particle andmagnetic field instruments as well as fromthe plasma wave receivers. The WPIA directs the processes in the above blocks by co-ordinating the data flows fromthese sensors.
We realized a one-chip WPIA on an evaluation board containing a plasma wave receiver and an interface with plasma instruments and other components needed in the de-velopment of the one-chip WPIA. By using this evaluation board, we confirmed that the one-chip WPIA works as de-signed. We showed that it continuously calculatedEw·v
with enough precision and without delays.
Furthermore, we examined the accuracy of the waveform calibration by comparing the phase angles of the raw and calibrated waveforms. The accuracy was determined by the average and standard deviation of the error. The average and standard deviation explicitly increase when the SNR is smaller than 0 dB and 10 dB, respectively. Assuming an error range of 20◦ and a probability that the errors arising fromthe waveformcalibration are out of range by 1% or 0.1%, a respective SNR of greater than−3 dB or 0 dB is required. Though the large errors at lower frequency have to be reduced by using several different numbers of FFTs or by setting a lower sampling frequency, we achieved good accuracy in the major range of frequency to be observed (several hundred Hz to around a dozen kHz) in the SCOPE mission.
processing three components of waveforms sampled at 62.5 kHz and reading plasma data at a maximum count rate of 105/s. This specification is comparable to that of
spacemissions for observing the terrestrialmagnetosphere. Therefore, the one-chip WPIA is feasible for the SCOPE mission.
Themost important feature of the one-chip WPIA is to guarantee real-time observations. Although the function of the one-chip WPIA can be realized by software running on a CPU, continuous operation in real time would be diffi-cult. The software-type WPIA has been proposed for ERG (Energization and Radiation in Geospace), which is a small satellite mission focusing on the observation of the radia-tion belt of the Earth (ERG working group, 2008). On the other hand, a disadvantage of the one-chip WPIA compared to software WPIA is its smaller flexibility in the calcula-tion and accumulation ofEw ·v. For example, software
WPIA can change accumulation procedures depending on the wave-particle interactions. We have not examined how much flexibility one can expect in a one-chip WPIA. Since there exist various types of wave-particle interactions in space, flexibility in the calculation and data accumulation is important. The next goal in the development of the one-chip WPIA is to incorporate asmuch flexibility as possible.
Acknowledgments. As design tools for the FPGA, MATLABR
SimulinkR is provided by The MathWorks, Inc. and Xilinx Sys-temGenerator by XILINX, Inc. Themodules of FFT, Multiplier, and other logic functions are generated fromIntellectual Property core produced by XILINX, Inc. This work was supported by Toray Science and Technology Grant of Toray Science Foundation.
References
Buckley, A. M., M. P. Gough, H. Alleyne, K. Yearby, and I. Willis, Mea-surement of wave-particle interactions in themagnetosphere using the DWP particle correlator,Proceedings of Cluster-II workshop, 303–306,
2000.
Buckley, A. M., M. P. Gough, H. Alleyne, K. Yearby, and S. N. Walker, Firstmeasurements of electronmodulations by the particle correlator expeiments on cluster,Proceedings of the Les Woolliscroft Memorial Conference/Sheffield Space Plasma Meeting: Multipoint Measurements versus Theory, European Space Agency SP492, 19–26, 2001. ERG working group, Software-type wave-particle interaction analyzer,
Proposal of the ERGmission, 62–65, Japan Aerospace Exploration Agency, 2008 (in Japanese, submitted).
Ergun, R. E., C. W. Carlson, J. P. McFadden, J. H. Clemmons, and M. H. Boehm, Langmuir wave growth and electron bunching: Results froma wave-particle correlator,J. Geophys. Res.,96, 225–238, 1991. Ergun, R. E., J. P. McFadden, and C. W. Carlson, Wave-particle
correla-tor instrument design, inMeasurement Techniques in Space Plasmas: Particles, AGU, Geophysical Monograph 102, 325–331, 1998. Gough, M. P., Particle correlator instruments in space: Performance;
limitation, successes, and the future, inMeasurement Techniques in Space Plasmas: Particles, AGU, Geophysical Monograph 102, 333– 338, 1998.
Gough, M. P., D. A. Hardy, M. R. Oberhardt, W. J. Burke, L. C. Gentile, B. McNeil, K. Bounar, D. C. Thompson, and W. J. Raitt, Correlator
measurements ofmegahertz wave-particle interactions during electron beamoperations on STS,J. Geophys. Res.,100(A11), 21,561–21,575, 1995.
Kletzing, C. A., S. R. Bounds, J. Labelle, and M. Samara, Observation of the reactive component of Langmuir wave phase bunched electrons,
Geophys. Res. Lett.,43, doi:10.1029/2004GL021175, 2005.
Matsumoto, H., H. Kojima, T. Miyatake, Y. Omura, M. Okada, I. Nagano, and M. Tsutsui, Electrostatic solitary waves (ESW) in them agneto-tail: BEN wave forms observed by GEOTAIL,Geophys. Res. Lett.,21, 2915–2918, 1994a.
Matsumoto, H., I. Nagano, R. R. Anderson, H. Kojima, K. Hashimoto, M. Tsutsui, T. Okada, I. Kimura, Y. Omura, and M. Okada, Plasma wave observations with GEOTAIL spacecraft,J. Geomag. Geoelectr., 46, 59–95, 1994b.
SCOPE working group, One-chip wave-particle interaction analyzer, Pro-posal of the SCOPEmission, 449–458, Japan Aerospace Exploration Agency, 2008 (in Japanese, submitted).