Dynamic Response of RC Frame Building with
Plan Irregularity Using Base Isolation
Niranjan G M1, Pradeep A R2, Dharmesh.N3, Sanjith J4
P.G. Student, Department of Civil Engineering, SSIT, Tumkuru, Karnataka, India1
Assistant Professor, Department of Civil Engineering, SSIT, Tumkuru, Karnataka, India2
Assistant Professor, Department of Civil Engineering, EPCET, Bangalore, Karnataka, India3
Research Coordinator, Department of Civil Engineering, Adichunchanagiri Institute of Technology, Chikkamagaluru,
India
ABSTRACT: In the present study G+14 storey RC regular plan building and irregular plan building with plan dimension 31 X 35m located in zone 5 with hard soil condition (Type 1) is consider. Four models are considered, out of which two models are regular and two models are irregular plan building. Time history and Response spectrum (IS 1893-2002 Part-1) analysis are carried out for these four models using the software called ETABS, All the structural members are taken based on design criteria as per IS 456-2000. Response quantities are taken for the comparison and results are extracted and tabulated. The Response quantities are mode period, Base shear, Storey displacement and storey acceleration.
Based on analysis results, time history shows better performance both in Base shear and acceleration. Regular plan building increase base shear and acceleration using HDRB compared with irregular building for Response spectrum and Time history respectively.
KEYWORDS: ETABS, Regular plan Building, Irregular plan Building, HDRB, Response spectrum analysis, Time History analysis.
I. INTRODUCTION
II. LITERATURE REVIEW
W H Robinson 1 (1997) has briefly describe the principles of seismic isolation and discuss some of the isolation systems available before giving some examples of the application of seismic isolation to structure in New Zealand. The seismically isolated buildings fall into two board categories fragile structures of historic significance new structures with contents which need to be protected or continue to operate during and immediately after the earthquake. Examples of these structures are hospitals and other emergency canters. The seismically isolated bridges include both new and old bridges in areas of seismic activity.
Seismic isolation systems developed and used in New Zealand include- sliding bearings or flexible piles with steel or lead dampers providing the damping and lead rubber bearing which, in one unit provides both the isolation and the damping. To date more than fifty bridges and ten buildings have been isolated with most structures being isolated with lead rubber bearing systems.
P N Dubey 7 (2008) has briefly described the behaviour of base isolated buildings under actual earthquakes, two number of three-storied RCC framed buildings have been constructed at IIT, Guwahati campus, one with base isolation using lead plug bearing (LPB) and the other with conventional foundation. Accelerometers are installed at first floor and third floor of the both the buildings in order to record and compare the seismic responses of base isolated and conventional foundation buildings. The experimental buildings experienced earthquake of 5.2 Richter magnitudes on November 06, 2006. A study has been made on the date recorded on both the buildings and a comparison has also been made on the recorded data. Improvements required in the conventional analysis procedures are clearly brought out to obtain realistic structural seismic response in this paper.
P P Thakare (2011) has in short represented the behaviour of 3-storey RC building that is found in seismal zone IV is employed as check model. Lead plug bearing is employed and depicted victimisation additive force deformation behaviour. There are 2 main parts. the 2 parts are base isolators style and comparative study of the performances of fastened base-isolated condition and base isolated condition. Static analysis on fastened base condition and reanalysis of dynamic analysis on base-isolated condition is employed. Also, response spectroscopy and linear time history analysis ar used on each fastened base and base isolated buildings. The results are base isolation helps in reducing the planning parameter i.e. base shear and bending moment within the structural members on top of the isolation interface by around 4-5 times. Absolutely the displacement will increase however relative displacements are reduced so reducing the harm to the structure once subjected to AN earthquake. The shear and bending moments are reduce dowing to the upper period of the bottom isolated structure which ends in lower acceleration engaged on the structure and conjointly, owing to the magnified damping within the structure owing to the bottom isolation devices. By the dynamic analysis it's been found that the bottom shear reduced 55-60% in Response spectroscopy, whereas Time History Analysis Base shear reduces by 70-80%. Generally, the height displacements obtained by the time history analysis are but those of the response spectrum technique of study. This is often the case as a result of damping owing to the hysteretic result is over the equivalent damping thought-about within the response spectrum technique of study.
III. OBJECTIVES
The objective of study is as follows:
The principle objective of the study is to compare the structural efficiency of regular and irregular plan building with respect to the results obtained from the analysis in terms of mode period, displacement, base shear and acceleration.
G+14 storey building with plan 31 x 35 m located in zone V with soil type I modeled and analyzed using ETABS software.
All the structural members (beams and columns) are taken based on design criteria as per IS 456-2000.
The regular and irregular plan RC frame building is analyzed using Response Spectrum as per IS 1893-2002 part-1 and Time History analysis using Bhuj EQ data is used to obtain the results.
IV.MODELINGDESCRIPTION
4.1.1 Geometric parameters
Two 3D RC frames structures is considered in which first structure regular having the dimension in X-direction is 31m and in Y-direction is 35m and considering 15 storey(G+14) .And the second structure building is considered in irregular plan having same dimension of first structure. This two structures has been taken for seismic analysis.
4.1.2 Geometric Properties
Special moment-resisting frame (SMRF).
Building has different spans in both x and y – directions as shown in Fig 4.3.
The height of each storey is – 3m.
Live Load as 2.0 kN/m2
Floor Load as 1.0 kN/m2.
Column size as 600x800mm.
Beam size as 400 x 500mm.
Slab thickness as 150mm.
The soil type is medium - I
Importance factor is I- 1.5
Zone factor - V
Note: The Imposed Load is 3.0kN/m2 as per code 1893:2002 (Part I) Table No. 8 the percentage of imposed load as to be considers 25% only.
Material properties.
Element Parameters Characteristics
Grade of concrete M40 For Slab, Beam And Column
fck = 40 N/mm2
Density of Concrete 25 kN/m3
Modulus of Elasticity of concrete 5000√fck 31.62X10⁶ kN/m2
Density of brick masonry 19.2 kN/ m3
Grade of Steel Fe500 500 N/mm2
Poisson's Ratio µ 0.2
4.2 Models considered for the study
Building Type
Case (a) G+14 of Regular plan
Model-1: RC frame building with fixed base.
Model-2: RC frame building with High Damped Rubber Bearing (HDRB).
Case (b) G+14 of Irregular plan
Model-3: RC frame building with fixed base.
Case (a) Regular plan Case (b) Irregular Plan
Fig 4.2 G+14 regular plan structure. Fig 4.3 G+14 Irregular plan structure.
V. RESULTANDDISCUSSION
5. 1 Mode Period
a) G+14 storey of regular plan building
Table 5.1 Comparison of mode period for different Models
. Fig 5.1 Comparison of mode period for different Models
b) G+14 storey of Irregular Plan
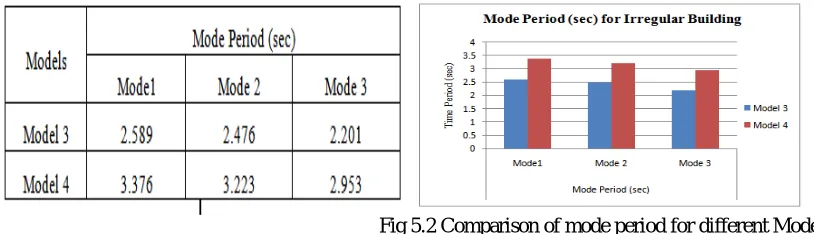
Table 5.2 Comparison of mode period for different Models.
Fig 5.2 Comparison of mode period for different Models
The mode period is maximum in model-1 when compared with mode-2 and mode 3 in all other models. Mode period decreases with increase in mode number.
From fig 5.2, it is observed that ,mode period is more i,e 3.376 sec in model-4 when compared with model-3 i,e 2.589 sec for irregular plan building.
5.2 Base Shear
a) G+14 Storey of Regular plan:
Table 5.3: Variation of base shear in X & Y direction for bare frame with base isolators.
Figure 5.3: Base Shear (kN) in bare frame of G+14 of
regular plan with base isolators in X & Y direction. b)G+14 Storey of Irregular plan:
Table 5.4: Variation of base shear in X & Y direction for bare frame with base isolators.
Figure 5.4: Base Shear (kN) in bare frame of G+14 of Irregular plan base isolators in X & Y direction.
From fig 5.3, it was observed that , Base shear decreases by 21% and 20% in model-2 when compared with model-1 along x and y-direction in Response spectrum.
Similarly it was decreased by 54% and 47% in model-2 when compared with model-1 along X and Y-direction in Time History for regular building.
From fig 5.4, it was observed that , Base shear decreases by 18% and 19% in model-4 when compared with model-3 along x and y-direction in Response spectrum.
Similarly it was decreased by 51% and 42% in model-4 when compared with model-3 along X and Y-direction in Time History for irregular building.
0 2000 4000 6000 8000
RSx Rsy THx Thy
Base Shear of Regular building
Model 1
5.3 Storey Displacement
a) G+14 Storey of Regular plan:
Table 5.5: Comparison of maximum displacement for fixed base with response spectrum and time history analysis.
Figure 5.5: Maximum Displacement (mm) in bare frame of G+14 for fixed base with response spectrum and time history.
Table 5.6: Comparison of maximum displacement for HDRB with response spectrum and time history analysis.
Table 5.7: Comparison of maximum displacement for fixed base with response spectrum and time history analysis.
Figure 5.7: Maximum Displacement (mm) in bare frame Of G+14 for fixed base with response spectrum and time history
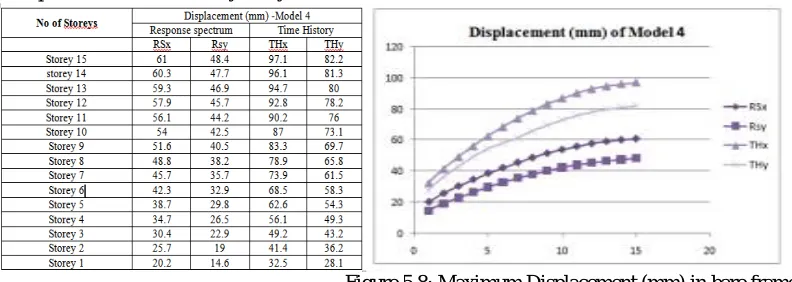
Table 5.8: Comparison of maximum displacement for HDRB with response spectrum and time history analysis
Figure 5.8: Maximum Displacement (mm) in bare frame of G+14 for HDRB with response spectrum and time history.
a) G+14 Storey:
Table 5.9: Comparison of maximum storey acceleration for fixed base with response spectrum and time history analysis.
Figure 5.9: Maximum Acceleration in bare frame of G+14 for fixed base with response spectrum and time history.
Table 5.10: Comparison of maximum storey acceleration for HDRB with response spectrum and time history analysis.
Table 5.11: Comparison of maximum storey acceleration for fixed base with response spectrum and time history analysis
Figure 5.11: Maximum Acceleration in bare frame of G+14 for fixed base with response spectrum and time history.
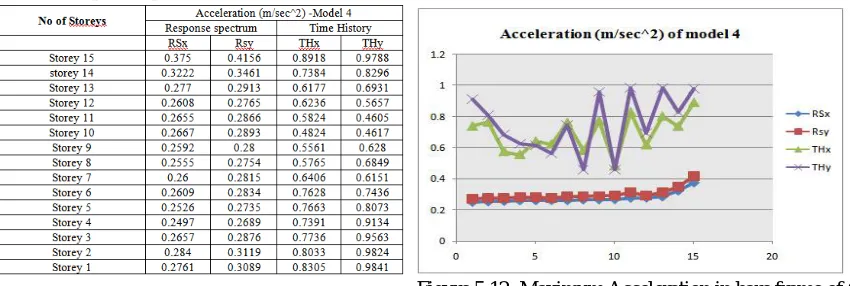
Table 5.12: Comparison of maximum storey acceleration for HDRB with response spectrum and time history analysis
Figure 5.12: Maximum Acceleration in bare frame of G+14 for HDRB with response spectrum and time history.
From fig 5.9, it is observed that , acceleration is more in storey-15 when compared with bottom storeys in all models along X and Y-directions both in Response Spectrum and Time History respectively.
Acceleration is increases by 80% and 79% in storey-15 compared to storey-1 in model-1 for RS analysis along X and directions. Similarly, 69% and 58% in storey-15 compared to storey-1 in model-1 for TH analysis along X and Y-direction. From fig 5.10 , it is observed that , acceleration is more in storey-15 when compared with bottom storeys in all models along X and Y-directions both in Response Spectrum and Time History respectively.
Acceleration is increases by 25% and 24% in storey-15 compared to storey-1 in model-2 for RS analysis along X and directions. Similarly, 5% and 3% in storey-15 compared to storey-1 in model-2 for TH analysis along X and Y-direction. From fig 5.11, , it is observed that , acceleration is more in storey-15 when compared with bottom storeys in all models along X and Y-directions both in Response Spectrum and Time History respectively.
VI.CONCLUSION
Following conclusions can be made from the analysis Mode period
Mode period increases in High Damped Rubber Bearing when compared with fixed base building both in regular and irregular plan building. Because, flexibility is more in High Damped Rubber Bearing compared to fixed base.
Plan Irregular building mode period is less when compared with regular plan building. Because mass participates less in irregular when compared to regular plan building.
Mode period is directly proportion to the mass of the structure, the mass of the structure increases, the mode period also increases.
Base shear
Base shear is directly proportional to the weight of the building. Base shear is more along x-direction when compared with y-direction both in Response spectrum and Time History respectively. Because mass participation factor more in x-direction.
High Damped Rubber Bearing (Model-2 & Model-4) base shear is less both in Response Spectrum and Time History when compared with fixed base building (Model-1 & Model-3).Base shear is more in regular plan building along x and y-direction when compared with irregular both in Response Spectrum and Time History. Because mass participation factor is more in regular plan building.
Time History analysis shows, maximum reduction in Base Shear (model-2 & model-4) both in regular and irregular plan building along x and y-direction when compared with Response Spectrum analysis for model-1 and model 3 (Fixed base building).
Displacement
Displacement has increased with increase in number of storeys for all models (both regular and Irregular plan building)..
Displacement is maximum at the top storey when compared with bottom storeys both in Response Spectrum and Time History for regular and Irregular plan building along x and y-direction.
Displacement is more in Time History analysis in all models when compared with Response Spectrum analysis.
Displacement is increases in model-2 and model-4 (HDRB) when compared with model-1 and model-3 (fixed base) for both in Response Spectrum and Time History because of flexibility is present in HDRB along x and y-direction.
Displacement is less in y-direction when compared with x-direction because stiffness participates more along y-direction.
Acceleration
Acceleration is maximum in storey-15 when compared to storey-1 in all other models along x and y-direction but in Response Spectrum and Time History respectively.
Acceleration is maximum in irregular plan building when compared with regular plan building because displacement is more in irregular along x and y-direction.
Acceleration is less in model-2 and model-4 (HDRB) when compared with model-1 and model-3 (fixed base) both in RS and TH. This shows using HDRB reduce the acceleration.
REFERENCES
1. A.N Lin and H.W Shenton, “Seismic performance of fixed-base and base-isolated steel frames”, ASCE, Vol. 118, No.5, ISSN 0733-9399, May, 1992.
2. A.Sharma and R.S Jangid, ”Behavior of Base Isolated Structure with High Initial Isolator Stiffness”, Journal of World Academy of Science Engineering and Technology, No.50, pp. 186-191, (2009).
3. . A.B.M Saiful islam et al, “Simplified design guidelines for seismic base isolation in multistorey buildings for BNBC”, international journal of the physical sciences, Vol. 6 (23), pp.5467- 5486, 9 October, 2011.
4. A.B.M Saiful islam et al, “Seismic isolation for buildings in regions low to moderate seismicity: Practical alternative design”, ASCE, Vol. 17, No.1, ISSN 1084-0680, 1 February, 2012.
5. . Desai Amit R, Dr.R.K.Gajjar, “Structural Control system for mid-rise building”, International Journal of Advanced Engineering Technology, EISSN 0976-3945.
6. . Dr. Hadi Nasir Ghadhban AL-Maliki, “Analytical Behavior of Multi-Storied Building with Base Isolation Subjected to Earthquake Loading”, Journal of Engineering and Development, Vol. 17, No.2, 2013, ISSN 1813- 7822.
7. H.W.Shenton and A.N.Lin, “Relative performance of fixed base and base isolated concrete frames”.
8. M. Qamaruddin (1998), “A state of the –art review of seismic isolation scheme for masonry building”, ISET journal of Earthquake Technology.
9. Hadj Mohamed ounis (2011), “Effect of the damping on the seismic response of a base isolated building”, world young research. 10. Shirulepravin Ashok, Niraj Mehta, Rahul wagh, Mayer padhijas, Ankesh samera and Yogeshpatil (2012), “Base response spectrum
analysis of multistoried base-isolated building”, IJCSIERD.
11. P.N Dubey, G.R.Reddy, K.K.Veze, A.K.Ghosh, H.S.Kushwaha, S.K.Deb,(2008), “Performance of base isolated RCC framed building under actual earthquake”,Journal of structure engineering.