Copyright 0 1993 by the Genetics Society of America
Positive and Negative Regulatory Elements Control Expression
of the
Yeast Retrotransposon Ty3
Virginia W. Bilanchone, Jonathan A. Claypool, Philip T. Kinsey and Suzanne B. Sandmeyer
Department of Microbiology and Molecular Genetics, University of Calfornia, Imine, California 9271 7 Manuscript received October 29, 1992
Accepted for publication March 12, 1993
ABSTRACT
We report the results of an analysis of T y 3 transcription and identification of T y 3 regions that mediate pheromone and mating-type regulation to coordinate its expression with the yeast life cycle. A set of strains was constructed which was isogenic except for the number of Ty3 elements, which varied from zero to three. Analysis of T y 3 expression in these strains showed that each of the three elements was transcribed and that each element was regulated. Dissection of the long terminal repeat regulatory region by Northern blot analysis of deletion mutants and reporter gene analysis showed that the upstream junction of Ty3 with flanking chromosomal sequences contained a negative control region. A 19-bp fragment (positions 56-74) containing one consensus copy and one 7 of 8-bp match to the pheromone response element (PRE) consensus was sufficient to mediate pheromone induction in either haploid cell type. Deletion of this region, however, did not abolish expression, indicating that other sequences also activate transcription. A 24-bp block immediately downstream of the PRE region contained a sequence similar to the al-a2 consensus that conferred mating-type control. A single base pair mutation in the region separating the PRE and al-a2 sequences blocked pheromone induction, but not mating-type control. Thus, the long terminal repeat of Ty3 is a compact, highly regulated, mobile promoter which is responsive to cell type and mating.
E
X P R E S S I O N of integrated retroviruses and re- trovirus-like elements is governed by some of the most intricate regulation known in prokaryotic and eukaryotic cells. This reflects the balanced demands of host genome fitness and extra-genomic element proliferation. Examples of highly regulated expres- sion of viruses include the tissue-specific, glucocorti- coid-responsive transcription of mouse mammary tu- mor virus and the trans-activation of complex lentivi- ruses (MAJORS 1990). Among transposable elements, regulation of expression can be similarly stringent as evidenced by the antisense regulation of TnlO (SI- MONS and KLECKNER 1983) and the germline-specific splicing of P element RNA (MULLINS, RIO and RUBIN 1989). Initial studies have suggested that expression of the Saccharomyces cerevisiae retrotransposon, Ty3,is also highly regulated. Its expression is coordinated with the yeast life cycle and is representative of the haploid-specific, pheromone-inducible class of genes.
Wild-type S. cerevisiae is a diploid organism which can grow vegetatively, or under conditions of nutrient deprivation, undergo meiosis and sporulation. Hap- loids are of two mating types, a and a , which are restricted to mitotic growth, but which are capable of conjugation to produce the a / a diploid cells. Cell identity, a , a or a/a, is determined by the regulated expression of genes which determine cell-type func- tions. These genes can be classified with regard to the cell type in which they are expressed, such as a- or
Genetics 134: 685-700 uuly, 1993)
a-, o r haploid-cell specific. T h e differential expression of all these genes is controlled at the level of transcrip- tion by interaction of positive and negative transcrip- tion factors with promoter elements and is ultimately specified
by
the allele(s) a or a , represented at the mating-type (MAT) locus (reviewed by MARSH, NEIN- MAN and HERSKOWITZ 1991). T h e protein products of the MATa and the MATa loci, a l , a 1 and a2,mediate this control. In haploid a cells, a 1 binds with the MCMl product (a serum response factor-like pro- tein) (JARVIS, CLARK and SPRAGUE 1989) to PQ control elements to promote transcription of a-specific genes (BENDER and SPRAGUE 1987; JARVIS, HAGEN and SPRAGUE 1988; TAN, AMMERER and RICHMOND
1988). In haploid a cells, the MCMl-encoded protein binds to the promoter sequence, P , and contributes to activation of transcription of a-specific genes (BENDER and SPRAGUE 1987; TAN, AMMERER and RICHMOND 1988; KRONSTAD, HOLLY and MACKAY
V. W. Bilanchone et a l .
1992). In diploid cells, the transcription of genes restricted to haploid cell types is repressed directly by binding of a1 and
a 2
homeodomain proteins (SHEP- HERD et al. 1984; LAUGHON and SCOTT 1984; SCOTT, TAMKUN and HARTZELL 1989) in conjunction with the TUPI- and SSN6-encoded proteins (GOUTTE andJOHNSON 1988; DRANCINIS 1990; MUKAI, HARASHIMA
and OSHIMA 1991 ; KELEHER et al. 1992; FUJITA et al.
1992) to a l a 2 operator sites (MILLER, MACKAY and NASMYTH 1985; SILICIANO and TATCHELL 1986) or indirectly because of reduced levels of STEI2-encoded protein (FIELDS and HERSKOWITZ 1987).
A subset of genes encoding products required for conjugation of a and a cells, are regulated by exposure to pheromone [reviewed by SPRACUE (1991)l. Inter- action of the pheromone, a- or a-factor, with the respective receptor stimulates a signal transduction pathway. Genes regulated by a-factor induction con- tain copies of a
7-
or 8-bp pheromone response ele- ment [PRE; (A)TGAAACA] (KRONSTAD, HOLLY and MACKAY 1987; VAN ARSDELL and THORNER 1987). T h e STEl2-encoded protein has been shown to inter- act with this sequence and also to mediate induction (COMPANY, ADLER and ERREDE 1988; DOLAN, KIRK- M A N and FIELDS 1989; ERREDE and AMMERER 1989; HWANG-SHUM et al. 1991). Although the PRE-de- pendent a-factor response in a cells has been more intensively studied, the PRE sequence has also been shown to mediate a-factor induction of the haploid- specific gene FUSl in a cells by a-factor (HACEN, MCCAFFREY and SPRAGUE 199 1). In the absence of a consensus PRE element in the promoter region of the a-cell specific gene STE3, however, it was argued that a PQ element mediated the a-factor response (SEN-GUPTA and COCHRAN 1990).
T h e retrotransposon, Ty3, is 5.4 kbp in length and consists of an internal domain flanked by 340-bp long terminal repeats (LTRs) or u elements. It occurs in one to four copies in the typical haploid genome (CLARK et al. 1988). T h e 5.2-kb T y 3 transcript is initiated in the upstream LTR and terminated in the downstream LTR. It contains two open reading frames, GAG3 and POL3, which encode structural and catalytic proteins required for transposition (HANSEN, CHALKER and SANDMEYER 1988) and it is analogous
to the retroviral genome. Haploid yeast genomes also contain about 30 copies of solo Ty3 LTRs. Both isolated LTRs and Ty3 elements are found within 16-19 bp of mature tRNA coding sequences [refer- enced in SANDMEYER et al. (1988)l and de nouo inte- gration has been found to be specific for the region of polymerase 111 transcription initiation (CHALKER and SANDMEYER 1992).
T h e results from previous studies suggested that Ty3 expression is regulated by a-factor in MATa cells and by mating type in MATa/a cells. Northern analysis
using a Ty3 probe indicated that the 5.2-kb Ty3 genomic RNA was among the transcripts induced by a-factor treatment of a cells. Ty3 RNA was detected in haploid cells of both mating types (CLARK et al.
1988), but not in a / a cells (VAN ARSDELL, STETLER and THORNER 1987; CLARK e t al. 1988). Because levels of some transcripts derived from solo sigma elements are responsive to these forms of regulation, the LTR was predicted to contain sequences sufficient for a-factor induction and mating-type repression (VAN ARSDELL, STETLER and THORNER 1987; CLARK et al. 1988). Inspection of the T y 3 LTR revealed four sequences with similarity to the 8-bp PRE sequence, but only one was an exact match to the consensus and one was a six of eight match (VAN ARSDELL and THORNER 1987). T w o regions that showed some sim- ilarity to the a l a 2 operator sequence which mediates mating-type control were also detected within the LTR. The functional significance of these sequences was not known. Further, whether Ty3 has UAS ele- ments in addition to PRE was not known.
T h e T y 3 promoter by virtue of its mobility and position specificity is potentially subject to regulation in addition to mating-type and pheromone regulation. T h e tRNA gene initiation factor, TFIIIB, binds over the region up to approximately 40 bp upstream of the tRNA gene (KASSAVETIS et al. 1989). Where the Ty3 element is in the common, transcriptionally divergent orientation with respect to the tRNA gene (SAND- MEYER et al. 1988), this transcription factor could be bound over the upstream end of the LTR. This por- tion of the LTR contains potential regulatory regions for a-factor and mating-type control of T y 3 expres- sion, and the formation of the tRNA transcription complex might occlude binding of transcription fac- tors to Ty3. Furthermore, Ty3 expression could also be subject to the types of genomic context effects or autoregulation which is documented for retroviruses (reviewed by VARMUS and BROWN 1989; MAJORS
1990).
MATERIALS AND METHODS
General methods: Plasmid amplification and recombi- nant DNA manipulations were carried out in Escherichia coli
strain HB10 1 using standard methods (AUSUBEL et al. 1992). Yeast culture conditions were as described by SHERMAN, FINK and HICKS (1 986). Yeast were transformed by a mod- ification of the LiAc method (ITO et al. 1983). Gene trans- placement was based on the procedure described by ROTH- STEIN (1983). T h e mating type of several yeast strains was changed by activity of the HO gene product introduced on plasmid pHO-c12 (HERSKOWITZ and JENSEN 1991).
Yeast strains: T h e S. cerevisiae strains used in this work are listed in Table 1. To facilitate the analysis of transcrip- tion of Ty3, an isogenic set o f strains containing three, two, one and zero T y 3 elements was constructed from strain VB109. VB109 contains three Ty3 elements designated I,
Control of T y 3 Expression 687
TABLE I
S. eetevisiae strains used i n t h i s study
Strain Genotype Source
VB109 M A T a ade2-I01 hisjA200 leul-12 lys2-1 trpl A901 ura3-52ga13 canl-100 [ T y j I T y 3 I I T y 3 I I I I T h i s work
VB129 M A T a (as VB109) This work
VBI 1 1 M A T a / a (as VB109) T h i s work
VBI 16 MATa ste2 (as VB109) This work
VBI 17 matax50/a (as V B l 1 1 ) T h i s work
J12-8C M A T a ade2-1 leul-12 lys2-I met4-I trp5-2 ural-1 canl-100 KURJAN and HALL (1 982)
XP635-1OC MATa leu2-3,12ga12 bar1 HARTIC et al. (1 986)
RC634 MATa ade2 his6 met1 rmel sstl-3 ural JULIUS et al. (1 983)
VB155 MATa [Ty3I::URA3] (as VB109) T h i s work
VB147 MATa [TyjII::URAj] (as VB109) T h i s work
VB144 MATa [TyjIII::URA3] (as VB109) This work
VB141 MATa [Ty3IA] (as VB109) T h i s work
VB159 MATa [ T y j I I A ] (as VB109) T h i s work
VB160 MATa [ T y j I I I A ] (as VBlO9) This work
VB164c M A T a (as VB159) T h i s work
VB165b M A T a (as VB160) T h i s work
VBI 70a MATa T y j I I I A ] [ T y j I T y j I I A (as VB109) T h i s work V B 1 7 l b MATa T y j I I I A ] [ T y j I A T y 3 I I (as VB109) T h i s work
VB173d M A T a (as V B 1 7 l b ) T h i s work
VB174d MATa T y j I I I ] [ T y j I A T y 3 I I A (as VB109) T h i s work
VB175a M A T a [(as V B l 7 4 d ) This work
V B l l O MATa [Ty%null] (as VB109) T h i s work
VB194c MATa [TyS-null] (as VB109) T h i s work
VB198d MATH [Tyj-null] (as VBlO9) T h i s work
VBI 14 M A T a [Tyj-null] (as VB109) T h i s work
V B l 1 5 M A T a / a [Ty%null] (as VB109) T h i s work
fragment inserted at the Sal1 site. Transformants were selected in uracil-minus medium. Southern analysis of ge- nomic DNA using URA3 and T y 3 probes identified strains in which the marked Ty3 had transplaced Ty31, Ty31I or Ty3III (VB155, VB147 and VB144, respectively). Strains in which the internal domain of the Ty3::URA3 element was deleted by recombination between the LTRs, were selected by growth on medium containing 5-fluoro-orotic acid (5- FOA) (BOEKE, LACROUTE and FINK 1984). These strains were VB141 (Ty31A), VB159 (Ty3IIA) and VB160 (Ty3IIIA). T h e Ty3 complement of strains was determined by Southern blot analysis of genomic DNA using Ty3 and LTR probes. T o derive strains containing either Ty31, Ty3II or Ty31II only, the mating type of strains VB159 (Ty3IIA) and VB160 (Ty3IIIA) was changed from MATa to MATa described in General Methods) to yield strains VB164c and VB165b. T h e strains containing deletions of individual T y 3 elements were mated [VB141 (MATaTy3IA)
X VB165b (MATaTy3IIIA); VB141 (MATaTy3IA) X
VB164c(MATaTy3IIA); VB160(MATaTy3IIIA)X VB164c (MATaTy3IIA)], and diploids were isolated, and sporulated. Colonies from individual spores were tested by Southern analysis, and strains containing a single Ty3 element (VB170a, Ty31 only; VB171 b and VB173d, Ty3II only; and VB174d and VB175a, Ty3III only) were identified. T h e strains containing a single Ty3 element were mated (cross A: VB170a X VB173d; cross B: VB170a X 175a; cross C: VB17 l b X 175a), sporulated, and the Ty3-null strains were identified. These strains were VBl 10 and V B l l 4 (from cross A), VBI 94c and VBI 98d (from cross C). Ty3-null strains were derived from cross B, but were not used in this work. Strains VB110 (MATa) and VB198d (MATa) were mated to derive the Ty3-null strain VB115 (MATa/a).
Plasmids: T h e plasmids used in this work are listed in Table 2. Two sets of plasmids were used to study Ty3 expression. In the first set, the effects on Ty3 expression of specific base pair changes in the Ty3 LTR were tested. T h e changes in plasmids pPK199, pVB275, pVB276, pVB186 and pVB278 were made by oligonucleotide-directed muta- genesis (KUNKEL 1985) of single-stranded DNA derived from pVB192. Plasmid pVB192 has the HindIII-Sal1 frag- ment of Ty3-1, which contains the 5’ LTR of Ty3, inserted into pIBI20 (International Biotechnologies, Inc.). All changes were confirmed by DNA sequence analysis. Ty3 DNA containing the changes replaced wild-type Ty3-1 se- quence in pVB 19 1. T o facilitate this cloning, plasmid vector pVBI9O was constructed by digestion of YCp50 DNA with Sal1 and BamHI, incubation with the Klenow fragment of DNA polymerase and nucleotides, and religation. T h e re- sulting plasmid was deleted for the sequences between the
Sal1 and BamHI restriction endonuclease sites, and both restriction sites were destroyed. T h e deletions in plasmids
pPK199,pVB198,pVB194,pVB482,pVB485andpVBl85
were constructed by digestion of mutagenized Ty3-1 and religation of appropriate DNAs.
TABLE 2
S. cerevisiae plasmids used in this study
Plasmid Insert Base plasmid Source
pHO-cl2 HO YCp50 RUSSELL et al. (1986)
pZV63 ste2 p u c 12 HARTIG et al. (1 986)
196 matax50 YRp7 TATCHELL et al. (1 98 1)
pSBS6 [sigma] pSP64 CLARK et al. (1988)
YIp5 STRUHL et al. (1979)
pVB19O A(376/654) YCp50 This work
pVBI91 Ty3-1 pVBI9O This work
pVB192 Ty3-1 (HzndIII-Sal I) pIBI20 This work
pPKl99 TyjA(-88/-11) pVB19O This work
pVB275 Ty3(- 13/-8) pVB19O This work
pVB276 T y 3 ( 18/23) pVB 190 This work
pVB198 Ty3A(-11/18) pVBl90 This work
pVB186 TY476) pVB19O This work
pVB278 Ty3(9 1 /95) pVBI9O This work
pVBl94 Ty3A(79/91) pVB 190 This work
pVB482 Ty3A(- 1 1/9 1) pVB19O This work
pVB485 Ty3A(19/91) pVB 190 This work
pVB185 TyjA(76) [A-600/76] pVB19O This work
pVB509 Ty3(-26/105) pLGA-3 12 This work
pVB542 Ty3(31/105) pLGA-3 12 This work
pVB5 14 T y 3 ( 105/3 1) pLGA-3 12 This work
pJC63 1 Ty3(M31/105) PLGA-3 12 This work
pJC632 Ty3(M 105/3 1) pLGA-3 12 This work
pVB48 1 Ty3(56/97) pLGA-3 12 This work
pVB480 Ty3(97/56) pLGA-3 12 This work
pJC633 Ty3(-26/3 1) pLGA-3 12 This work
pVB5 12 Ty3(31/-26) PLGA-3 12 This work
pJC634 Ty3(31/56) pLGA-3 12 This work
pTy3-1 Ty3- 1 pIBI2O CLARK et al. (1 988)
pLGA-3 12 CYC1-lac Z GUARENTE and MASON (1 983)
and pVB480, complementary oligonucleotides correspond- ing to the Ty3 sequence 56/97 bp, and flanked by sequences to form XhoI cohesive ends, were synthesized (oligonucleo- tide 13 1,5’-tcgaGATAAAACACATATGAAACAA-CCT- TATAACAAAACGAACAACAc-3‘ and oligonucleotide
132, 5”tcgaGTGTTGTTCGTTTTGTTATAAGGTTG-
TTTCATATGTGTTTTATc-3’). The oligonucleotides were annealed and cloned into the XhoI site in pLGA-3 12. For the remainder of the pLGA-312-based plasmids, Xhol- flanked Ty3 fragments were derived by polymerase chain reaction (PCR) (SAIKI et al. 1988). The oligonucleotide primer sets contained XhoI recognition sites near their 5‘- ends [5’-GCTCCTCGAG-(22/23 nucleotides of Ty3 se- quence) 3‘, XhoI site underlined] and Ty3-1 DNA was used as the template. The PCR-derived fragments were digested with XhoI and cloned into the XhoI site of pLGA-3 12. The sequence and orientation of the inserted Ty3 DNA in pLGA-3 12 was determined by DNA sequence analysis.
DNA and RNA analysis: Yeast genomic DNA was pre- pared as described (BOEKE et al. 1985). For Southern blot analysis, DNA was digested with restriction enzymes, frac- tionated by electrophoresis in 1% agarose gels and trans- ferred to nitrocellulose. Hybridization conditions were as previously described (CLARK et al. 1988). DNA size markers were HzndIII-digested lambda DNA fragments which were 5”end-labeled with [y-32P]ATP in a reaction with T 4 poly- nucleotide kinase. Total cellular RNA from yeast was iso- lated according to the method of ELDER, LOH and DAVIS (1983). For Northern analysis, RNA was glyoxylated (MCMASTER and CARMICHAEL 1977), fractionated by elec-
trophoresis in 1.1 % agarose gels and transferred to nitro- cellulose (THOMAS 1980). Hybridization was as described (CLARK et al. 1988). Relative levels of transcripts were determined by scanning densitometry in cases where inten- sities were in a linear range. RNA size markers were made by labeling an RNA size ladder urchased from Bethesda Research Laboratories with [5’-‘P]cytidine 3’,5’-bisphos- phate using T 4 RNA ligase (PIRTLE et al. 1980). Probes for Southern and Northern analysis were grepared by labeling gel-purified DNA fragments with [a- PIATP by the ran- dom-primer method (FEINBERG and VOGELSTEIN 1983, 1984). The probes were: u (LTR), 339-bp XhoI-TaqI frag- ment from pSBS6; Ty3, 1.6-kbp Accl or 2.9-kbp BglII fragment from pTy3-1; and URA3, 1.1-kbp Hind111 frag- ment from YIP5.
a-Factor and a-factor treatment: Yeast cultures were routinely grown to densities of ODs00 E 0.5 and treated
with 3.5 PM a-factor (Sigma Chemical Co.) for 20 min. For the a-factor time course experiment, cultures were treated with 3.5 PM a-factor for 0, 5, 10, 15, 30, 60, 120 and 180 min. Conditioned YPD (medium containing a-factor) was prepared for the a-factor experiments by growing RC634 cells to OD600 E 1.1 and removing of the cells by filtration
through a 0.2-rm pore membrane. For a-factor treatment of VBl29 (MATa), cultures were grown in YPD medium to ODGoo g 0.4-0.5. Cells were pelleted, resuspended in fresh,
Control of Ty3 Expression 689 MATaZ disruption: In order to test for mating-type reg-
ulation, MATal in VBl 1 1 a/a cells was replaced by a non- functional matal allele, matax50, which contains an XhoI
linker insertion, from plasmid 196 (TATCHELL et al. 198 1). VBl l1 was cotransformed with the 4.2-kbp Hind111 frag-
ment from plasmid 196 and a YCp50 derivative containing URA3. Transformants were selected on uracil-minus me- dium and screened for their ability to mate to an a tester strain, J12-8C. The disruption was confirmed by Southern blot analysis of genomic D N A using a MATal probe from plasmid 196 (data not shown). The strain containing the disrupted MATal allele is VBll7.
&Galactosidase assays: Assays were carried o u t on newly transformed VBllO (MATa), VB114 (MATa), VB115 (MATa/a) and V Bll 7 (MATa-Ict). Cells were grown over- night in selective medium, diluted to fresh selective medium and grown to log phase (OD600 s 0.45-0.6). In the a-factor experiment, cultures were treated with 3.5 PM a-factor for 60 min prior to assay. In the a-factor experiment, the a- factor was administered in the form of conditioned medium containing a-factor described above. Yeast transformants were grown overnight in selective medium, diluted into fresh selective medium, and grown to log phase (OD600 S
0.45-0.6). Cultures were diluted into prewarmed YPD to OD600 I 0.2 and allowed to grow to OD600 0.4. Cells were pelleted by centrifugation, resuspended at the same density
in prewarmed a-factor-conditioned YPD medium and grown for 60 min prior to assay. &Galactosidase assays were performed using o-nitrophenyl-8-galactopyranoside
(ONPG) as the substrate (ROSE, CASADABAN and BOTSTEIN
1981). Assays were carried out in triplicate on two to four transformants and the results were averaged. The range of
values was within 30% of the average. RESULTS
Effect of pheromones on Ty3 RNA levels corre- lated with cell cycle arrest: Initial studies (VAN ARS- DELL, STETLER a nd THORNER 1987; CLARK et al.
1988) showed that the levels of T y 3 transcripts and some sigma transcripts were increased in a cells by a-
factor treatment. Pheromones also mediate a block a t GI in the cell cycle (MARSH, NEINMAN a n d HERSKOW- ITZ 1991). We first determined the time course of
Ty3 induction by a-factor and compared it to the time course of GI cell cycle arrest. In order to achieve the greatest possible sensitivity, this was carried out in a strain with a defect in the gene encoding the protease which degrades a-factor ( b u r l ) , as well as in a strain with the wild-type allele (BARI). Logarithmically growing a cells (VB109) were treated with 3.5 PM a-
factor and total RNA was prepared at times from 0 to 180 min. T h e results of Northern analysis using a Ty3 probe are shown in Figure 1. T h e intensity of the band representing hybridization to the 5.2-kb T y 3 RNA was quantitated using a scanning densitometer on an autoradiogram exposed in the linear range, and the values were normalized t o t h e intensity of the band of URA3-hybridizing RNA on the same blot. T h e relative intensity at different experimental time points is shown in the graph in Figure 2A. T h e level of the 5.2-kb RNA in VB109 cells increased markedly, by 5 min and continued to increase rapidly up to 1 5
A 1 2 3 4 5 6 7 8 9 1 0 1 1 1 2
B
kb
7.5-
4A-
2*-
lA
-42"
0"-
-
0 --
1 2 3 4 5 6 7 8 9 1 0 1 1 1 2 75-
4rb
2k
1 A-
42.
D am... r l
.-
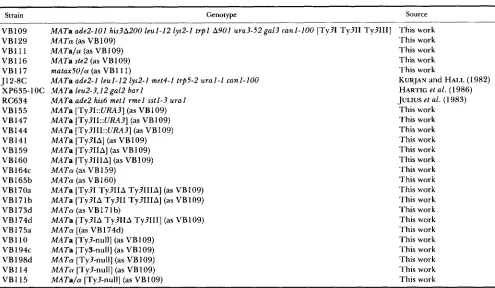
, -I.rFIGURE 1 .-Ty3 RNA levels following a-factor treatment. Total RNA (20 &lane) from untreated or a-factor-treated cultures was subjected to Northern analysis with a radiolabeled Ty3 probe (A) or with a radiolabeled URA3 probe (B). Lanes 1-4, RNA from control cultures isolated at 0, 60, 120 and 180 min; lanes 5-12, RNA from a-factor treated cultures isolated at 0, 5, 10, 1 5 . 3 0 . 6 0 , 120 and 180 min after a-factor addition. (A) VB109 ( B A R I ) RNA hybridized to the Ty3 probe. (B) Hybridization of the samples used in A to the URA3 probe. ( C ) XP635-1Oc ( b u r l ) RNA hybridized to the T y 3 probe. (D) Hybridbation of the samples used in C to the
URA3 probe. Sizes of RNAs were extrapolated from RNA markers end-labeled with "P and shown in the left lane.
min after a-factor treatment was initiated (Figure 1 A, lane 6; Figure 2A). After 15 min, the level of the 5.2- kb Ty3 transcript increased more slowly and reached a maximum of 15-fold that in the untreated cells a t 60 min. T h e level declined after this point. No signif- icant changes occurred in t he level of the 5.2-kb RNA in untreated cultures over the time course (Figure
I A , lanes 1-4; Figure 2A).
T h e a-factor is known to be degraded in cultures of a cells by the BARI-encoded protease (HICKS and HERSKOWITZ 1976; MACKAY et al. 1988). To deter- mine the kinetics of induction in the absence of a-
A probe: Ty3
"-
I
I
W
+
d
h
i W
a:
B
kb 7.5
-
4.4
-
2.4
-
1.4
-
a
a
a+af0 180
0.2
-
0
probe: URA3
-
FIGURE 3.-Ty3 R N A levels following a-factor treatment. Total R N A (20 pgllane) from untreated or a-factor treated cultures was subjected to Northern analysis with a radiolabeled Ty3 (top) or with a radiolabeled LIRA3 probe (bottom). R N A was isolated from un- treated VB109 (MATa) and VB129 (MATa) cultures and a-factor- treated VB129 cultures. VB109 and VB129 are isogenic except for different MAT alleles. End-labeled R N A size markers are shown in the left lane.
-"I..... , . . . , . . . . . , .
0 30 6 0 1 2 0 9 0 150 180
MINUTES
FIGURE 2.-Comparison of changes in levels of the 5.2-kb Ty3 R N A and percentage of GI-arrested cells over a time course follow- ing a-factor treatment. The strains were VB109 (BARI), untreated (open circles) or a-factor-treated (solid circles); and XP635-1Oc
( b a r l ) , untreated (open triangles) or a-factor treated (solid trian- gles). (A) Levels of the 5.2-kb Ty3 R N A from BARI- and barl-
containing strains quantitated from Northern analysis by scanning densitometry and normalized to LIRA3 R N A levels for O-180-min time points. The autoradiographs scanned were lighter exposures than the ones shown in Figure 1, and were within a linear range.
(B) Percentage unbudded cells for BARI- and barl-containing strains from cultures analyzed in A.
in this strain, however, continued to increase to ap- proximately 40-fold basal levels by 60 min. In contrast to the results with the BAR1-containing strain, the relative intensity was still approximately 30-fold basal levels at 180 min after a-factor addition. These results indicated that the decline in Ty3 transcription in BAR1-containing cells can be explained by degrada- tion of a-factor during the experiment.
T h e different response of BARl- and barl-contain- ing strains to a-factor over the time course was also measured by monitoring cell-cycle arrest in GI. Deter- mination of the percentage of cells arrested in GI (percentage unbudded) during the a-factor treatment
time course was carried out in parallel with the RNA experiments. In contrast with the RNA results, no change in the percentage of unbudded cells was de- tected for approximately 30 min after initiation of a- factor treatment. T h e percentage of unbudded BARl- containing cells rose from 50% at 0-30 min to about 70% at 60 min after a-factor treatment, which corre- lated with maximum Ty3 RNA levels (Figure 2). The eventual decrease in the percentage of unbudded cells parallels the decrease in 5.2-kb Ty3 RNA. This is consistent with degradation of a-factor in the culture medium and recovery of cells from GI arrest. The percentage of unbudded cells in the barl-containing strain increased initially in a similar manner to the BARl-containing strain, but continued to increase to 98% at 180 min. This result is expected if the concen- trations of a-factor are constant in the culture of the barl-containing strain. T h e results showed that the effect of a-factor on Ty3 RNA levels was rapid and was consistent with a continuous requirement for a- factor to maintain elevated expression of Ty3.
T o determine if Ty3 expression is regulated by a- factor as it is by a-factor, the effect of a-factor on Ty3
Control of Ty3 Expression 69 1
A 6
1 2 3 4 5 6 7 8 9 1 0 1 1 1 2 1 2 3 23.1
-
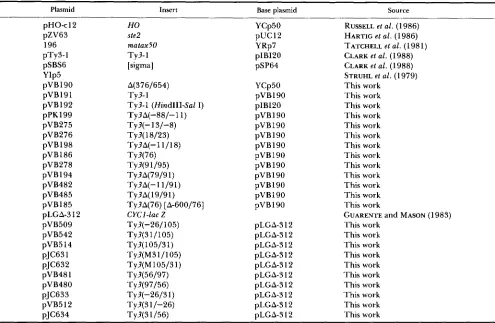
FIGURE 4.-Effect o f MATal disruption o n T y 3 R N A levels. Northern analysis o f total RNA (20 pgllane) from a / a , a - / a , and a cell cultures using T y 3 and URA3 radiolabeled probes. (A) RNA hybridized to the T y 3 probe is from: lane 1 , VB111 (MATala); lane
2, VBI 17 (MATa-/a); and lane 3. VB109 (MATa). (B) RNA in blot from panel A hybridized to a URA3 probe.
RNA was elevated in a-factor-treated a cells (Figure
Effect of MATal disruption on Ty3 RNA levels: T h e level of some a-hybridizing and Ty3-hybridizing RNAs was decreased in a/a diploid cells in comparison to haploid levels (CLARK et al. 1988). T h e combined activities of the regulatory proteins a1 and a2, are responsible for repression of transcription in a / a dip- loids, and mutation of either the MATal or the MATa2 locus results in loss of mating-type control. T o determine whether Ty3 transcripts are regulated by mating type, the effect of matal disruption on transcription of Ty3 in diploid cells (a-/a) was inves- tigated by Northern blot analysis (Figure 4). In RNA from a cells, the Ty3 probe detected major transcripts of 5.2 and 3.1 kb. Only the 5.2-kb transcript level was decreased in RNA from a/a cells. T h e levels of the 5.2 and 3.1 kb transcripts in RNA from a-/a cells were indistinguishable from Ty3 hybridizing tran- scripts in a cells, as expected if the 5.2-kb Ty3 RNA is under mating-type control.
Analysis of strains containing zero to three Ty3 elements: An isogenic set of strains containing three, two, one and zero T y 3 elements was constructed to investigate transcription of individual Ty3 elements, and to determine whether expression of Ty3 was regulated by copy number. Southern blot analysis of EcoRI-digested VB109 DNA with a Ty3 probe showed that VB109 contained three Ty3 elements. These were designated Ty31, Ty3II and T y 3 I I I and corresponded to fragment sizes of 9.4, 7.4 and 6.5 3).
9.4
-
0 . 6 -
4.4-
2.3.
2.0.
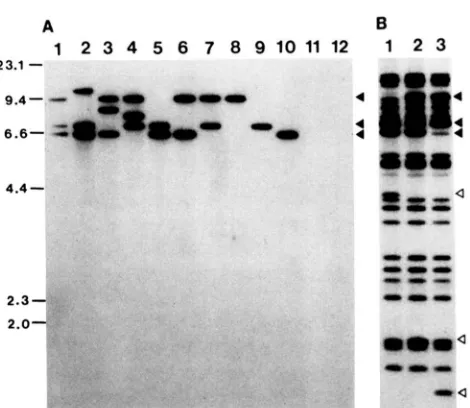
FIGURE 5.-Ty3-null strain construction. Southern analysis o f EcoRI-digested genomic DNA from isogenic yeast strains used in derivation o f Ty3-null strains. DNA was hybridized with radiola- beled T y 3 ( A ) and u (B) probes. (A) DNA is from: lane 1 , VB109 (parental strain); lane 2, VB155; lane 3, VB147; lane 4, VB144; lane 5, VB141; lane 6. VB159; lane 7, VB160; lane 8, VBI70a; lane 9, VB17lb; lane 10, VBI74d; lane 1 1 , VBIIO; lane 12,
V B l 9 4 c . (B) DNA is from: lane 1 , VB141; lane 2, VB159; lane 3, VB160. Solid arrowheads indicate positions of T y 3 elements I , I1 and I l l . Open arrowheads indicate positions of new u-hybridizing EcoRI fragments resulting from deletion o f T y 3 internal regions.
kbp, respectively (Figure 5A, lane 1). Integrative transformation with a Ty3 fragment containing URA3 resulted in three strains which each had a URA3 insertion in a different Ty3 element as demonstrated by an increase in size of the Ty3-containing fragment (Figure 5A, lanes 2-4) and by hybridization of the fragment to a URA3 probe (data not shown). Cells in which the internal domains of Ty3::URA3 elements were deleted were selected by growth of cells on 5- FOA-containing medium. Deletion of the internal domain was presumed to occur through recombiria- tion between the LTRs consistent with the appearance of new a-hybridizing fragments in Southern blots (Figure 5B, lanes 1-3). Strains containing a single Ty3 element (Figure 5A, lanes 8-10) were isolated from among the progeny of Ty3-deletion strains. Single element strains were mated to derive the Ty3-null strains, which contained no Ty3-hybridizing se- quences (Figure 5A, lanes 11-12). N o obvious differ- ences in growth rate, based on the size of colonies from germinating spores, were observed among strains containing different numbers of Ty3 elements and Ty3-null strains.
A
1 2 3 4 - 5 6 7 8 9 1 0 1 1 1 2
7.5-
4.4-
2.4-
1.4-
0.2-
B
FIGURE 6.-Analysis of Ty3 transcripts in strains containing T y 3 elements I , 11 or 111, and Ty3-null strains. Northern analysis of total RNA (20 pgllane) using radiolabeled T y 3 and LIRA3 probes. (A) RNA is from: lane 1 , VB109, untreated; lane 2, VB109, a- factor treated; lane 3, VBI 70a, untreated; lane 4, VBI 70a, a-factor treated; lane 5, VB17lb. untreated; lane 6, VB17lb, a-factor treated; lane 7. VBI74d. untreated; lane 8, VBI74d, a-factor treated; lane 9. VB110, untreated; lane 10, VBllO, a-factor treated; lane 1 1 , VBI94c, untreated; lane 12, VB194c. a-factor treated. End-labeled RNA size markers are shown in the left lane. (B) RNA in the same blot as A was hybridized with a LIRA3 probe.
performed on RNA prepared from a-factor-treated and untreated cultures of single-element strains. Ty3 RNAs of 5.2, 3.1 and 1.8 kb were detected in the starting strain, VB109 (Figure 6, lane 1). T h e same RNAs were detected in each of the strains containing only one Ty3 element (Figure 6, lanes 3, 5 and 7). Treatment with a-factor increased levels of the 5.2- kb RNA in the starting strain, as well as in the single- Ty3-element strains. T h e level of RNA in the single- element strains was reduced compared with that of the original (Figure 6, lanes 2, 4, 6 and 8). As ex- pected, no Ty3-hybridizing RNAs were detected in total RNA prepared from untreated or a-factor- treated Ty3-null strain cultures (Figure 6, lanes 9-
12). T h e results showed that each Ty3 element origi- nally present in starting strain VB109 was expressed, and was inducible by a-factor. Thus, neither position nor copy number appeared to affect expression of these Ty3 elements.
Effect of tRNACya on the transcription of Ty3-1: In the genome, Ty3 elements are located 16-19 bp upstream of the coding sequence of mature tRNAs and therefore overlap the region occupied by TFIIIB when bound to the tRNA gene (KASSAVETIS et al.
1989). T h e proximity of these RNA polymerase I11 and RNA polymerase I1 promoters suggested that interactions between transcription factors or regula- tory proteins might occur. KINSEY and SANDMEYER (199 1) showed that a u element or a Ty3 element inserted upstream of the tRNATyr gene,
SUP2,
re- sulted in a modest increase in expression of the gene. Transcription from a u element (LTR) was also af- fected by the adjacent tRNA gene. In the case where transcription from u and the tRNA was in the samecell type:
kb
7.5
-
4.4
-
2.4
-
1.4 -
0.2
-
plasmid
uRA3 genomic
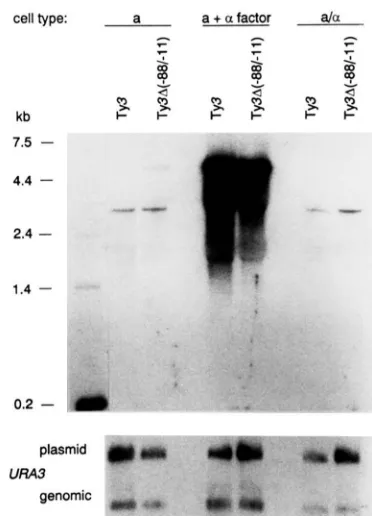
FIGURE 7.-Effect of deletion of tRNA"" adjacent to Ty3-1 on Ty3 expression. Northern analysis of total RNA from a (VBI lo), a-factor-treated a cells and a/a (VBl15) cells containing either plasmid pVB192 (Ty3-1) or pPK199 (Ty3A-88/-11). RNA was hybridized with a radiolabeled T y 3 probe. The same blot was hybridized with a LIRA3 probe. End-labeled RNA size markers are shown on the left.
orientation, expression of the tRNA gene interfered with expression from the u promoter. T h e effect of the tRNA gene in the divergent, more common, orientation on Ty3 expression was not previously tested.
T o examine the effect of the divergent tRNACy' gene on Ty3-1 expression, the Ty3-null strains (VBI 10, MATa) and (VBll5, MATala) were trans- formed with plasmid pVB 19 1, containing the diver- gent Ty3-1 element and tRNACys gene. RNA was prepared from untreated and a-factor treated cultures of transformed cells and subjected to Northern blot analysis (Figure
7).
T h e Ty3 probe detected RNAs of 5.2 and 3.1 kb in a cells. T h e regulation of plasmid- borne Ty3 was the same as that observed with ge- nomic Ty3 elements. No changes were detected in regulation of the 5.2-kb Ty3 RNA as the result of deletion of the tRNACY'. A point mutation in the box B promoter element of the tRNA gene, which renders the gene transcriptionally inactive, did not have a significant effect on the level of Ty3 transcripts in untreated a cells (data not shown).Control of Ty3 Expression 693
-b
-88 - 2 6
GG
T
CAAAAGCTCGC ACTCAGGATC GAACTAAGGA CCAACAGATT TGCAATCTGC TGCGCTACCA CTGCGCCATA
-11 1
CGG A C
CGAGCTTGAT TTTCTGAAAG
t
56 76
t
-
b
19 3 1
PI an
TGACAATACG
t
9 11 0 5
TCACCCTGAA
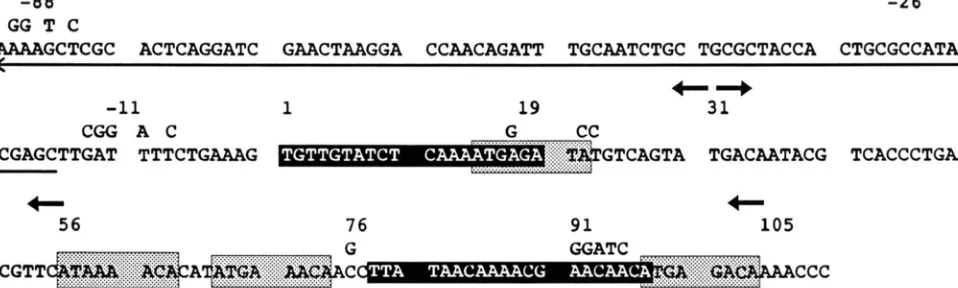
FIGURE 8.-DNA sequence of the first 110 bp of the Ty3-1 LTR and including the tRNA"" located upstream of Ty3-1. The first base pair of the T y 3 LTR is designated position 1. The direction of Ty3 transcription is left to right. The mature tRNACp coding sequence is indicated by an arrow below the sequence, showing direction of transcription. Letters above the sequence show specific changes made by oligonucleotide-directed mutagenesis. The numbers above the nucleotide changes indicate the positions of restriction endonuclease cut sites. Numbers accompanied by arrows indicate the positions of the 5' termini and orientation of oligonucleotides used to prepare Ty3 fragments by PCR for cloning into plasmid pLGA-312. The black boxes denote sequences that have similarity to the a l a 2 consensus sequence of MILLER, MACKAY and NASMYTH ( 1 985). Gray boxes indicate sequences that are identical to, or have similarity to PRE sequences (KRONSTAD. HOLLY and MACKAY 1987; VAN ARSDELL and THORNER 1987):
STAD, HOLLY and MACKAY 1987; VAN ARSDELL and THORNER 1987). Four sequence blocks with similarity to the PRE occur in the first 100 bp of Ty3, beginning at 15, 56, 67 and 97 bp (Figure 8). These sequences were previously noted (VAN ARSDELL and THORNER
1987). T h e T y 3 sequence was analyzed for sequences with similarity to the a l a 2 mating-type control con- sensus of MILLER, MACKAY and NASMYTH (1985). Two regions which have 80%, and 70% similarity to the Miller consensus sequence are located between bp 1 and 20 and between bp 78 and 97, respectively (Figure 8). In the course of DNA sequence analysis we determined that the Ty3 LTR also contains one near-perfect match to the heat shock element consen- sus sequence, CNNGAANNTTCNNG, at position 45-58 (PELHAM and BIENZ 1982). Heat shock ele- ments are located in the promoters of genes whose transcription is activated by exposure to high temper- ature. Analysis of RNA from cultures that were grown at 23" and shifted to 39 for 30 min showed that levels of Ty3 RNAs were greatly reduced following heat shock treatment (our unpublished results).
Effects of mutations and deletions within the Ty3
LTR
on a-factor and mating-type regulation of Ty3: In order to identify those DNA sequences actively involved in regulation of Ty3 transcription, a set of YCp50-based plasmids was made which contained site- directed mutations and restriction fragment deletions in the Ty3 promoter. T h e plasmids were transformed into a and a/a Ty3-null strains for analysis. T h e level of the 5.2-kb Ty3 RNA from untreated, and a-factor- treated, cultures was determined by Northern blot analysis with a Ty3 probe and a compilation of the results is presented in Figure 9A. Ty3 sequences de-leted or altered in these constructs are shown in Figure 8.
T h e level of T y 3 RNA in untreated a cells trans- formed with mutant elements Ty3A(-11/18), Ty3A(-11/9 1) and T y 3 A ( 19/91) was elevated com- pared to the level in cells transformed with the Ty3- 1 control plasmid (Figure 9A). T h e simplest interpre- tation is that sequences in the regions -1 1/18 and
19/9 1 negatively affect basal transcription levels. The apparent modest increase in Ty3 RNA levels in a cells containing Ty3(91/95) is eliminated when samples are adjusted for loading (Figure 9A, lower panel).
T h e level of Ty3 5.2-kb RNA in a cell cultures treated with a-factor was compared with the level in untreated cultures. T h e results show that most muta- tions or deletions had no effect on the increase in Ty3 RNA following a-factor treatment. In plasmid Ty3A(-11/91), however, the level of Ty3 RNA was the same as in untreated cultures. These results indi- cated that sequences within the region -1 1/91 were responsible for a-factor induction of Ty3. The regu- lation of Ty3A(-l1/9 1) was restored by the inclusion of sequences -1 1/18 in plasmid T y 3 A ( 19/91). The single C to G change in Ty3(76) also completely eliminated the effect of a-factor on Ty3 RNA levels (Figure 9A).
A
n I
-L l l r a
probe: URA3
P a
F
a
a J
9
P
9
P
B
cell type:
"-
a a+ai ala(D
b (D r-
a a
(0 r- a kb
E F p F p 2
F cell type:"-
a a+ai alakb
4.4
-
2.4
-
1.4
-
plasmid
URA3
d
genomic0.2
-
-
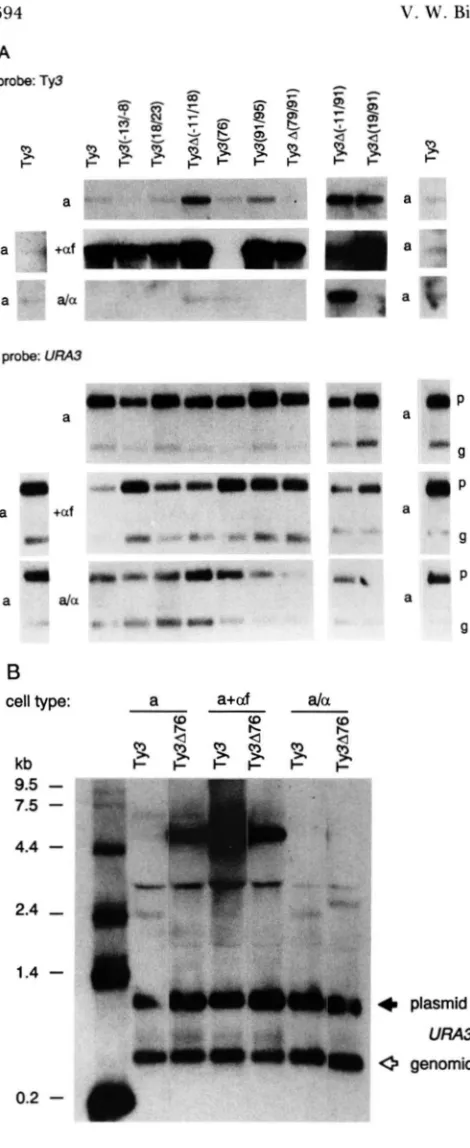
FIGURE 9.-Effect of point mutations and deletions on Ty3 R N A levels in a, a-factor-treated a cells and a l a cells. Northern analysis of total RNA (20 pgllanc) was done using a radiolabeled Ty3 probe. RNA was from untreated and a-factor-treated a cells (VBI lo), and
ala (VBll5) cells that were transformed with Ty3-containing plas- mids as indicated. The same blots were hybridized with a LIRA3 probe as a control. The probe detected R N A derived from the plasmid (p) and a smaller R N A from the genomic ura3-52 locus (g).
(A) To facilitate comparison of the samples, only the portion of the blot containing hybridization to the 5.2-bTy3 RNA or LIRA3 RNAs
ing-type control, but the mutation, Ty3(76), which is located within this region appeared to relieve repres- sion. In cells containing plasmid Ty3(-11/18), Tv3 RNA was also detected, but the level was lower than in a cells. I t can not be determined from this analysis whether the level of transcription in the Ty3(- 1 1 /18) construct is a partial relief of mating-type repression, or the result of a general increase in transcription.
Northern analysis showed that sequence required for a-factor induction and mating-type control was contained in the region -1 1/9 1 (Figure SA). The DNA sequence analysis predicts that deletion of the sequences upstream of bp 76, which contains three of the four PRE sequences and is within the defined region -1 1/91, would result in loss of a-factor induc- ibility, but not mating-type control. To test this pre- diction, plasmid pVB185 (Ty3A76) was constructed. This plasmid is deleted for all sequences 5' to bp 76, including the tRNA gene. T h e plasmid was intro- duced into a (VBl 10) and a/a (VBl15) cells. RNA from untreated and a-factor-treated cultures was ana- lyzed on Northern blots (Figure 9B). In a cells, the level of Ty3 RNA detected by the Ty3 probe from Ty3A76-containing cells was elevated. T h e level of T y 3 RNA from a-factor-treated cultures was similar to that of the untreated cultures. Therefore, the se- quence required for a-factor response was located within the -1 1/76-bp region. In a/a cells, the level of Ty3 RNA was less than in a cell cultures (Figure 9B). Taken together with previous results (Figure 9A), these data indicated that a mating-type control region occurs within 76/9 1.
Ty3 LTR fragments confer regulation on a re- porter gene: Deletion analysis indicated that at least two blocks of sequence were involved in a-factor induction, implicated two blocks of sequence in mat- ing-type control, and demonstrated a negative control element in the region -1 1/18. T o identify regions sufficient for these effects, and to determine whether the same regions mediated both a-factor and a-factor induction of Ty3 expression, a series of plasmids was constructed which contained portions of Ty3 se- quences cloned into the promoter region of the lac2
reporter gene plasmid pLGA-312 (MATERIALS AND METHODS). Each plasmid was transformed into a (VBl lo), a (VBll4) a/a (VBll5) and a-/a (VBll7) cells. T h e &galactosidase activity was measured in cellular extracts from pheromone-treated and un-
Control of Ty3 Expression 695
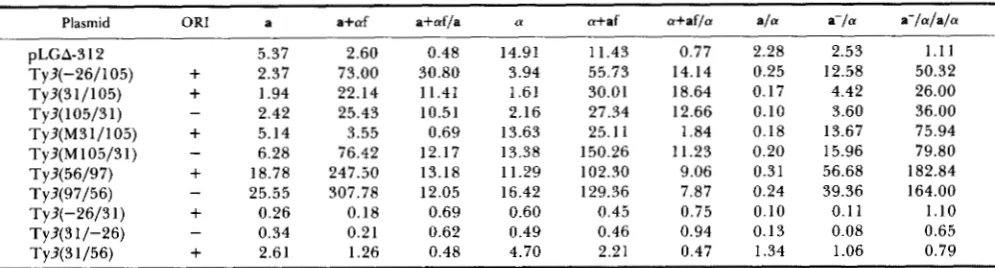
TABLE 3
Ty3 LTR fragments confer regulation on a reporter gene
Plasmid OR1 a a+af a+af/a a a+af a+afla a l a a-/a a-/a/a/a
PLGA-3 12 5.37 2.60 0.48 14.91 1 1.43 0.77 2.28 2.53 1 . 1 1
Ty3(-26/105)
+
2.37 73.00 30.80 3.94 55.73 14.14 0.25 12.58 50.32Ty3(31/105)
+
1.94 22.14 11.41 1.61 30.01 18.64 0.17 4.42 26.00Ty3( 105/3 1 ) - 2.42 25.43 10.51 2.16 27.34 12.66 0.10 3.60 36.00
Ty3(M31/105)
+
5.14 3.55 0.69 13.63 25.11 1.84 0.18 13.67 75.94Ty3(M 105/3 1)
-
6.28 76.42 12.17 13.38 150.26 11.23 0.20 15.96 79.80Ty3(56/97)
+
18.78 247.50 13.18 11.29 102.30 9.06 0.31 56.68 182.84Ty3(97/56)
-
25.55 307.78 12.05 16.42 129.36 7.87 0.24 39.36 164.00Ty3(-26/31)
+
0.26 0.18 0.69 0.60 0.45 0.75 0.10 0.11 1.10Ty3(31/-26) - 0.34 0.21 0.62 0.49 0.46 0.94 0.13 0.08 0.65
Ty3(31/56)
+
2.61 1.26 0.48 4.70 2.21 0.47 1.34 1.06 0 .79Strains were transformed with the indicated plasmid and grown as described in MATERIALS AND METHODS. @-Galactosidase activities were determined in permeabilized cells and are reported in Miller units. Values are the means of triplicate determinations performed on two to
four transformants.
treated haploid cell cultures and diploid cell cultures. T h e results are presented in Table 3.
T h e results from untreated a and a cells (Table 3) showed that T y ? fragments -26/105, 31/105 and 3 1 /56 had no effect on promoter activity. T h e intro- duction of a mutation at position 76 in the LTR sequence, Ty?(M31/105) resulted in increased expression in both a and a cells compared to the wild- type fragment. T h e effect was orientation insensitive. T y ? fragment -26/3 1 caused a 15-20-fold reduction in @-galactosidase activity when inserted in either ori- entation. T h e T y ? sequence 56/97 enhanced @-galac- tosidase activity approximately five fold in either ori- entation in the pLGA-312 plasmid, and also in the reporter plasmid, SX 178, which lacks all CYCl UAS sequences (data not shown). This analysis demon- strated that the sequence -26/31 was sufficient to repress the activity of a heterologous promoter and that the sequence 56/97 contained UAS activity.
T h e ability of T y ? LTR fragments to confer pher- omone inducibility on the reporter gene was deter- mined by comparison of @-galactosidase activity in treated and untreated cells. T h e results in a cells treated with a-factor (Table 3) showed that a-factor had no effect on @-galactosidase expression from pLGA-3 12 alone. T h e set of T y ? sequences -26/105, 3 1/105 and 56/97 each caused a 10-30-fold induction of @-galactosidase activity when inserted in either ori- entation in the test plasmid. These regions contained PRE sequences (Figure 8). T h e C-G mutation at bp 76 in the complete Ty? eliminated a-factor induction (Figure 9A). When this mutation was included in the 31/105 Ty3 sequence (M31/105), it eliminated in- ducibility in the natural (+) but not in the opposite orientation. T y ? sequences -26/3 1, 3 1/-26 and 3 1/ 56 had no effect on @-galactosidase activity in a-factor- treated cultures when inserted into the promoter, although induction by -26/105 was more than that
of 31/105. The effect of T y ? fragments on @-galac- tosidase activity in a-factor-treated cultures of a cells was similar to those in a-factor-treated cultures.
T h e ability of Ty3 LTR fragments to confer mat- ing-type control was tested by comparing the @-galac- tosidase activity in a / a cells and a-/a cells. The @-
galactosidase activity in a-/a cells was greater than the activity in a / a cells for all plasmids containing the region 56/97. This effect was independent of frag- ment orientation. The 56/97 region, therefore, con- tains sequences that confer mating-type control. The base-pair change in the Ty?(M31/105) construct had no effect on mating-type control regulation. In keep- ing with the results in haploid cells, the activity of the construct was higher in a-/a cells than Ty?(31/105) sequences. T h e activity from plasmids containing Ty3 sequences -26/31 and 31/56 was insensitive to a/a control. This showed that these regions were not able to confer mating-type control.
T h e fragment -26/3 1 caused a reduction (1 6-32- fold) in @-galactosidase activity in all cell types when inserted in either orientation in the test plasmid. Thus, this negative effect was not cell type-specific. T h e 3 1/56 region, which was also negatively acting in all cell types, had a more modest effect.
DISCUSSION
696 V. W. Bilanchone al. upstream copy, ATAAAACA, is a
7
of 8-bp match.T h e same fragment mediated responsiveness to both a- and a-factor. This has also been observed for other genes, such as FUSI, expressed in both haploid cell types (MCCAFFREY et al. 1987; TRUEHEART, BOEKE and FINK 1987; HAGEN, MCCAFFREY and SPRACUE
1991). T h e Ty3 fragment did not contain any PQ sequences which were reported to mediate a-factor responsiveness of STE3 in a cells (SENGUPTA and COCHRAN 1990). Our results indicated that for Ty3, PREs were responsible for pheromone induction in both haploid cell types. T h e other two PRE-like se- quences in the LTR were not able to function inde- pendently as PRE elements. T h e fragment -26/3 1, which contained a 6 of 8-bp match to the consensus, beginning at position 15, did not confer inducibility to the reporter gene in either orientation. This result could reflect the weak activity of single PRE elements (HAGEN, MCCAFFREY and SPRAGUE 199 1 ; SENGUPTA and COCHRAN 1990), but could also reflect masking of activity by negatively acting sequences on the same fragment. T h e PRE-like sequence ATGAGACA downstream of the a l e 2 box at position 9’7 did not mediate induction of the Ty3A(76) deletion mutant. T y 3 contains multiple UAS regions: T h e fragment 56/97, which contained the PREs, exhibited UAS activity. Inclusion of this fragment in the promoter region of the reporter gene conferred inducibility in both haploid cell types. This fragment also acted as a UAS in a reporter plasmid containing no other UAS sequences (data not shown). In FUSI, the PRE pro- vided the only UAS activity found in the promoter (HAGEN, MCCAFFREY and SPRAGUE 1991). However, two lines of evidence indicated that Ty3 contained pheromone-independent UAS activity. Deletion of sequences between positions
-
1 1 and 9 1 of the LTR, which eliminated pheromone responsiveness, did not eliminate transcription. In addition, disruption of the a-factor receptor, STE2, in a cells did not affect basal levels of Ty3 RNA (our unpublished results).Regulation of Ty3 expression by mating type: T h e Northern analysis of deletion mutants implicated two blocks of sequence -1 1/18 and 74/91 in mating-type control. In the reporter gene assay, only region 56/ 97 independently caused repression of reporter gene activity in a/a cells. T h e sequence TTATAA- CAAAACGAACAACA, 78/97, which has 70% simi- larity to the a l - a 2 consensus sequence (MILLER, MACKAY and NASMYTH 1985; SILICIANO and TATCH- ELL 1986) occurs within this fragment. This repression was probably not the result of an indirect effect due
to a reduction in STEIZencoded protein levels, be- cause S T E l P expression is reduced 5-1 O-fold in dip- loids and reporter gene expression was 162-182-fold lower in a/a diploids than in a-/a diploids. In addi- tion, fragments mediating pheromone induction
could be separated from sequences which conferred mating type regulation. T h e mutation at position 76, which is adjacent to the PRE sequences and blocked PRE activity in the natural orientation, did not affect mating-type control in either orientation, and the deletion up to position 76, which eliminated three of the four PREs and inducibility, did not affect mating- type control.
Negative and positive regulatory regions are clus- tered: PRE sequences are clustered with other control elements in the upstream regions of some pheromone responsive genes. For example, in the STE2 and BAR1 genes, PREs are located adjacent to P boxes which enhance transcription (ERREDE and AMMERER 1989; HWANG-SHUM et al 1991; KELEHER, PASSMORE and JOHNSON 1989). In Ty3, the PRE sequences are adja- cent to the a l a 2 sequence. This may reflect a general pattern since in the haploid-specific gene, FUS3, PRE- like sequences also flank a potential a l a 2 sequence. Two observations from our work suggest that the association of these control elements is important and that interactions occur between proteins complexed at these adjacent control elements. First, a mutation at bp 76 in the region separating an upstream PRE and the a l a 2 box blocked pheromone responsive- ness. Second, deletion analysis showed that joining the Ty3 regions upstream of position 18 to the regions downstream of position 91 produced a construct that was pheromone responsive and mating-type re- pressed. It is possible that the joining of these se- quences created a new control region by juxtaposing an al-a2-like sequence in
-
1 1/18 with a PRE-like sequence, ATGAGACA at position 97. This junction also created a tandem repeat of two PRE-like se- quences, in which a 5 of 8-bp match to the PRE consensus sequence from the upstream region is di- rectly adjacent to the PRE-like sequence from the downstream region. These two PRE-like sequences may function in pheromone induction in this con- struct. An alternative explanation for these results is suggested by the results of F U S l promoter analysis (HAGEN, MCCAFFREY and SPRAGUE 1991). A region was identified which did not confer pheromone re- sponsiveness, but was capable of affecting the magni- tude of the response from an adjacent control ele- ment. T h e T y 3 region-
1 1/18 could function simi- larly to modulate expression, although sequencecomparison of the Ty3 and F U S l regions did not reveal obvious similarities.
Control of Ty3 Expression 697
Ty3 regulatory elements, and it also functioned down- stream of a UAS in the reporter plasmid context. These properties indicated that the Ty3 region -26/ 31, contained URS activity. T h e existence of a nega- tive regulatory element near the upstream junction of LTR and flanking chromosomal sequences is not un- precedented. For example, in human immunodefi- ciency virus a negative control region is located near the 5'-end of the LTR and in murine leukemia virus, a regulatory element, in a similar location, binds a negative transcription factor (ROSEN, SODROSKI and HASELTINE 1985; FLANACAN et al. 1989, 1992). Se- quence comparisons of the T y 3 -26/31 region with LTR regions of T y l and Ty2 (A), and Ty4 (T) revealed
that both 6 and T contained a region which matched
the Ty3 sequence, TCAAAATGA, at
7
of 9 bp. T h e Ty3 sequence is located beginning at position 10 and the sequences in 6 and T were located in a similarposition, beginning at positions 9 and 18 with respect to the 5'-end of the LTR. Although deletions of bp positions 78-151 of the 5' 6 from T y l and Ty2 elements showed little effect on transcription (LIAO, CLARE and FARABAUCH 1987; FARABAUCH et al. 1989; FULTON et al. 1988), it is possible that these deletions had multiple effects, some of which masked the pres- ence of a URS.
The organization of Ty3 transcriptional control regions is different from Tyl and Ty2: Previous analysis of transcription in the yeast retrotransposons, Tyl and Ty2, showed that in contrast to the major regulatory regions of T y 3 , regions that promote T y l and Ty2 transcription are located downstream of the transcription start site and within the coding region (LIAO, CLARE and FARABAUCH 1987; FARABAUCH et
al. 1989; YU and ELDER 1989; FULTON et al. 1988). Solo 6 sequences had little or no ability to promote transcription (LIAO, CLARE and FARABAUCH 1987; FULTON et al. 1988). Ty9 17, a Ty2 element, contained an upstream region which increased transcription, but it only functioned in combination with downstream sequences (LIAO, CLARE and FARABAUCH 1987). Repression of T y l and Ty2 transcription in a/a cells is also mediated by sequences within the internal domain (ELDER et al. 198 1 ; ROEDER, ROSE and PEARL- MAN 1985; FULTON et
d .
1988).T y l and Ty2 do not show the level of pheromone responsiveness displayed by Ty3. In one genetic back- ground, pheromone treatment had no effect on the level of T y l transcripts, although the level of Ty3 transcripts increased dramatically (data not shown). In another genetic background, levels of transcripts from the CYC7 promoter under regulation of an ad- jacent T y l element increased by twofold upon pher-
omone treatment of cells ( C . ADLER and B. ERREDE, personal communication). Although STEl2-encoded protein interacts at a T y l control element within the
internal domain (COMPANY and ERREDE 1988;
ERREDE and AMMERER 1989), this isolated region mediated less than a twofold induction of a reporter fusion (M. BAUR and B. ERREDE, personal communi- cation). Ty2 transcription is not induced by phero- mone treatment (P. FARABAUCH, personal communi- cation).
Our analysis of T y 3 indicated that positive control elements for pheromone induction, negative control elements for mating-type control, and regions with UAS function were located upstream of the transcrip- tion start site in Ty3. In contrast to the LTR (6) of T y l and Ty2 then, the LTR of Ty3 ( u ) controls expression of the Ty3 genomic RNA and has organi- zation similar to other yeast promoters.
Effects of genomic context on Ty3 regulation: We constructed an isogenic set of strains differing in their complement of Ty3 elements. These strains allowed us to examine gene expression of different Ty3 ele- ments in various genomic contexts. Because Ty3 is most often inserted adjacent to tRNA genes in the divergent orientation (SANDMEYER et al. 1988), the effect of deletion of such a tRNA gene on T y 3 expres- sion was examined. Analysis showed that the presence of the tRNACys gene had no effect on regulation by a-factor or mating type. It is possible that the location of Ty3 elements next to tRNA genes shelters the regulatory elements in Ty3 from genomic context effects. Analysis of Ty3 expression in strains which vary only in their Ty3 complement showed only mod- est variation in the level of expression of any of the three elements examined, and the level of Ty3 tran- scripts under all conditions of expression showed no evidence of feedback regulation.