ISSN(Online): 2320-9801
ISSN (Print) : 2320-9798
International Journal of Innovative Research in Computer
and Communication Engineering
(An ISO 3297: 2007 Certified Organization)
Vol. 4, Issue 3, March 2016
Virtualization of Electrical Power Grid
-
An Approach on Load Balancing Scheme for
Different Feeders
Prof. D S Suresh, Sekar R, Rajendra C J, Rajeshwari T G
Professor, Dept. of ECE., Channabasaveshwara Institute of Technology, Gubbi, India
Associate Professor, Dept. of ECE., Channabasaveshwara Institute of Technology, Gubbi, India
Assistant Professor, Dept. of ECE., Channabasaveshwara Institute of Technology, Gubbi, India
P G student, Dept. of ECE., Channabasaveshwara Institute of Technology, Gubbi, India
ABSTRACT: Electrical Power system consists of three major divisions such as Generation, Transmission and Distribution. Among those the distribution involves critical issues because it is directly related with the end-users problems. The main objective of the power sector is providing quality power with the required quantity to the consumers.
In general, the individual Feeder lines are distributed from Power Grid- station based on the voltage and current rating with priority basis (i.e. Critical and Non-critical loads). Maintaining each feeder in Power Grid- station delivers power to the different kinds of consumers like one feeder may supply power to commercial loads and at the same instant others may supply power to industrial, domestic, irrigation, traction and municipal loads. The power demands of different consumers vary in accordance with their consumptions. The result of this variation in demand is that load on feeders in Power Grid- station is never constant; rather it varies from time to time. Due to this, at each instant of time some feeders may get overloaded and others may get under loaded.
This proposed work aims for developing and verifying Optimized Load balancing technique for enhancing overall performance of Power Grid- station at distribution side. The developed Optimized Load balancing algorithm was fully reliable to satisfy particular load demand at each instant. Further more, the effectiveness of proposed Optimised Load balancing technique for different Feeders is verified by experimental results. Its merits are indicated by comparing actual and modified readings of Feeders in Power Grid- station.
KEYWORDS: Critical load; Non-Critical load; Optimised Load balancing; Power Grid
I. INTRODUCTION
The steps for the power system are generation of power, transmission of power and distribution of power. Once power transmission to the subsystem is done, the next thing is to distribute the power among all the consumers. The faulty distribution can lead some areas to be overloaded and some areas with less loaded. So to avoid these conditions, controlling of power and hence controlling of load is required in those areas. It leads to the load balancing technique. Load balancing is the process to prevent the system from overloading situation. This project explains the details of load balancing and steps for how to design and implement a load balancing in power distribution.
Consumption of the power at consumer side is highly unpredictable. Consumption varies at each time of the day and each day of a year. It is hard to save large amount of electricity using buffers, to avoid such problems, power controlling is desirable. Automatic generation control (AGC) is the one way to control power. It is implemented at the power generation side and it controls the generation of power as requirement or load changes. If the power usage is very small, it is costly to implement such a system. So load balancing is the easy way to control power.
ISSN(Online): 2320-9801
ISSN (Print) : 2320-9798
International Journal of Innovative Research in Computer
and Communication Engineering
(An ISO 3297: 2007 Certified Organization)
Vol. 4, Issue 3, March 2016
assuming that the total load of the each feeder is different. Load balancing can be designed by many ways, but here
load balancing is designed and explained by using MATLAB
.
II. RELATED WORK
In [1] authors presented Real-time Particle Swarm Optimization(PSO)-based energy management of a stand-alone
hybrid wind-MT-ES system. The developed Energy Management System (EMS) promotes energy sustainability by ensuring an optimal balance between the attached generation sources based on the multiple constraints and by incorporating desirable energy objectives into the EMS decision-making process. Extremely fast convergence time is the main advantage of the PSO-based energy management strategy which is critically important for real-time energy management applications. In [2] authors have successfully developed an intelligent optimal energy management system for hybrid power sources including a FC system and a battery module. This system including adaptive fast-charging control, fuzzy hydrogen control, and fan temperature control has been successfully designed and applied well to a practical system with hybrid power sources. This paper provides some improvement ideas to be direction for the future research. In [3] authors have presented a communication-oriented design of a full-fledged system for the minimization of power losses in micro-grids, where communication and power loss optimization algorithms are jointly implemented. They have studied the performance of such system in terms of power loss reduction and convergence time when the communication network provides error free communications. They have then explored the resilience of selected optimization techniques when communication links are subject to failures. In [4] authors has been implemented an optimized online energy management based on a hierarchical controller for stand- alone hybrid power systems. In this work developed ANN-based model can predict the MPP for a PV panel with high accuracy. Real-time measured parameters and practical load profile are used as inputs for the developed management system. The hybrid topology exhibits excellent performance under various operating conditions, and maintain the SOC between 40% - 80%. In [5] authors gave new load shedding scheme for a local area in distribution which is based on adaptive and intelligent load shedding techniques and hence it is able to local area load shedding techniques intelligently according to time schedule. Thus, load stability is achieved in micro grid load shedding operation, when generation is less than demand. Further efficiency is evaluated through simulation in MATLAB Fuzzy logic toolbox and implemented in FPGA.
III.PROBLEM STATEMENT
Individual Feeder lines distributed from Power Grid- station supply power to different kinds of consumers. Power consumption at consumer side is highly unpredictable and varies from one instant to another instant. This leads to some feeders to be overloaded and others to be less loaded during power distribution. In this project, this problem is taken to overcome.
IV.PROBLEM SOLUTION
In this project, Optimised Load balancing technique is used to overcome the feeders overloading and under-loading problem arises during power distribution in Power Grid- station by using MATLAB.
At an instant, the readings of all feeders in power substation are taken. Then compare the each feeder reading with its threshold value. After this comparison feeder status came to know, which feeder is overloaded and which one is less-loaded. Then extra load of the overloaded feeder is transferred to less loaded feeder. In this way feeders load can be balanced.
V. OBJECTIVES
The following are the objectives of this project:
Monitor the load/power consumption in every equal time interval for all the feeders
Set the threshold value of load for each feeder.
If the load is below the threshold value then feeder is less loaded.
ISSN(Online): 2320-9801
ISSN (Print) : 2320-9798
International Journal of Innovative Research in Computer
and Communication Engineering
(An ISO 3297: 2007 Certified Organization)
Vol. 4, Issue 3, March 2016
If the feeder is overloaded then by using MATLAB Optimized Load balancing technique divert the extra load
to the less loaded feeders.
Actuate the switching control system for switch over to the new feeder line.
Repeat the process for other feeders.
VI.PROPOSED OPTIMIZED LOAD SHARING ALGORITHM
Step 1: Start
Step 2: Read actual load values of feeders
→ = { , , … }
Step 3: Set threshold load values for each feeder
→ = , , …
For X →1: N
Step 4:
→ = → − →
Step 5:
→ = ( ) → + ( ) →
Step 6: Repeat step 4 until > + 1
Step 7: Stop
VII. IMPLEMENTATION OF FEEDERS LOAD BALANCING IN POWER GRID STATION USING MATLAB
Let us consider the Power Grid- station consisting of 11 feeders. The 1stMarch2014, hourly practical readings of 11
feeders is taken from Tiptur main Power Grid- station and is shown in table 2. In this project, first set the threshold values for all the feeders. The threshold values set here are the mean values of the feeders. Thus each feeder has its own threshold amount of load/power consumption. The threshold values for 11 feeders i.e., F1, F2, F3, F4, F5, F6, F7, F8, F9, F10 and F11 are shown in table 1.
Table 1: Threshold values (set) for 11 feeders of power substation
F1 F2 F3 F4 F5 F6 F7 F8 F9 F10 F11
MW MW MW MW MW MW MW MW MW MW MW
Mean 0.3781 1.025 0.7671 0.4893 1.1485 0.879 0.4655 0.5827 1.3643 0.358 0.1827 Feeders
ISSN(Online): 2320-9801
ISSN (Print) : 2320-9798
International Journal of Innovative Research in Computer
and Communication Engineering
(An ISO 3297: 2007 Certified Organization)
Vol. 4, Issue 3, March 2016
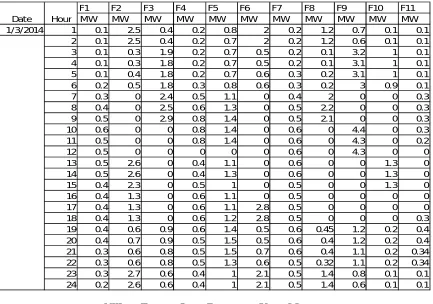
Table 2: Hourly practical readings of 11 feeders of power substation
F1 F2 F3 F4 F5 F6 F7 F8 F9 F10 F11
MW MW MW MW MW MW MW MW MW MW MW
1/3/2014 1 0.1 2.5 0.4 0.2 0.8 2 0.2 1.2 0.7 0.1 0.1
2 0.1 2.5 0.4 0.2 0.7 2 0.2 1.2 0.6 0.1 0.1
3 0.1 0.3 1.9 0.2 0.7 0.5 0.2 0.1 3.2 1 0.1
4 0.1 0.3 1.8 0.2 0.7 0.5 0.2 0.1 3.1 1 0.1
5 0.1 0.4 1.8 0.2 0.7 0.6 0.3 0.2 3.1 1 0.1
6 0.2 0.5 1.8 0.3 0.8 0.6 0.3 0.2 3 0.9 0.1
7 0.3 0 2.4 0.5 1.1 0 0.4 2 0 0 0.3
8 0.4 0 2.5 0.6 1.3 0 0.5 2.2 0 0 0.3
9 0.5 0 2.9 0.8 1.4 0 0.5 2.1 0 0 0.3
10 0.6 0 0 0.8 1.4 0 0.6 0 4.4 0 0.3
11 0.5 0 0 0.8 1.4 0 0.6 0 4.3 0 0.2
12 0.5 0 0 0 0 0 0.6 0 4.3 0 0
13 0.5 2.6 0 0.4 1.1 0 0.6 0 0 1.3 0
14 0.5 2.6 0 0.4 1.3 0 0.6 0 0 1.3 0
15 0.4 2.3 0 0.5 1 0 0.5 0 0 1.3 0
16 0.4 1.3 0 0.6 1.1 0 0.5 0 0 0 0
17 0.4 1.3 0 0.6 1.1 2.8 0.5 0 0 0 0
18 0.4 1.3 0 0.6 1.2 2.8 0.5 0 0 0 0.3
19 0.4 0.6 0.9 0.6 1.4 0.5 0.6 0.45 1.2 0.2 0.4
20 0.4 0.7 0.9 0.5 1.5 0.5 0.6 0.4 1.2 0.2 0.4
21 0.3 0.6 0.8 0.5 1.5 0.7 0.6 0.4 1.1 0.2 0.34
22 0.3 0.6 0.8 0.5 1.3 0.6 0.5 0.32 1.1 0.2 0.34
23 0.3 2.7 0.6 0.4 1 2.1 0.5 1.4 0.8 0.1 0.1
24 0.2 2.6 0.6 0.4 1 2.1 0.5 1.4 0.6 0.1 0.1
Date Hour
VIII. FEEDERS LOAD BALANCING USING MATLAB
The load/power consumption is checked at defined time for all 11 feeders in Power Grid- station. Before that, set the threshold values for all the 11 feeders. If the power consumption is not over the threshold value, means the feeders load is balanced within limits. So there is no need to balance the feeders load. However, if the power consumption of any feeder is greater than the threshold value, load balancing using MATLAB is required.
By observing the hourly practical readings of 11 feeders of Power Grid- station as in table 2 and threshold values
(set) for 11 feeders of Power Grid- station as in table 1, it shows that feeder’s load is totally unbalanced. At 1a.m, F2, F6 and F8 are overloaded feeders and remaining are the less loaded. At this instant the load of feeders are unbalanced and there is a need to balance it.
By applying the Optimised Load balancing technique using MATLAB to the unbalanced feeders, feeders load can be balanced.
IX.MODIFIED READINGS AND PLOTS OF FEEDERS USING MATLAB
After implementing the Optimized Load balancing technique, the load of all the feeders has been maintained nearly
or equal to the threshold value and the corresponding load of all the feeders are as shown in table 3. So it means that the
ISSN(Online): 2320-9801
ISSN (Print) : 2320-9798
International Journal of Innovative Research in Computer
and Communication Engineering
(An ISO 3297: 2007 Certified Organization)
Vol. 4, Issue 3, March 2016
Table 3: Modified readings for feeders of power substation.
F1 F2 F3 F4 F5 F6 F7 F8 F9 F10 F11
MW MW MW MW MW MW MW MW MW MW MW
1/3/2014 1 0.635 1.0248 0.7671 0.4893 1.149 0.8792 0.6644 0.5827 1.364 0.5624 0.183 2 0.635 1.0248 0.7671 0.4893 1.149 0.8792 0.583 0.5827 1.364 0.4438 0.183 3 0.661 1.0248 0.7671 0.4893 1.149 0.8792 0.5637 0.5827 1.364 0.3582 0.461 4 0.378 1.2874 0.7671 0.4893 1.149 0.8792 0.4731 0.5827 1.364 0.3582 0.372 5 0.378 1.3885 0.7671 0.4893 1.149 0.8792 0.6731 0.5827 1.364 0.3582 0.471 6 0.742 1.3911 0.7671 0.4893 1.149 0.8792 0.7951 0.5827 1.364 0.3582 0.183 7 0.3 1.0248 0.7671 0.4893 1.1 0.6611 0.4 0.5827 1.364 0.128 0.183 8 0.4 1.0248 0.7671 0.5821 1.149 0.8792 0.5 0.5827 1.364 0.3686 0.183 9 0.5 1.0248 0.7671 0.7408 1.149 1.0793 0.5 0.5827 1.364 0.4925 0.3 10 0.378 1.1992 0.7671 0.4893 1.149 0.8792 0.6 0.6161 1.364 0.3582 0.3 11 0.48 1.0248 0.7671 0.4893 1.149 0.8792 0.4655 0.5827 1.364 0.3991 0.2 12 0.378 1.0248 0.2564 0 1.149 0.7624 0.4655 0 1.364 0 0 13 0.378 1.0248 0.3328 0.4 1.1 0.8792 0.4655 0.1971 1.364 0.3582 0 14 0.378 1.0248 0.408 0.4 1.149 0.8792 0.4655 0.2734 1.364 0.3582 0 15 0.378 1.0248 0.1297 0.4893 1 0.8792 0.4655 0 1.275 0.3582 0
16 0.378 1.0248 0 0.4893 1.1 0 0.4655 0 0.442 0 0
17 0.378 1.0248 0.5565 0.4893 1.1 0.8792 0.4655 0.3316 1.364 0.1107 0 18 0.378 1.0248 0.591 0.4893 1.149 0.8792 0.4655 0.4078 1.364 0.1688 0.183 19 0.378 0.986 0.7671 0.4893 1.149 0.828 0.4655 0.45 1.333 0.2219 0.183 20 0.378 0.9173 0.7671 0.4893 1.149 0.8515 0.4655 0.5345 1.333 0.2326 0.183 21 0.3 0.9515 0.7671 0.4893 1.149 0.7329 0.4655 0.5345 1.257 0.2107 0.183 22 0.3 0.7918 0.7671 0.4893 1.149 0.7515 0.4655 0.3307 1.133 0.2 0.183 23 1.117 1.0248 1.5812 0.4893 1.149 0.8792 0.5 0.5827 1.364 0.3582 0.955 24 0.378 1.6872 1.4173 0.4893 1.149 0.8792 0.5 0.5827 1.364 0.3582 0.795 Date Hour
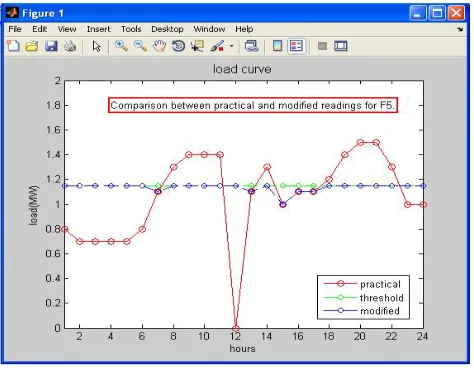
The load curves are plotted i.e., load (MW) versus hours. In plot, x-axis is labeled as hours and y-axis is labeled as load (MW). Red curve in the plot indicates practical readings, green curve indicates threshold values of corresponding feeder and blue curve indicates modified readings of the feeders.
The corresponding load curve plots of the feeders are shown in the following figures:
Fig.1. Plot shows comparison between practical & modified reading of F5
ISSN(Online): 2320-9801
ISSN (Print) : 2320-9798
International Journal of Innovative Research in Computer
and Communication Engineering
(An ISO 3297: 2007 Certified Organization)
Vol. 4, Issue 3, March 2016
Fig.2. Plot shows comparison between practical & modified reading of F9
Similarly, fig. 2 shows the snap load variation of the feeder No. 9 (F9). In this, at 10am load for that feeder has steeply increased to nearly 4.5MW, the optimized techniques used in this project makes the feeder load in line with the threshold value. Through this, the effectiveness and the reliability of the proposed system can analysed.
The same way, individual feeder load status and its load correction/modification can be viewed easily. This may required for analysing the load flow on individual feeder. In addition, a GUI (Graphical User Interface) prepared for visualising the entire feeder in the Power Grid- station load in 24 hours. The fig. 3 shows all the feeder present in Power Grid- station load flow statistics.
Fig.3. GUI for showing practical and modified readings of all 11 feeders at 1 am.
X. CONCLUSION
The existing feeders load balancing system is completely done by manually; this requires skill along with the experience. This project gives a good understanding of load balancing system works automatically.
ISSN(Online): 2320-9801
ISSN (Print) : 2320-9798
International Journal of Innovative Research in Computer
and Communication Engineering
(An ISO 3297: 2007 Certified Organization)
Vol. 4, Issue 3, March 2016
power distribution. Depending upon the consumer usage, the distribution should be such that it can avoid overloading situation. Load profile gives the graphical representation of the customer power usage.
Automatic generation control is a method to manage the continuously changing load. It is implemented at the power generating station side and it controls the power generation depending upon the change in load. It is good alternative to load balancing, but it is very costly. So managing the load is best employed. In this project, Optimized Load balancing scheme have been designed successfully by using MATLAB.
XI.FUTURE SCOPE
This Optimized Load balancing/sharing algorithm can be implemented in real time.
REFERENCES
1. S. Ali Pourmousavi, M. Hashem Nehrir, Christopher M. Colson, and Caisheng Wang, “Real-Time Energy Management of a Stand-Alone Hybrid Wind-Microturbine Energy System Using Particle Swarm Optimization”, IEEE Trans. Sustainable Energy, vol. 1, no. 3, Oct. 2010. 2. Rong-Jong Wai, Shih-Jie Jhung, Jun-Jie Liaw, and Yung-Ruei Chang, “Intelligent Optimal Energy Management System for Hybrid Power
Sources Including Fuel Cell and Battery ”,IEEE Trans on Power Electronics, Vol. 28, no. 7, July 2013.
3. Riccardo Bonetto, Stefano Tomasin and Michele Rossi, “Distributed Power Loss Minimization in Residential Micro Grids: a Communications Perspective”, arxiv:1311.6949V1[cs.oh] 27 Nov 2013
4. Emad M. Natsheh, Alhussein Albarbar, “Hybrid Power Systems Energy Controller Based on Neural Network and Fuzzy Logic”, Smart Grid
and Renewable Energy, 2013, 4, 187-197
5. V.Prabhu, Yogananth “Microgrid power load shedding implemented in FPGA using fuzzy logic” IJIRS vol 3 issue 1 January 2014. ISSN:2319-9725.
BIOGRAPHY
Prof. D S Suresh received his B.E degree in IT branch, MBA, M.Tech in Biomedical Instrumentation. He did his research in Electronics Engineering and awarded Ph.D from university of Mysore. Professor Suresh having rich experience in both industry and academics. Currently, Professor Suresh is working as a Professor in the Dept., of ECE, Channabasaveshwara Institute of Technology, Gubbi, in addition, he is the Director and Principal of the Institution. His research interests in the areas of Biomedical Instrumentation, embedded system design etc. He authored a few Text books and has published papers in many national/international journals & Conferences. He has guided many projects sponsored by KSCST.
Mr. R Sekar received his B.E degree from university of Madras and he did his P.G in Power Electronics and drives from Anna University, Chennai. Currently Mr. Sekar working as an Associate Professor in Dept., of ECE, Channabasaveshwara Institute of Technology, Gubbi. His research interests in the areas of Power Electronics, Electrical drives, Renewable energy systems, etc.
Mr. Rajendra C J received his B.E degree in EEE and he did his P.G degree in Electronics Engineering from VTU, Belgaum. Currently Mr. Rajendra is working as an Assistant Professor in Dept., of ECE, Channabasaveshwara Institute of Technology, Gubbi. His research interests in the areas of Embedded Systems, Biomedical Instrumentation etc.