ABSTRACT
CHEWNING, CAROLINE. Evaluation of Post Pellet Liquid Application, Feed Form and Particle Size on Broiler Performance. (Under the direction of Charles R. Stark).
The objective of these studies was to determine the effect that feed manufacturing has on broiler performance. The first study evaluated the effect of the accuracy of post pellet liquid fat application (PPLA) on broiler performance. Poor application of fat has been believed to affect bird performance and production cost. The study was designed to test the effect of over and under application of poultry fat to broiler feed post pelleting. Fat was applied post pelleting to a common corn-soy diet to produce three treatment fat levels (80, 100, and 120% of target); the fourth treatment consisted of a rotation of the 80, 100, and 120% diets to match the nutrient package of the 100% treatment. BW and feed consumption were determined at 14, 35, and 45 d of age and adjusted feed conversion (AdjFCR) calculated. There were no effects on BW and FCR at 35 d of age but birds fed the diet that contained 80% fat from 35 to 45 d exhibited poorer FCR in comparison to the other treatments (1.74 versus 1.59, 1.62, and 1.63). The results indicated that under application of fat (80%) to finisher feed produced poorer FCR while over application of fat simply increased feed costs and would be expected to create shrink at the feed mill.
P120) with fat levels at 80, 100, and 120% of target, respectively. A fourth treatment (M100) compared the addition of 100% of the dietary fat in the mixer prior to pelleting. BW and feed consumption were determined at 14, 35, 42 and 47 d of age and adjusted feed conversion (AdjFCR) calculated. The overall AdjFCR of birds fed the P80, P100, P120, and M100 diets was 1.78, 1.77, 1.75, and 1.80. The over application of fat (P120) tended to improved AdjFCR in broilers that were fed lower energy diets.
Evaluation of Post Pellet Liquid Application, Particle Size, and Feed Form on Broiler Performance
by
Caroline Gibson Chewning
A thesis submitted to the Graduate Faculty of North Carolina State University
in partial fulfillment of the requirements for the degree of
Master of Science.
Poultry Science
Raleigh, North Carolina 2010
APPROVED BY:
_______________________________ ______________________________
Eric van Heugten John T. Brake
________________________________ Charles R. Stark
DEDICATION
ii BIOGRAPHY
iii ACKNOWLEDGMENTS
I would like to thank my advisor, Dr. Charles Stark, for his guidance, patience, and support throughout this journey. Hopefully you will always have fond memories of your first graduate student. I would also like to thank my committee members, Dr. John Brake and Dr. Eric van Heugten, for their advice and assistance during my arduous journey.
I could not have completed my research without the help of the North Carolina State University Research Feedmill, especially manager Carl Whisenant, as well as the North Carolina State University Chicken Educational Unit staff.
I would especially like to thank Mike Mann, Susan Creech, Lynn Strother, Nirada Leksrisompong, Mireille Arguelles Ramos, and Wilmer Pacheco for their willingness to lend a hand, an ear, or an eye if needed.
iv TABLE OF CONTENTS
LIST OF TABLES……….. vi
INTRODUCTION………... 1
CHAPTER ONE: LITERATURE REVIEW……….. 3
Post Pellet Liquid Application of Fat………. 4
Energy……… 5
Feed Form……….. 6
Particle Size………... 8
References……….. 10
CHAPTER TWO: EFFECT OF ACCURACY OF POST PELLET LIQUID APPLICATION OF FAT ON BROILER PERFORMANCE……… 13
Summary………. 14
Description of Problem………... 15
Materials and Methods………... 16
Results and Discussion………... 19
Conclusions and Applications……… 22
References……….. 23
CHAPTER THREE: EFFECT OF PARTICLE SIZE AND FEED FORM ON BROILER PERFORMANCE………... 25
Summary………. 26
v
Materials and Methods………... 28
Results and Discussion………... 30
Conclusions and Applications……….... 34
References………... 35
vi LIST OF TABLES
Table 1: The composition of the broiler basal starter, grower, and finisher diets for Experiment 1……….……
40
Table 2: The composition of the broiler basal starter, grower, and finisher diets for Experiment 2……….……
41
Table 3: Actual crude fat and percent of target in PPLA Experiments 1 and 2……... 42 Table 4: Performance of broilers fed different levels of PPLA applied fat in
Experiment 1……….………. 43
Table 5: Performance of broilers fed different levels of PPLA applied fat in
Experiment 2……….………. 44
Table 6: The composition of the broiler basal starter, grower, and finisher diets
for Experiment 3……….…… 45
Table 7: Effect of feed form, particle size, and the interaction on BW of male and female broilers in Experiment 3………...……….. 46 Table 8. Effect of feed form, particle size and the interaction on feed intake of
broilers in Experiment 3………. 47
Table 9: Effect of feed form, particle size, and the interactions on adjusted feed
conversion ratio (AdjFCR) in Experiment 3...………... 48 Table 10. Percentage fines and Pellet Durability Index (PDI) of the pelleted
treatments in Experiment 3……… 49
Table 11. Effect of gizzard weight (g) and percentage gizzard in Experiment 3
INTRODUCTION
The cost of feed is a primary concern to the poultry industry since it compromises over 60% of the total cost of production. Nutritionists, feed mill mangers, and live production specialists continually look for opportunities to improve feed conversion as well as to improve growth.
The application of fat to pellets can be used to produce a better quality pellet as well as provide additional nourishment to the birds. A properly operated post pellet liquid application (PPLA) system can help reduce the shrink in feed mills as well as create a nutrient rich feed for broilers. The over application of fat reduces the feed mill’s inventory of fat and results in shrink, while the under application of fat decreases the energy available to the bird.
2 gizzards and decreased gut function, which translates into a loss in sales and poorer feed conversion.
3 CHAPTER ONE
4 Post Pellet Liquid Application
Poultry companies continuously seek methods to reduce costs but still provide adequate nutrition. The PPLA system was developed to minimize the amount of fat in the mixer in order to improve pellet quality as well as apply enzymes, micro-ingredients, and fat to pelleted feed [1]. Research has shown that removing the fat from the meal before pelleting improves pellet quality [1]. The goal of the PPLA equipment is to uniformly distribute the liquid to the outside of the pellet.
Advancements in PPLA system technology have allowed feed manufacturers to produce feed that more closely meets the dietary requirements set forth by nutritionists [2,3]. In addition to improved accuracy, PPLA systems found in the industry today have been reported to require minimal maintenance [2].
Several types of PPLA systems exist in the industry; systems have been typically categorized by the method in which they measure dry feed and liquid addition. Volumetric systems direct a constant volume of dry feed into the liquid application chamber [1,2]. Mass flow systems continuously measure the pressure of feed as it flows across an impact plate [1,2]. Gravimetric feeders use a load cell to continuously monitor the weight as it flows through a drag or screw conveyor [1]. The industry initially installed volumetric and mass flow feeders due to their lower installation cost as compared to gravimetric feeders. Although gravimetric feeders have the highest cost, they are the most accurate available [1].
5 systems are spinning disk, spray chamber, and batch systems for combining dry feed and liquids. The RotoCoater system sprays liquid onto high speed rotating disks. The high speed disks then distribute the fat in a mist form onto the pellets [4]. Another common applicator is the spray chamber where a nozzle is used to spray the liquid onto the pellets as they move through the chamber. Batch mixing has been commonly used in Europe where a paddle mixer is used to coat and mix the liquid and pellets.
After coating, pellets enter a mixer or screw conveyor that further aids in the distribution of the liquid. Mixing of the feed has helped provide a more uniform coating of the pellets [4]. However, the additional mixing time has increased the percentage of fines to pellet ratio, and therefore must be closely monitored.
The common denominator in these systems is that they measure dry feed and liquids separately, and then combine them based on a pre-determined proportion. The primary difference in these systems is how the dry feed and liquid are measured and combined.
Ongoing research has focused on improvement of the accuracy of the PPLA system. A CV of 15% has become generally accepted as a reasonable accuracy for a PPLA system [2]. If the feed mill accurately applied the amount of fat required, it could save thousands of dollars a year.
Energy
6 broiler diet. Research has shown that high energy diets fed to broilers maximized growth and performance [5]. Fat supplementation has been widely used to create high energy diets [6]. Leeson et al. [5] determined that supplemental fat changed the energy content of the feed. Researchers have shown that fat supplementation increased the use of metabolizable energy calories in a manner that they termed as “extra caloric” effect [6,7,8,9]. The high energy diets resulted in an increased weight gain and improved feed efficiency [10,11,12]. In addition to the extra energy, the supplemental fat may also improve the digestibility of the feed [6]. Brue et al. [6] reported birds that consumed a higher ME caloric diet had a lower FCR. Researchers have also demonstrated that birds fed additional energy required fewer days to reach the target BW and had improved FCR [6,13,14]. Although fat supplementation has been shown to benefit broilers, Leeson et al. [14] suggested that broilers can adapt to low energy diets. Previous studies have shown birds fed lower energy diets were more efficient in converting energy to BW gain but their feed intake increased to compensate for the reduced caloric intake [14,15]. However, as the broiler industry transitions to heavy bird weights the bird’s ability to consume enough feed and energy may restrict growth, especially during the last 7 to 10 days.
Feed Form
7 been shown to increase BW and improve feed conversion in both broilers and turkeys [19,20]. A study conducted by McKinney et al. [19] evaluated the effect of feeding pellets versus mash diets and the effect of pellet quality that ranged from 100% to 20% pellets in comparison to a mash feed, with birds showing a preference for the pellets without fines, respectively. The BW gain and FCR reported for the 100% pellet diet was 725 g and 1.87, however as the diets decreased in the percentage pellets and increased in percentage fines, there was a reduction in BW gain and birds had a poorer FCR. The mash diet resulted in a BW gain of 643 g and a FCR of 2.02. Similar results were found by Nir et al. [20], the pelleted feed form improved BW and FCR over the mash feed.
Pelleted feed decreases feed ingredient separation, feed wastage and improved palatability [21]. Behnke et al. [21] stated that the bird’s anatomy may cause feed wastage since without teeth it is more difficult to grasp the feed from feeder. Birds consuming mash diets that contained inconsistent particle sizes easily dropped feed particles. In addition to feed wastage, it has been proposed that birds consuming mash diets expended extra energy to consume enough feed to meet their energy requirement for growth due to spending more time at the feeder. Research has demonstrated that birds fed mash feed and pelleted diets that contain a large amount of fines, required extra standing and eating time, therefore the birds were expending extra energy for these activities. The poorer FCR of birds fed mash diets supported the theory that extra energy is required to stand and eat at the feeders [21].
8 beneficial effect of pellets was reduced when birds received poor quality pellets. Briggs et al. [22] reported a poor quality pellet resulted in a high number of fines that were poorly consumed. Lemme et al. [23] conducted a study that tested the broiler response to poor quality and good quality pellets. During the study, birds fed the good quality pellets had the highest BW gain and feed intake. McKinney et al. [19] reported feed conversion improved by 5% when birds were fed pelleted diets in comparison with mash diets.
Particle Size
One option to improve pellet quality is through reduced ingredient particle size. Stark [24] reported that decreasing the particle size of corn and soybean meal resulted in improved pellet quality. Particle size reduction also facilitated greater interaction with digestive enzymes because of the greater amount of surface area available for enzyme access in the animal [16,25]. Research conducted in swine has shown a linear improvement in the FCR of finishing pigs as the particle size of the cereal grain in the diet decreased [25]. The success of particle size reduction in the swine industry has led to research in the poultry industry to determine if a similar effect existed in broilers.
9 reduction of wheat and corn in broiler diets. The research suggested that wheat should be more coarsely ground than corn possibly due to difference in endosperm hardness [17,20].
Results of a smaller particle size effect on gizzard development have been controversial. Nir et al. [20] and Engberg et al. [25] demonstrated a benefit to smaller particle size on the development of the gizzard. Other research has shown reduced gizzard development when birds received finely ground corn. A well-developed gizzard has been reported to improve feed utilization and lowered production costs [26]. Although particle size may be manipulated to improve broiler performance and reduce cost, the form of feed must be factored in. Large particle size has been shown to have a positive effect on broiler performance when fed in mash form [20]. Coarse particle size ingredients required a longer time inside the gizzard [17]. Coarser particle size required an increase in the time that feed remained in the gizzard, which increased gizzard activity and improved function [17]. Santos et al. [27] discovered that coarser diets resulted in heavier gizzard weights due to the increased amount of work needed to digest the particles.
10 REFERENCES
1. Froetschner, J.R. 2007. Micro-ingredient application and equipment: issues and advances. Animal Feed Manufacturer Assn. Forum Proceedings. Sun City, South Africa.
2. Aicher, E. 2004. Post pellet liquid application. Feed International. p. 1-4.
3. Aicher, E. 2005. Post pellet liquid application (PPLA) – not just for large integrator feed mills. Multi-State Poultry Meeting. BASF Corp.
4. Decksheimer, D. 2009. Post pelleting liquid application: a practical guide: Part1, Part 2, Part 3. Comco Systems, Inc.
http://www.feedmachinery.com/articles/feed_technology/postpelleting-liquid-application/.
5. Leeson, S., and J. D. Summers. 1991. Broiler diet specifications. Commercial Poultry Nutrition. University Books, Guelph, Ontario, Canada.
6. Brue, R. N., and J. D. Latshaw. 1985. Energy utilization by the broiler chicken as affected by various fats and fat levels. Poult. Sci. 64:2119-2130.
7. Plavnik, I., E. Wax, D. Sklan, and S. Hurwitz. 1997. The response of broiler chickens and turkey poults to steam-pelleted diets supplemented with fat or carbohydrates. Poult. Sci. 76:1006-1013.
8. Rand, N. T., H. M. Scott, and F. A. Kummerow. 1958. Dietary fat in the nutrition of the growing chick. Poult. Sci. 37:1075-1085.
9. Touchburn, S. P., and E. C. Namber. 1966. The energy value of fats for growing turkeys. Pages 190-195 in Proc. 13th World’s Poult. Congress, Kiev, Russia. 10.Jensen, L. S., G. W. Schumaier, and J. D. Latshaw. 1970. “Extra caloric” effect of
dietary fat for developing turkeys as influenced by calorie-protein ratio. Poult. Sci. 49:1697-1704.
11 12.Rosebrough, R.W., N. C. Steele, and L. T. Frobish. 1981. Effects of dietary fat on
feed efficiency, reproductive performance, and in vitro lipogenesis by the turkey hen. Poult. Sci. 60:1931-1938.
13.Federation of Animal Science Societies. 1999. Guide for the Care and Use of
Agricultural Animals in Agricultural Research and Testing. 1st rev. ed. FASS, Savoy, IL.
14.Leeson, S, L. Caston, and J. D. Summers. 1996. Broiler response to energy or energy and protein dilution in the finisher diet. Poult. Sci. 75:522-528.
15.Leeson, S., L. Caston, and J. D. Summers. 1996. Broiler response to energy. Poult. Sci. 75:529-535.
16.Goodband, R. D., M. D. Tokach, and J. L. Nelssen. 2002. The effects of diet particle size on animal performance. Kansas State University Agricultural Experiment Station and Cooperative Extension Service. MF-2050.
17.Amerah, A. M., V. Ravindran, R. G. Lentle, and D. G. Thomas. 2008. Influence of feed particle size on the performance, energy utilization, digestive tract development, and digesta parameters of broiler starters fed wheat- and corn-based diets. Poult. Sci. 87:2320-2328.
18.Amerah, A. M., V. Ravindran, R. G. Lentle, and D. G. Thomas. 2007. Influence of feed particle size on the performance, energy utilization, digestive tract development, and digesta parameters of broiler starters. Poult. Sci. 86:2615-2623.
19.McKinney, L. J., and R. G. Teeter. 2004. Predicting effective caloric value of nonnutritive factors: I. Pellet quality and II. Prediction of consequential formulation dead zones. Poult. Sci. 83:1165-1174.
20.Nir, I., R. Hillel, I. Ptichi, and G. Shefet. 1995. Effect of particle size on performance. 3. Grinding pelleting interactions. Poult. Sci. 74:771-783.
21.Behnke, K. C., and R. Scott Beyer. 2002. Effect of feed processing on broiler performance. VIII International Seminar on Poultry Production and Pathology. Santiago, Chile.
12 23.Lemme, A., P. J. A. Wijtten, J. van Michen, A. Petri, and D. J. Langhout. 2006.
Responses of male growing broilers to increasing levels of balanced protein offered as coarse mash or pellets of varying quality. Poult. Sci. 85:721-730.
24.Stark, C.R. 1994. Pellet quality I. Pellet quality and its effects on swine performance. II. Functional characteristics of ingredients in the formation of quality pellets. Ph.D. Dissertation, Kansas State Univ., Manhattan.
25.Engberg, R. M., M. S. Hedemann, and B. B. Jensen. 2002. The influence of grinding and pelleting of feed on the microbial composition and activity in the digestive tract of broiler chickens. Brit. Poult. Sci. 44:569-579.
26.Ferket, P. 2000. Feeding whole grains to poultry improves gut health. Feedstuffs 72:12–14.
13 CHAPTER TWO
EFFECT OF ACCURACY OF POST-PELLET LIQUID APPLICATION OF FAT
14 SUMMARY
An experiment was conducted to evaluate the effects of the accuracy of post-pellet liquid fat application (PPLA) on broiler performance. Fat content of feed has been routinely used to monitor feed quality and explain shrink at feed mills. Furthermore, poor application of fat has been believed to affect bird performance and production costs. These studies were designed to test the effect of over and under application of poultry fat to broiler feed post pelleting on broiler performance. The first study used 1,024 male broiler chicks that were randomly assigned to one of four treatment diet series with 8 replicate pens per treatment and 32 birds per pen. Fat was applied post-pelleting to a common corn-soy diet to produce three treatment fat levels (80, 100, and 120% of target), while birds on the fourth treatment (blended) were randomly fed the 80, 100, and 120% fat diets to match the nutrient package fed to birds assigned to the 100% treatment. Diets were formulated to contain a total of 7.7, 7.4, and 6.3% fat in the starter, grower, and finisher feeds, respectively. BW and feed consumption were determined at 14, 35, and 45 d of age and adjusted feed conversion ratio (AdjFCR) calculated by including the weights of all dead birds. Feed was analyzed for crude fat and the percentage total fat fed to the birds was calculated for each diet. Results showed that the birds received 84, 103, and 124% of target in the starter feed, 85, 101, and 121% of target in the grower feed, and 78, 98, and 115% of target in the finisher feed for the respective 80, 100, and 120% treatments. There were no effects on BW and AdjFCR.
15 effect of over and under application of poultry fat in the PPLA process in low energy broiler diets. A total of 1,024 male broiler chicks were randomly assigned to one of four treatment diet series with 8 replicate pens per treatment and 32 birds per pen. Fat was applied post-pelleting to a single common corn-soy diet to produce three treatments with fat levels at 80, 100, and 120% of target, respectively. A fourth treatment, mixer, compared the addition of 100% of the dietary fat in the mixer prior to pelleting. Diets were formulated to contain a total of 6.8, 7.0, and 6.9% fat in the starter, grower, and finisher feeds, respectively. BW and feed consumption were determined at 14, 35, 42 and 47 d of age and adjusted feed conversion ratio (AdjFCR) calculated. Feed was analyzed for crude fat and the percentage total fat fed to the birds was calculated for each diet. Results showed that the birds received 74, 106, 116, and 84% of target in the starter feed, 77, 101, 119, and 87% of target in the grower feed, and 86, 101, 119, and 107% of target in the finisher feed for the respective 80, 100, 120, and mixer treatments. There were no effects on BW at 47 d of age. The AdjFCR of birds fed the 80, 100, 120, and mixer treatments were 1.86, 1.85, 1.80, and 1.87, respectively. The over application of fat (120) improved AdjFCR in broilers that were fed lower energy diets.
DESCRIPTION OF PROBLEM
16 PPLA systems have improved, nutritionists remain concerned about the effect of over and under application of a liquid ingredient and the effect it has on animal performance. An over or under application of fat will change the energy content of the broiler diet. Research studies have shown birds adapt to lower energy diets by increasing their feed intake [4]. Although birds can adapt to diet energy modifications, researchers have demonstrated that birds fed additional energy required fewer days to reach their target BW and had improved FCR [5,6]. The hypothesis has been that the addition of fat provided extra calories, which when fed in proportion to amino acids resulted in improved bird performance. The objective of these studies was to determine the effect on broiler performance of varying the energy content of the diet due to the under and over application of fat.
METHODS AND MATERIALS
Feed Formulation and Manufacturing
17 added to the crumbles and pellets to achieve feeds that contained 80, 100, and 120% of the target formula value of fat (6.98%) in Experiment 1. The diets in Experiment 2 were formulated to a ME content of 3,035, 3,100, and 3,150 kcal/kg in the starter, grower, and finisher diets, respectively. The manufacturing process described in Experiment 1 was used to produce the 80, 100, and 120 % of target fat (4.87%) treatment diets in Experiment 2. The fourth treatment diet (mixer), in Experiment 2, was produced by adding fat to the original feed batch in the double-ribbon mixer prior to pelleting.
Bird Management
The two experiments were conducted at North Carolina State University Chicken Educational Unit. The care of the birds used in the trial conformed to the Guide for Care and Use of Agriculture Animals in Agriculture Research and Teaching [6]. A total of 1,024 male birds (Ross 344 x 708SF) [9] were weighed and placed on the day of hatching in a curtain-sided house on new litter. Thirty-two birds were placed in each pen and a total of 32 pens were used. Each pen was 1.2 m wide by 3.8 m long. There were four treatments in Experiments 1 and 2, with eight replicates of each treatment. Birds had ad libitum access to feed and water. The lighting program started with 23 h of light for the first seven days, 22 h until 14 d and 20 h until 21 d, natural light was used thereafter. The temperature from hatching to 7 d was kept at 34 to 32º C, 29º C to 14 d, 27º C to 21 d, and ambient thereafter. Experiment 1
18 120, or blended). The birds assigned to the blended treatment were fed on a predetermined schedule in which the 80, 100, and 120 treatment feeds were rotated each time feed was added to the feeders in the other treatments. Birds fed the blended diets were thus sequentially fed 0.23 kg/bird of the 120, 80, and 100 starter diets, 0.45 kg /bird of the 80, 100, 120, 80, 120, and 100 grower diets, and 0.45 kg/bird of the 80, 120, 100, 100, 80, and 120 finisher diets. The birds fed the blended treatment were fed a complete nutrient package within each production phase to match the 100 treatment. Feeders were shaken once per day to 14 d, twice per day to 35 d, and three times per day until 45 d to prevent bridging in the feeders.
Experiment 2
The treatments in Experiment 2 consisted of 80, 100, 120, and mixer. The fat in treatments 80, 100, and 120 was applied post-pelleting. The fat for the mixer treatment was applied in the mixer prior to pelleting. Birds were fed 0.9 kg of starter feed to 14 d, 3.2 kg of grower from 15 to 35 d, and 3.6 kg of finisher from 36 to 47 d. Feeders were shaken once per day to 14 d, twice per day up to 35 d, and three times per day until 47 d to prevent bridging in the feeders.
Data Collection
19 conjunction with each BW. Dead birds were removed and weighed daily. Feed conversion (AdjFCR) was adjusted for mortality by adding mortality weight to pen weight.
Analytical Methods
The crude protein [10], crude fat [11], and moisture content [12] was determined for each diet, before fat application and after. The pellet quality as defined by the pellet durability index [13] was determined on finished pelleted feed.
Data Analysis
Both experiments were a randomized block design. Data were analyzed with the proc GLM procedure of SAS [14]. The least squares procedure was used to separate treatment means with significance set at P < 0.05. The model for Experiment 1 and 2 included block and dietary treatment.
RESULTS AND DISCUSSION
Experiment 1
21 Experiment 2
22 application of fat, which resulted in additional calories, improved AdjFCR. The results of Experiment 1 and 2 indicated that birds can adjust their feed intake to account for the over or under application of fat in a PPLA system as well as variation between loads of feed delivered to the flock. The under application of fat in both experiments resulted in an inventory gain in the feed mill, and did not appear to have a negative effect on broiler growth rate. Experiment 2 does point out that over application of fat can improve AdjFCR in marginal energy diets. However, the over application of fat to diets that were formulated to meet the caloric intake of the birds did not improve BW or AdjFCR and resulted in a shrink in fat inventory at the feed mill, without a performance benefit in the field. Thus, the additional fat is an economic loss in an integrated production system.
CONCLUSIONS AND APPLICATIONS
1. Birds fed the low energy diets responded to the highest application of fat on pelleted diets. 2. Broiler performance was not affected by variation in fat addition levels within a short feeding period.
23 REFERNCES
1. Froetschner, J.R. 2007. Micro-ingredient application and equipment: issues and advances. Animal Feed Manufacturer Assn. Forum Proceedings. Sun City, South Africa.
2. Aicher, E. 2004. Post pellet liquid application. Feed International. p. 1-4.
3. Aicher, E. 2005. Post pellet liquid application (PPLA) – not just for large integrator feed mills. Multi-State Poultry Meeting. BASF Corp.
4. Leeson, S., L. Caston, and J. D. Summers. 1996. Broiler response to energy or energy and Protein Dilution in the Finisher Diet. Poult. Sci. 75:522-528.
5. Brue, R.N., and J. D. Latshaw. 1985. Energy utilization by the broiler chicken as affected by various fats and fat levels. Poult. Sci. 64:2119-2130.
6. Federation of Animal Science Societies. 1999. Guide for the Care and Use of
Agricultural Animals in Agricultural Research and Testing. 1st rev. ed. FASS, Savoy, IL.
7. National Research Council. 1994. Nutrient Requirements of Poultry. 9th rev. ed. Natl. Acad. Sci., Washington, DC.
8. Master Model HD, California Pellet Mill Co.. Crawfordsville, IN. 9. Aviagen Inc, Huntsville, AL.
10.AOAC. 1995. Protein (Crude) in Animal Feed, Combustion, AOAC Official Method 990.03 A-D.
11.AOAC. 1995. Fat (Crude) or Ether Extract in Animal Feed, AOAC Official Method 920.39.
12.AOAC. 1995. Moisture in Animal Feed, Drying at 135º, AOAC Official Method 930.15.
24 14.SAS/STAT Users Guide: Stastistics, Release 6.11. 1996. SAS Inst. Inc., Cary, NC.
SAS Institute.
15.Leeson, S., L. Caston, and J. D. Summers. 1996. Broiler responses to diet energy. Poult. Sci. 75:529-535.
16.Dozier, W.A., C. J. Price, M. T. Kidd, A. Corzo, J. Anderson, and S.L. Branton., 2006. Growth performance, meat yield, and economic responses of broilers fed diets varying in metabolizable energy from thirty to fifty-nine days of age. J. Appl. Poult. Res. 15:367-382.
25 CHAPTER THREE
26 SUMMARY
27 difference in AdjFCR of birds fed the P300 (1.88) and P600 (1.85) diets. The results of the study showed that broilers performed better when fed pelleted diets and demonstrated positive BW response to feeding finer particles up to 21 d.
DESCRIPTION OF PROBLEM
28 broiler performance and reduce cost, the effect of feed form must be considered in combination with particle size. The purpose of this study was to determine if particle size, feed form, and the interaction between particle size and feed form has an effect on broiler performance.
MATERIALS AND METHODS
Broiler Management
Experiment 3 was conducted at the North Carolina State University Chicken Educational Unit. The care of the birds used in the trial conformed to the Guide for Care and Use of Agricultural Animals in Agriculture Research and Teaching [10]. A total of 512 male and 512 female 1 d old chicks (Ross 344 x 708 SF) [11] were weighed and placed on the day of hatching in a curtain-sided, environmentally monitored broiler house for 44 d. Thirty-two birds were placed per pen, with 32 pens total. Each pen was 1.2 m wide by 3.8 m long. There were eight replicates per treatment, with four treatments total. Birds had ad libitum access to water and feed throughout the study. Feeders were shaken once per day until 14 d, three times per day until 35 d, and four times per day from 35 d until termination of the experiment. The lighting program provided 23 hours of light from 1 to 7 d, 22 hours of light to 14 d, 20 of light to 21 d and natural light afterwards. The temperature from hatching to 7 d was kept at 34 to 32º C, 29º C to 14 d, 27º C to 21 d, and ambient thereafter. Feed Formulation
29 grower basal diet contained 20% CP, 1.10% Lys, and 0.83% Met + Cys. The finisher basal diet contained 18.5% CP, 1.10% Lys, and 0.75% Met + Cys. Each diet was iso-nutritive, and all diets met or exceeded the NRC requirements [12]. Corn was ground with a hammermill [13] equipped with 1.6 mm screen to achieve 300 microns average particle size and 7.9 mm screen to achieve an average particle size of 600 microns for starter, grower, and finisher basal diets. The pelleted diets were pelleted at 82°C using a 4.4 mm by 32 mm die [14]. Feed forms, crumble/pellet or mash, were created from each basal depending on the treatment. The birds were fed 0.7 kg/bird of starter, 2.7 kg/bird of grower, and 2.7 kg/bird of finisher diet.
Data Collection
Initial pen body weights were collected at 1 d of age. Body weights and feed consumption were determined at 14, 21, 35, and 44 d of age. Dead birds were removed and weighed daily to calculate mortality. Feed conversion (AdjFCR) was adjusted for mortality by adding the mortality weight to the pen.
Analytical Methods
30 quality as measured by the Pellet Durability Index (PDI) [20] was determined on samples collected at the pellet mill die.
Data Analysis
The experiment was a 2 x 2 factorial, randomized block design: feed form (pellet vs. mash) and particle size (300 vs. 600). Data were analyzed with the proc GLM of SAS. Means were partitioned by least squares means and significant set at P < 0.05. The model for
Experiment 3 was block, particle size, feed form, and sex. RESULTS AND DISCUSSION
Particle size of the ground corn in the P300 treatment was 269, 263, and 269 microns and the P600 treatment was 615, 536, and 519 microns for the starter, grower, and finisher diets, respectively. Pellet quality, as determined by the PDI, for P300 was 89, 85, and 87% compared to the P600 at 86, 82, and 84% for the starter, grower, and finisher diets, respectively (Table 10). These data were consistent with previous research, the smaller particle size created a more durable pellet [21]. The diet that contained finely ground corn (P300) contained fewer fines, 15, 22, and 6 % compared to the P600 at 17, 27, and 8% for starter, grower, and finisher diets, respectively.
31 pellets exhibited a significantly higher BW of 2,298 g compared to the mash diet, 2,236 g [4]. Female broilers had a positive response to pelleted feed at 35 d and 42 d, but the overall BW of pelleted feed was 1,923 g compared to the mash, 1,903 g [4]. McKinney and Teeter [3] also concluded that pellets resulted in higher BW gain, 725 g, versus a gain on mash of 643 g, during a 7 d period. A cage study, performed by Lemme et al. [22], evaluated the difference between coarse mash, poor quality pellets, and good quality pellets on broiler performance. Their study results indicated that good quality pellets had the highest overall BW gain [22].
The BW results observed in the current study were similar to results reported by others. Results of particle size reduction showed an improvement in BW up to 21 d, but the overall effect of particle size on BW at 44 d was not different. The lack of difference in BW observed in our study was similar to the results reported by Amerah et al. [2] who reported no significant difference in BW gain due to fine and coarse particle sizes.
32 Particle size had an affect on the AdjFCR. The present study demonstrated an improvement in AdjFCR when birds were fed mash diets that contained ground corn with a particle size of 300 microns versus 600 microns. In contrast to these results others have reported improved AdjFCR of 1.58 versus 1.62 when birds were fed a coarse versus medium particle size, respectively [23]. A follow-up study by Amerah et al. [2] resulted in an AdjFCR of 1.41 and 1.49 in birds fed coarse and fine particle grain, respectively. The difference in results could be due to the large particle size that was used in the studies. Amerah et al. [23] reported particle size of 839 and 1,164 microns while the previous Amerah et al. [2] study compared particle sizes of 297 and 528 microns. In contrast to the Amerah research, our study compared male and female broilers, while the Amerah studies [2,23] used only male broilers.
The combination of corn ground to 300 or 600 microns and fed as a pellet produced a lower AdjFCR throughout the study. Birds fed the M300 diet had a better AdjFCR overall as compared to M600. The smaller particle size of the corn in the pelleted diet produced a better quality pellet and less fines (Table 10). Conversely, pellets made with coarse grain particles have been found to deteriorate as the pellet moved through the manufacturing process and feed delivery system to the feeder.
33 diets had better AdjFCR, which is in agreement with other researchers [2,23]. Pellets that contain coarser material dissolved slower in the crop, which increased time needed to digest, therefore improving feed utilization [4].
34 CONCLUSIONS AND APPLICATIONS
1. The pelleted feed form resulted in a higher BW and improved AdjFCR compared to the mash feed form.
2. The finer ground grain resulted in poorer AdjFCR compared to the coarser grain. 3. The interaction between feed form and particle size was not present in the pelleted
treatments; the digestibility of the pelleted feed was the same at both particle sizes. 4. Broilers fed mash feed that contained the finer ground grain had slightly higher BW
35 REFERENCES
1. Goodband, R. D., M. D. Tokach, and J. L. Nelssen. 2002. The effects of diet particle size on animal performance. Kansas State University Agricultural Experiment Station and Cooperative Extension Service. MF-2050.
2. Amerah, A. M., V. Ravindran, R. G. Lentle, and D. G. Thomas. 2008. Influence of feed particle size on the performance, energy utilization, digestive tract development, and digesta parameters of broiler starters fed wheat- and corn-based diets. Poult. Sci. 87:2320-2328.
3. McKinney, L. J., and R. G. Teeter. 2004. Predicting effective caloric value of nonnutritive factors: I. Pellet quality and II. Prediction of consequential formulation dead zones. Poult. Sci. 83:1165-1174.
4. Nir, I., R. Hillel, I. Ptichi, and G. Shefet. 1995. Effect of particle size on performance. 3. Grinding pelleting interactions. Poult. Sci. 74:771-783.
5. Behnke, K.C., and R. Scott Beyer. 2002. Effect of feed processing on broiler performance. VIII International Seminar on Poultry Production and Pathology. Santiago, Chile.
6. Briggs, J. L., D. E. Maier, B. A. Watkins, and K.C. Behnke. 1999. Effect of ingredients and processing parameters on pellet quality. Poult. Sci. 78:1464-1471. 7. Nir, I., J. P. Melcoin, and M. Picard. 1990. Effect of particle size of sorghum grains
on feed intake and performance of young broilers. Poult. Sci. 69:2177-2184. 8. Ferket, P. 2000. Feeding whole grains to poultry improves gut health. Feedstuffs
72:12-24.
9. Nir, I., R. Hillel, G. Shefet, and Z. Nitsan. 1994. Effect of grain particle size on performance. 2. Grain texture interactions. Poult. Sci. 73:781-791.
10.Federation of Animal Science Societies. 1999. Guide for the Care and Use of
Agricultural Animals in Agricultural Research and Testing. 1st rev. ed. FASS, Savoy, IL.
36 12.National Research Council. 1994. Nutrient Requirements of Poultry. 9th rev. ed. Natl.
Acad. Sci., Washington, DC.
13.Master Model HD, California Pellet Mill Co.. Crawfordsville, IN.
14.Model 1522 Roskamp Chamption, California Pellet Mill Co.. Crawfordsville, IN. 15.Cubes, Pellets and Crumbles – Definitions and Methods for Determining Density,
Durability, and Moisture Content. ASAE S269.4 DEC1991. 16.Silicon Dioxide, model SSA-58, Gilson, Lewis Center, OH.
17.AOAC. 1995. Protein (Crude) in Animal Feed, Combustion, AOAC Official Method 990.03 A-D.
18.AOAC. 1995. Moisture in Animal Feed, Drying at 135º, AOAC Official Method 930.15.
19.AOAC. 1995. Fat (Crude) or Ether Extract in Animal Feed, AOAC Official Method 920.39.
20.ASAE. 1987. Wafers, pellets, and crumbles-definitions and methods for determine density, durability, and moisture content. Yearbook of Standards. P.325. American Society of Agricultural Engineers.
21.Stark, C.R. 1994. Effect of fat source and level on pellet quality in broiler feeds. Ph.D. Dissertation, Kansas State Univ., Manhattan.
22.Lemme, A., P. J. A. Wijtten, J. van Michen, A. Petri, and D. J. Langhout. 2006. Responses of male growing broilers to increasing levels of balanced protein offered as coarse mash or pellets of varying quality. Poult. Sci. 85:721-730.
23.Amerah, A. M., V. Ravindran, R. G. Lentle, and D. G. Thomas. 2007. Influence of feed particle size on the performance, energy utilization, digestive tract development, and digesta parameters of broiler starters. Poult. Sci. 86:2615-2623.
38 SUMMARY AND CONCLUSIONS
Results from our experiments have shown that feed manufacturing affected broiler performance. Previous research has shown that body weight (BW) and adjusted feed conversion (AdjFCR) improved due to manipulation of feed by the addition of supplemental fat or modifications to the feed form and particle size.
Fat supplementation has been used as a low cost alternative to generate high energy diets. Research studies on post pellet liquid application (PPLA) suggested the birds were able to adapt to lower energy diets by increased feed intake. In the present studies, BW and feed intake were not affected by fat supplementation in Experiment 1 or 2. However, Experiment 2, which used low energy diets, reported an improved AdjFCR of 1.80 overall when birds were fed the diets with over application of fat (120). These birds were consuming a diet that contained 400 kcal/kg less then birds in Experiment 1 overall. The lack of bird response to the supplemental fat in Experiment 1 suggests the broilers can adjust to their feed intake depending on the caloric value of the feed.
39 feed improved digestibility and provided balanced nutrition in each bite therefore reducing feed consumption but providing energy needed for BW gain. Overall, birds fed the finer particle size (300 microns) had an improved AdjFCR compared to the coarse particle size (600 microns). Interactions between feed form and particle size indicated the finer particle size improved AdjFCR in the mash diets, (1.94) compared to pelleted diets (2.12). Although the finer particle size resulted in improved broiler performance, the gizzard weight of the birds was smaller. Mash feed did produce a larger gizzard weight, but the pelleted fed birds had the higher BW as well as improved AdjFCR.
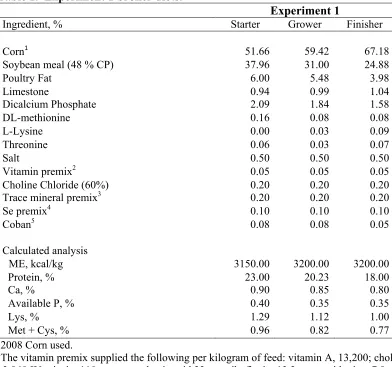
40 Table 1. Experiment 1 broiler diets.
Experiment 1
Ingredient, % Starter Grower Finisher
Corn1 51.66 59.42 67.18
Soybean meal (48 % CP) 37.96 31.00 24.88
Poultry Fat 6.00 5.48 3.98
Limestone 0.94 0.99 1.04
Dicalcium Phosphate 2.09 1.84 1.58
DL-methionine 0.16 0.08 0.08
L-Lysine 0.00 0.03 0.09
Threonine 0.06 0.03 0.07
Salt 0.50 0.50 0.50
Vitamin premix2 0.05 0.05 0.05
Choline Chloride (60%) 0.20 0.20 0.20
Trace mineral premix3 0.20 0.20 0.20
Se premix4 0.10 0.10 0.10
Coban5 0.08 0.08 0.05
Calculated analysis
ME, kcal/kg 3150.00 3200.00 3200.00
Protein, % 23.00 20.23 18.00
Ca, % 0.90 0.85 0.80
Available P, % 0.40 0.35 0.35
Lys, % 1.29 1.12 1.00
Met + Cys, % 0.96 0.82 0.77
1
2008 Corn used. 2
The vitamin premix supplied the following per kilogram of feed: vitamin A, 13,200; cholecalciferol, 3,960 IU; niacin, 110 mg; pantothenic acid 22 mg; riboflavin, 13.2 mg; pyridoxine, 7.9 mg;
menadion, 4 mg; folic acid, 2.2 mg; thiamin, 4 mg; and biotin, 0.25 mg. 3
The mineral premix supplies the following per kilogram of feed: Zn, 120 mg; Mn, 120 mg; Fe, 80 mg; Cu, 10 mg; I, 2.5 mg; Co, 1.0 mg.
4
Selenium premix provided 0.3 ppm Se. 5
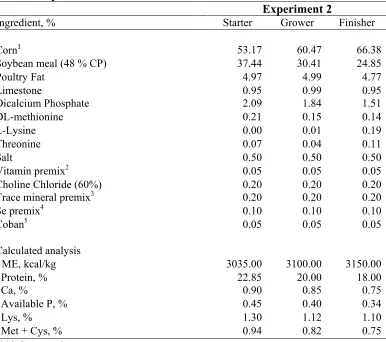
41 Table 2. Experiment 2 broiler diets.
Experiment 2
Ingredient, % Starter Grower Finisher
Corn1 53.17 60.47 66.38
Soybean meal (48 % CP) 37.44 30.41 24.85
Poultry Fat 4.97 4.99 4.77
Limestone 0.95 0.99 0.95
Dicalcium Phosphate 2.09 1.84 1.51
DL-methionine 0.21 0.15 0.14
L-Lysine 0.00 0.01 0.19
Threonine 0.07 0.04 0.11
Salt 0.50 0.50 0.50
Vitamin premix2 0.05 0.05 0.05
Choline Chloride (60%) 0.20 0.20 0.20
Trace mineral premix3 0.20 0.20 0.20
Se premix4 0.10 0.10 0.10
Coban5 0.05 0.05 0.05
Calculated analysis
ME, kcal/kg 3035.00 3100.00 3150.00
Protein, % 22.85 20.00 18.00
Ca, % 0.90 0.85 0.75
Available P, % 0.45 0.40 0.34
Lys, % 1.30 1.12 1.10
Met + Cys, % 0.94 0.82 0.75
12009 Corn used.
2The vitamin premix supplied the following per kilogram of feed: vitamin A, 13,200; cholecalciferol, 3,960 IU; niacin, 110 mg; pantothenic acid 22 mg; riboflavin, 13.2 mg; pyridoxine, 7.9 mg;
menadion, 4 mg; folic acid, 2.2 mg; thiamin, 4 mg; and biotin, 0.25 mg.
3The mineral premix supplies the following per kilogram of feed: Zn, 120 mg; Mn, 120 mg; Fe, 80 mg; Cu, 10 mg; I, 2.5 mg; Co, 1.0 mg.
42
Table 3. Actual crude fat and percent of target in Post Pellet Liquid Application (PPLA) Experiments 1 and 2.
Experiment 1 Experiment 2
Treatments1 Starter Grower Finisher Treatments1 Starter Grower Finisher
% %
80 80
Target 7.7 7.37 6.28 Target 6.82 6.99 6.91
Actual2 6.5 6.2 4.9 Actual2 5.1 5.4 5.9
% Target3 84 85 78 % Target3 74 77 86
ME, kcal/kg4 3055 3057 3041 ME, kcal/kg4 2899 2974 3070
100 100
Target 7.7 7.37 6.28 Target 6.82 6.99 6.91
Actual 7.9 7.4 6.2 Actual 7.2 7.0 7.0
% Target 103 101 98 % Target 106 101 101
ME, kcal/kg 3116 3202 3206 ME, kcal/kg 3065 3101 3157
120 120
Target 7.7 7.37 6.28 Target 6.82 6.99 6.91
Actual 9.6 8.9 7.2 Actual 7.9 8.3 8.2
% Target 124 121 115 % Target 116 119 119
ME, kcal/kg 3300 3321 3273 ME, kcal/kg 3120 3204 3252
Mixer
Target 6.82 6.99 6.91
Actual 5.8 6.1 7.4
% Target 84 87 107
ME, kcal/kg 2954 3030 3111
1Treatments consisted of feed that contained 80, 100, and 120% of the target fat by PPLA. The mix treatment contained feed 100% target fat that
was applied in the mixer prior to pelleting.
2Actual amount of fat that was applied to the feed.
3The percent of target that was obtained due to the actual amount of fat applied.
43
Table 4. Performance of broilers fed different levels of PPLA applied fat in Experiment 1.
BW1 AdjFCR2 FI3
14 d 35 d 45 d 0-14 d 0-35 d 0-45 d 0-14 d 0-35 d 0-45 d
Treatments4 g g:g g
80 486 2178 3154 1.38 1.63 1.82 672 3542 5730
100 489 2164 3155 1.37 1.62 1.77 671 3494 5589
120 493 2193 3183 1.38 1.65 1.82 683 3609 5803
Blended 493 2165 3153 1.40 1.63 1.81 689 3524 5726
SEM 8 29 50 0.02 0.01 0.02 8 49 96
Source of Variation
P-value 0.9504 0.8801 0.9695 0.8760 0.5165 0.3539 0.3180 0.4167 0.4725
1Body Weight (BW) at 14 d, 35 d, and 45 d.
2Feed Conversion Ratio adjusted for mortality (AdjFCR) for intervals 0-14 d, 0-35 d, and 0-45 d.
3Feed intake (FI) from 0-14 d, 0-35 d, and 0-45 d. 4
44
Table 5. Performance of broilers fed different levels of PPLA applied fat in Experiment 2.
BW1 AdjFCR2 FI3
14 d 35 d 42 d 47 d 0-14 d 0-35 d 0-42 d 0-47 d 0-14 d 0-35 d 0-42 d 0-47 d
Treatments1 g g:g g
80 353 2042 2766 3271 1.62a 1.67a 1.78a 1.86a 571 3402 4915 6097
100 355 2033 2749 3300 1.68b 1.68ab 1.78a 1.85a 596 3412 4893 6103
120 349 2007 2736 3301 1.61a 1.66a 1.74b 1.80b 564 3331 4761 5947
Mixer 352 1984 2699 3255 1.61a 1.70b 1.80a 1.87a 568 3388 4861 6099
SEM 5 19 21 29 0.02 0.01 0.01 0.01 9 35 43 49
Source of Variation
P-Value 0.9112 0.1314 0.1703 0.6206 0.0806 0.0210 0.0010 0.0021 0.0830 0.3816 0.0790 0.0869
a,bMeans within a column with different superscripts differ significantly (P ≤ 0.05). 1Body Weight (BW) of broilers at 14 d, 35 d, 42, d, and 47 d.
2Feed Conversion Ratio adjusted for mortality (AdjFCR) at intervals 0-14 d, 0-35 d, 0-42 d, and 0-47 d.
3Feed intake (FI) at 14 d, 35 d, 42 d and 47 d.
4Treatments consisted of feed that contained 80, 100, and 120% of target fat by PPLA. The mix treatment contained feed at 100% target fat that
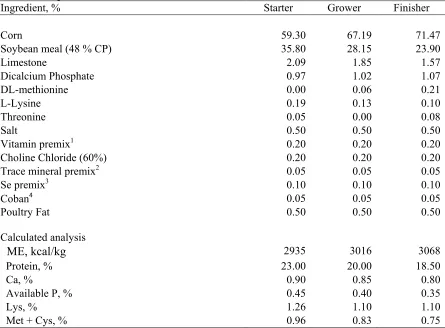
45 Table 6. The composition of the broiler basal starter, grower, and finisher for
Experiment 3.
Ingredient, % Starter Grower Finisher
Corn 59.30 67.19 71.47
Soybean meal (48 % CP) 35.80 28.15 23.90
Limestone 2.09 1.85 1.57
Dicalcium Phosphate 0.97 1.02 1.07
DL-methionine 0.00 0.06 0.21
L-Lysine 0.19 0.13 0.10
Threonine 0.05 0.00 0.08
Salt 0.50 0.50 0.50
Vitamin premix1 0.20 0.20 0.20
Choline Chloride (60%) 0.20 0.20 0.20
Trace mineral premix2 0.05 0.05 0.05
Se premix3 0.10 0.10 0.10
Coban4
0.05 0.05 0.05
Poultry Fat 0.50 0.50 0.50
Calculated analysis
ME, kcal/kg 2935 3016 3068
Protein, % 23.00 20.00 18.50
Ca, % 0.90 0.85 0.80
Available P, % 0.45 0.40 0.35
Lys, % 1.26 1.10 1.10
Met + Cys, % 0.96 0.83 0.75
1The vitamin premix supplied the following per kilogram of feed: vitamin A, 13,200; cholecalciferol, 3,960 IU; niacin, 110 mg; pantothenic acid 22 mg; riboflavin, 13.2 mg; pyridoxine, 7.9 mg;
menadion, 4 mg; folic acid, 2.2 mg; thiamin, 4 mg; and biotin, 0.25 mg
2The mineral premix supplies the following per kilogram of feed: Zn, 120 mg; Mn, 120 mg; Fe, 80 mg; Cu, 10 mg; I, 2.5 mg; Co, 1.0 mg
46
Table 7. Effect of feed form, particle size, and the interaction on BW of male and female broilers in Experiment 3.
a,b,cMeans within a column with different superscripts differ significantly (P ≤ 0.05).
1Treatments consist of mash diets with 300 and 600 microns particle size and pelleted diets with 300 and 600 microns particle size.
14 d 21 d 35 d 44 d
Male Female Male Female Male Female Male Female
Treatments1 g
Mash + 300 388 373a 772 720 1854 1588a 2739 2252
Mash + 600 358 347b 730 682 1799 1546a 2726 2227
Pellet + 300 470 452c 931 850 2222 1849b 3224 2629
Pellet + 600 454 443c 919 840 2209 1879b 3231 2603
SEM 5 4 10 7 28 17 38 27
Feed form
Mash 373a 360a 751a 701a 1827a 1567a 2733a 2239a
Pellet 462b 447b 925b 845b 2215b 1864b 3227b 2616b
SEM 5 4 8 6 20 12 26 19
Particle Size
300 429a 412a 851a 785a 2038 1718 2981 2440
600 406b 395b 824b 761b 2004 1713 2979 2415
SEM 12 12 24 19 54 41 70 53
Source of variation P-value
Form x Size 0.1451 0.0422 0.1634 0.0651 0.4576 0.0485 0.7886 0.9710
Feed form 0.0001 0.0001 0.0001 0.0001 0.0001 0.0001 0.0001 0.0001
47
Table 8. Effect of feed form, particle size, and the interaction on feed intake of broilers in Experiment 3.
a,b,cMeans within a column with different superscripts differ significantly (P ≤ 0.05).
1Treatments consist of mash diets with 300 and 600 microns particle size and pelleted diets with 300 and 600 microns particle size.
14 d 21 d 35 d 44 d
Treatments1 g
Mash + 300 1289 2540a 6198 a 9663 a
Mash + 600 1380 2845 b 6916 b 10443 b
Pellet + 300 1305 2724 bc 7028 b 10936 c
Pellet + 600 1300 2716 c 6960 b 10741 bc
SEM 25 43 94 142
Feed form
Mash 1334 2692 6557 a 10053 a
Pellet 1303 2720 6994 b 10839 b
SEM 19 41 93 122
Particle Size
300 1297 2632 a 6613 a 10299
600 1340 2780 b 6938 b 10592
SEM 18 36 101 155
Source of variation P-value
Form x Size 0.0613 0.0016 0.0004 0.0029
Feed form 0.2124 0.5356 0.0001 0.0001
48
Table 9. Effect of broilers feed form, particle size, and the interactions on adjusted feed conversion ratio (AdjFCR) in Experiment 3.
0-14d 0-21d 0-35d 0-44d
Treatments1 g:g
Mash + 300 1.69a 1.70a 1.80a 1.94a
Mash + 600 1.96b 2.01b 2.07b 2.11b
Pellet + 300 1.42c 1.53c 1.73c 1.87c
Pellet + 600 1.45c 1.54c 1.70c 1.84c
SEM 0.03 0.03 0.02 0.02
Feed form
Mash 1.83a 1.86a 1.93a 2.03a
Pellet 1.43b 1.54b 1.71b 1.85b
SEM 0.03 0.03 0.03 0.02
Particle Size
300 1.55a 1.62a 1.76a 1.90a
600 1.70b 1.78b 1.88b 1.97b
SEM 0.06 0.05 0.04 0.03
Source of variation P-value
Form x Size 0.0022 0.0001 0.0001 0.0001
Feed form 0.0001 0.0001 0.0001 0.0001
Particle Size 0.0002 0.0001 0.0001 0.0008
a,b,c,d
Means within a column with different superscripts differ significantly (P ≤ 0.05).
1
49 Table 10. Percentage fines and Pellet Durability Index (PDI) of the pelleted treatments
in Experiment 3.
P300 P600
Fines1 PDI2 Fines1 PDI2
Diets3 %
Starter 15 89.8 17 86.4
Grower 22 84.6 27 81.6
Finisher 6 87.2 8 84.0
1
Measured with a US No.5 sieve. 2
Pellet Durability Index (PDI) is measured as 500 g whole pellets, tumbled for 10 min, and then the amount of whole pellets left in g / 500 g of whole pellets.
3
50 Table 11. Effect of gizzard weight (g) and percentage gizzard in Experiment 3 at 44 d.
Gizzard
Treatments1 g2 g/100g BW3
M300 35.8a 1.45a
M600 38.1a 1.56b
P300 26.7b 1.05c
P600 33.6b 1.30d
P-Value
Source of Variation 0.0108 0.0387
1
Treatments consist of mash diets with 300 and 600 microns particle size and pelleted diets with 300 and 600 microns particle size.
2
Weight of gizzard in grams (g). 3