173
Predicting ESRD Risk via Supervised and Ensemble
Machine Learning Technique
Nipa Sarkar
1, Asha Rani Borah
2Department of Computer Science1,2, New Horizon College of Engineering1,2 Bangalore-560103, Karnataka, India
Email: [email protected], [email protected]
Abstract- Around 10% population of the world gets affected by kidney disorders or chronic kidney disorders and almost millions of them die every year. If this trend continues then it is assessed that the total number of cases of kidney disorder will rise excessively since it is a global health crisis. By implementing Machine Learning techniques, it is possible to detect the risk of ESRD End-Stage Renal Disease) in the prior stage and proper medication can reduce the percentage of the people suffering from the renal disease risk. This paper introduces the ensemble machine learning algorithm to predict the ESRD risk and helps in fasten the decision-making process of the doctors. The main purpose of this paper is to observe the accuracy score of various supervised machine learning model and finally use the ensemble technique to get the highest accuracy for predicting the ESRD risk. The intention behind this paper is to build a a non-invasive machine learning model that can predict the ESRD risk by using ESRD dataset which is established by gathering data from various ESRD patients generated through IOT sensors.
Index Terms- ESSRD; IOT sensors; Supervised; Ensemble.
1. INTRODUCTION
End stage renal disease is nothing but the final stage (5th stage) of the Chronic Kidney Disease. At this stage the patient’s kidney function only 10%-15% of their normal capacity. When the functionality of the kidneys is this low, it cannot remove toxic waste or fluids effectively from the body. At this condition dialysis or kidney transplant is mandatory to make the person alive. But dialysis being complicated procedure to perform due to its complex nature of conduction to every patient. It is also a challenging process due to segregation of maintenance & treatment structures. Symptoms of ESRD are: 1) Nausea, Vomiting and Loss of appetite and Fatigue and weakness. 2) Sleep problems and Changes in the quantity of urine. 3) Decreased mental sharpness and Muscle twitches and cramps. 4) Swelling of feet and ankles, Persistent itching, Chest pain, if fluid builds up around the lining of the heart and Shortness of breath, if fluid builds up in the lungs, High blood pressure (hypertension) that's difficult to control.
In this paper we will be using machine learning algorithms to predict the early stage renal diseases. the ensemble classifier will help in predicting the disease early stage. This will help the patients to take corrective measures upfront and reduce the chances of kidney failures. The main purpose of the paper is to develop non-invasive approach that can predict the probability of occurring a complication for ESRD dialysis patient. Risk prediction accuracy is the frequency of predicting the right state of the patient. This paper also provides a detailed information on the literature survey, proposed features, system details and various machine learning algorithms which provide the accuracy score of predicting ESRD risk correctly.
2. LITERATURE SURVEY
Two main fields are taken into consideration for discussing the ESRD risks- (1) dialysis and (2) machine learning algorithms. An inclusive depiction of the existing technology is deliberated in the following subsections which are connected with this paper work.
2.1 Dialysis Biomarkers
Biomarkers are biological markers which is used to make suitable information available for analyzing several risks of a patient. The National Health Institutes defines biomarker as a distinguishing measurable indicator using which a particular biological processes, pathogenic processes, pharmacologic responses, severity or existence. The kidneys of human body preserve constituency and amount of liquids in the body via regulatory system and balances water level, electrolytes, acidity etc. and controls the elimination of contaminants and unsolidified.[4]
2.2 Machine Learning Algorithms
174 measures upfront and reduce the chances of kidney
failures.
3. IMPLIMENTATION STEPS
The main objective is to:
1) Build a base line machine learning model that can predict the ESRD disease.
2) Validate model by using benchmarking models like Random Forest, Naïve Bayes, KNN to forecast the values.
3) Perform Grid search CV to identify the right set of parameters for the models.
4) Compare the accuracy of the models using K fold validation techniques.[1]
4. SYSTEM DETAILS
In the existing system, study is conducted on dialysis patient in ESRD. Patients are analysed in terms of biomarkers values. Based on datamining techniques, a modern data analytics environment is developed using python. The System design details describes about the models used for analysis, architecture required to build the models and the statistical concepts behind all the algorithms used.[1]
Fig. 1. System Architecture [1]
4.1 Machine Learning Model:
The model is simply a set of assumptions about dialysis biomarkers expressed in a probabilistic format. Starting with regression, a supervised learning model, the goal of regression is to predict the value of one or more continuous target variables b given the value of a D-dimensional vector d of input variables.
4.2 Machine Learning Parameters:
We start with a data set that is already labelled with biomarkers values (e.g., clearance). Given all the data sensors and other personal data (age, gender, race, height, smoking etc) expressed as N observations dn, where n=1...N, with corresponding target values bn, the model tries to learn a pattern that describes how much biomarkers value b are from a new data.
4.3 Machine Learning Learner:
These different types of information can be costly to process. With learner, we focus on processing data with machine learning algorithm at real-time.
Models constructed using individual classifiers are tend to have less accuracy. Models are not validated across different samples. Hence, if random samples are taking n, there is high chance of getting less accuracy. Enough priorities were not given for below techniques which can improve the accuracy of the models to the great extent-
1) Variable selection (Prioritization of Factors) 2) Feature engineer and Variable
transformations 3) Variable reductions
The proposed structure attempts to resolve the risk issues of ESRD. Solving the problem starts with identifying the right factors required for bug prediction. The prioritized factors are considered for creating analytical data set. As the ensemble classifiers are used, the model becomes a better choice for predictions. Validating the models with K-Fold cross validation technique results in the model effectively working for any kind of data. The proposed system will provide the following benefits- 1) Less Variance and Bias error 2) Better choice of variables through feature engineering and prioritization matrix and 3) High Accuracy for predicting the ESRD risk for new patients.[1]
Fig. 2. Machine Learning Model Flow
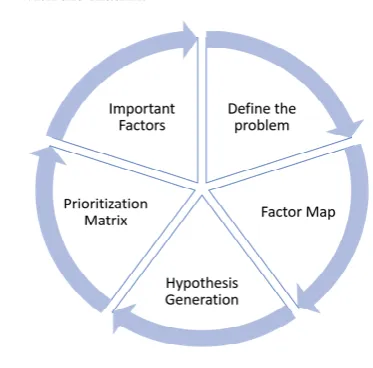
4.1 Problem solving framework
The first step of any machine learning model is understanding the problem and defining the problem better. Extraction of the data from multiple resource and performing operations using various algorithms is done in this step. Steps Involved are:
(1) Defining the problem: Define the current state and need for doing the problem.
(2) Factor Map: List down all the factors required for analyzing the problems.
175 (4) Prioritization Matrix: Identify the factors that
are based on actionability and feasibility matrix which leads to prioritize important factors.
(5) Important Factors: Prioritization matrix will help in analyzing the problems associated with the matrix.
Fig. 4. Problem Solving steps
4.4 Data preprocessing (Exploratory Data Analysis or EDA)
Data requires pre-processing which will help to get the right predictions. Propose System involved the below process of exploratory data analysis in sequential order: using measures of central tendency, forward fill, backward fill method.
4. Outlier Treatment: Treating the outliers that is not following the interquartile range properties.
5. Garbage Value Treatment: Eliminating the garbage value characters from the datasets. 6. Special Character Removal: Eliminating the
various special characters from the datasets. 7. Final Dataset: Creating the analytical ready
data set.
Fig. 3. Representation of Data preprocessing steps
4.5 Baseline model
Logistic regression is used as the baseline model. It is more likely to the Ordinary Least Squares (OLS) regression. As the bug prediction is a binary response variable, the bug behavior can be predicted by multiple algorithms. Logistic Regression fits an S-shaped curve to the data. The following steps can be done in Logistic Regression:
(1) Analytical dataset creation: Create the base data set required for the analysis.
(2) Train test split: Dividing the dataset in train and test for executing ML algorithms. (3) Baseline model’s creation: Construct the
baseline models with the given set of variables.
(4) Validating the performance of the models: Identify the Accuracy score, Confusion Matrix, Roc- AUC curve designing, Probability curve, Improving model performance and Defect Detection models.
Fig. 5. Logistic Regression curve
4.6 Benchmarking models
4.6.1 KNN
K-nearest neighbors’ algorithm (k-NN) is a non-parametric method used for classification and regression. In both cases, the input consists of the k of its k nearest neighbors.
4.6.2 Random Forest
176 4. Gini index
The origin of the decision tress is decided based on the above values. The root node starts with the one that has the highest information gain / entropy.
4.6.3 Naïve Bayes
Naive Bayes classifiers are a collection of classification algorithms based on Bayes’ Theorem. It is not a single algorithm but a family of algorithms where all of them share a common principle, i.e. every pair of features being classified is independent of each other. Naive Bayes system model is simple to build and predominantly suitable for very huge data sets. Along with effortlessness and simplicity, Naive Bayes is well known for outperforming highly erudite classification methods.
Bayes theorem presents an easy method of calculating posterior probability P(c|x) from P(c), P(x) and P(x|c). The equation is represented below:
4.6.3 Ensemble Techniques
Ensemble methods, which combines several decision trees to produce better predictive performance than utilizing a single decision tree. The main principle behind the ensemble model is that a group of weak learners come together to form a strong learner.
Bagging: Bagging (Bootstrap Aggregation) is used when our goal is to reduce the variance of a decision tree. Here idea is to create several subsets of data from training sample chosen randomly with replacement. Now, each collection of subset data is used to train their decision trees. As a result, we end up with an ensemble of different models. Average of all the predictions from different trees are used which is more robust than a single decision tree.
Boosting: The term 'Boosting' refers to a family of algorithms which converts weak learner to strong learners. To convert weak learner to strong learner, we'll combine the prediction of each weak learner using methods like: 1) Using average or the weighted average 2) Considering prediction has higher vote. XGBoosting: XGBoost is an ensemble learning method. Sometimes, it may not be sufficient to rely upon the results of just one machine learning model.
Ensemble learning offers a systematic solution to combine the predictive power of multiple learners. The resultant is a single model which gives the aggregated output from several models. The models that form the ensemble, also known as base learners, could be either from the same learning algorithm or different learning algorithms. Bagging and boosting are two widely used ensemble learners. Though these two techniques can be used with several statistical models, the most predominant usage has been with decision trees.
4.7 Model Validation
4.7.1 K fold validation
K-Fold Cross Validation method is a common type of cross validation technique that is widely used in machine learning.
The general procedure is as follows: 1) Shuffle the dataset randomly. 2) Split the dataset into k groups.
3) For each unique group, take the group as a hold out or test data set.
4) Take the remaining groups as a training data set.
5) Fit a model on the training set and evaluate it on the test set.
6) Retain the evaluation score and discard the model.
7) Summarize the skill of the model using the sample of model evaluation scores.
4.7.2 Grid search CV
Grid search technique is used to find the best combination of hyper-parameters for a given model and test dataset. In this scenario, there are several models, each with a different combination of hyper-parameters. Each of these combinations of parameters, which correspond to a single model, can be said to lie on a point of a "grid". The goal is to train each of these models and evaluate them using cross-validation. Selection is done based on the performance.
5. CONCLUSION
Machine Learning Application in End-Stage Renal Disease Risk Prediction or ESSRD risk prediction requires various connected objects and these are the main keys for various intelligent structures for illustration. This paper intents to develop a non-invasive approach that predict various risks of dialysis patient in End-Stage Renal Disease (ESRD). In this paper, we propose various machine learning techniques to build a model for gathering various data under the data analytics environment which can predict the occurrence of ESRD disease by using the ESRD data generated from various IOT Sensors [1].
177 an input to the training process, our proposed
approach classify the ESRD risk as Positive and Negative and helps in faster decision making by the doctors. The work of proposed model has gone through preprocessing stage and classifiers learning stage. For analytical evaluation of the proposed classifier accuracy and f-measure are used. The comparative results prove that hybrid model improved the overall classification accuracy and f-measure of ESRD risk prediction as compared to traditional existing techniques for classification.
REFERENCES
[1] Nipa Sarkar, and Asha Rani Borah.” End-Stage Renal Disease Risk Prediction via Machine Learning and IoT”, International Journal of Research in Advent Technology, Vol.6, No.11, November 2018
[2] Dileep Kumar G “Chapter-1 Tree based modelling techniques: IGI GLOBAL,2019. [3] Dejun Mu, Junhong Duan, Xiaoyu Li,Hang Dai,
Xiayan Cai, Latin Guo. “Expede Herculem: Learning Multi Labels from Single Label”, IEEE Acess, 2018.
[4] Roy, Sandip Kumar, and Preeta Sharan. "Application of Machine Learning For Real-time Evaluation of Salinity (or TDS) in Drinking Water Using Photonic Sensor", Drinking Water Engineering and Science Discussions, 2016. [5] Han Feng. "The application of artificial
intelligence in electrical automation control", Journal of Physics: Conference Series, 2018. [6] The International Conference on Advanced
Machine Learning Technologies and Applications(AMLTA2018)", Springer Nature, 2018.
![Fig. 1. System Architecture [1]](https://thumb-us.123doks.com/thumbv2/123dok_us/732716.1082812/2.595.318.513.408.599/fig-system-architecture.webp)