Deep Learning Methods On Neutron Scattering
Data
Guanghan SONG
∗, Lionel PORCAR, Martin BOEHM, Franck CECILLON, Charles DEWHURST
Yannick LE GOC, J´erome LOCATELLI, Paolo MUTTI
†and Tobias WEBER
Institut Laue-LangevinGrenoble, France
Email:∗[email protected],†[email protected]
Abstract—Recently, by using deep learning methods, a com-puter is able to surpass or come close to matching human perfor-mance on image analysis and recognition. This advanced methods could also help extracting features from neutron scattering experimental data. Those data contain rich scientific information about structure and dynamics of materials under investigation. Deep learning could help researchers better understand the link between experimental data and materials properties. Moreover,it could also help to optimize neutron scattering experiment by predicting the best possible instrument configuration. Among all possible experimental methods, we begin our study on the small-angle neutron scattering (SANS) data and by predicting the structure geometry of the sample material at an early stage. This step is a keystone to predict the experimental parameters to properly setup the instrument as well as the best measurement strategy. In this paper, we propose to use transfer learning to retrain a convolutional neural networks (CNNs) based pre-trained model to adapt the scattering images classification, which could predict the structure of the materials at an early stage in the SANS experiment. This deep neural network is trained and validated on simulated database, and tested on real scattering images.
Index Terms—artificial intelligence, deep learning, convolu-tional neural network, transfer learning, small-angle neutron scattering
I. INTRODUCTION
The fundamental properties of the neutron make it a pow-erful tool to investigate atomic-scale structure and dynamics of materials. Compared to other scattering techniques such as x-ray or light, neutron has advantages such as negligible radiation damage, exceptional penetration power and ability to selectively highlight specific parts of materials via isotope labelling [1]. However, because the flux of neutrons is lower than the flux of the photons at modern light sources, long measurement time (even tens of hours) is required for a high-quality data collection. In this case, early decision becomes a critical component in the experimental work flow. On the other hand, the instrument settings of neutron scattering experiments are manually decided by scientists according to their experi-ences and knowledges. Due to large differexperi-ences in the level of experience of the different users, high quality data could become difficult to obtain and quite time consuming. Hence, we propose to use recent advanced machine learning methods to help interpreting experimental data in order to optimize effective use of limited beam time and ence increasing science productivity.
Small-angle neutron scattering (SANS) is an increasingly popular method in structural biology that usefully comple-ments high-resolution structural techniques such as x-ray crystallography or nuclear magnetic resonance spectroscopy [2]. Over time, many methods have been developed to extract relevant information directly from the experimental scattering intensities, working exclusively with the experimentally ob-tained data. Inthi work, we consider the application of machine learning methods to extract sample structural information from SANS data.
Deep learning has become one of the most active research field in the machine learning community since it was presented in 2006 [3]. Recently, it impacted deeply data science, and its popularity has grown exponentially, especially in computer vision related tasks [4]. Convolutional neural networks (CNNs) is a well-known deep learning architecture inspired by the natural visual perception mechanism of the living creatures. In recent years, CNNs have been widely adopted for a variety of applications in image classification [5] [6], video analysis [7] and natural language processing [8]. CNNs are widely used in image related tasks since they present several advantages. Firstly, CNNs decompose images into multiple patches that are partially overlapped. In this case, each cortex neuron only corresponds to a single patch, which enables the network to classify images with little data pre-processing [9]. Secondly, CNNs are weight sharing, which enable CNNs share learned features from a single sample via back-propagation with other samples. It efficiently decreases the necessary required input sample size and quantity. [10].
larger and similar to the source data sets then the chance of over fitting is low and it requires only the fine tuning of the pre-trained model [12].
In this paper, we applied transfer learning method on a CNNs architecture based pre-trained model, to analyze and classify neutron scattering image from SANS experiment. This model named Inception-v3 is pre-trained on ImageNet database. With fine-tuning, this model is first retrained and validated by simulated scattering images, then verified on real SANS experimental data collected at the Institut Laue-Langevin (ILL).
II. METHODS
A. Data simulation
To generate two-dimensional Small-Angle Neutron Scatter-ing (SANS) images we use the data reduction and simulation code GRASP [13] . GRASP is a MatlabTM script application designed for the graphical inspection, analysis and reduction of position sensitive detector(PSD) data produced by the 3 SANS instruments of the ILL. GRASP is using a mixed analitical and Monte-Carlo approach for the neutron event generetion and can include the real intrument resolution function, the measured backgrounds from a variety of different samples and the influence of the sample environment. By using GRASP, we could generate simulated SANS 2D detector images with vari-able sets of parameters. We could select different materials’ structures and also freely change the instrument configuration. In this work we have choosen D22 SANS instrument and its schematic layout is presented in Fig. 1
Fig. 1: Schematic representation the steady-state instrument D22 at the Institut Laue-Langevin [2].
Starting from a cold neutron beam arising from the H512 neutron guide, the desired neutronwavelengthcan be selected through a mechanical velocity selector in a range between 4.6 and 40 ˚A. The wavelength spread∆λ/λis 10% (FWHM). The virtual source-to-sample distance is chosen by a collimation system consisting of eight sections. Each section comprises three tubes, any one of which can be positioned on the beam axis. One tube contains a neutron guide of 40 x 55 mm; the second is equipped with an antiparasitic aperture; the third tube bears fixations for future neutron-optical equipment. D22 possesses a large 3He multidetector with an active area of 1 m2. The detector is subdivided in pixels with a size of 8 x 8 mm. The detector consists of 128 linear sensitive Reuter-Stokes tubes arranged vertically with a spacing of 8 mm. Each
tube has a dead time of about 1 s roughly corresponding to the analog pulse shaping time. It moves inside a 2.5 m wide and 20 m long vacuum tube providing sample-to-detector distances from 1.1 m to 17.6 m. D22 thus covers a total q range of 4 x 10⁻⁴ to 0.44 ˚A−1 (no detector offset) or 0.85 ˚A−1 (with detector offset) in standard conditions.
A large amounts of SANS diffusion patterns were obtained from samples with geometrical structure and uniform scat-tering length density such as spheres, cylinders, core-shell spheres, ellipsoid and flux line bragg peak. The corresponding dimensions of the geometric bodies, i.e., inner and outer radius, length, width, height etc., were respectively randomly and independently sampled in ranges from 10 to 800 ˚A. Each instrument configuration of D22 such as sample to detector distance, collimation distance, wavelength bands introduces unique features in the resulting detector images. In our sim-ulation, the sample is inserted in an empty cell filled with background liquid: water (H2O) or heavy water (D2O).
B. Neural Network Model
In this paper, we have adopted transfer learning using the pre-trained CNNs based Inception-v3 [14] architecture to classify the 2-D neutron scattering images. Instead of creating a model from scratch, we have started from a previously trained model able to solve a similar classification problem. This model was known to classify an image across 1000 categories supplied by the ImageNet academic competition with an error rate that approached human performance. The Inception deep convolutional architecture was introduced as GoogLeNet (Inception-v1) [15]. Since Inception networks are fully convolutional, each weight corresponds to one multi-plication per activation. Therefore, by introducing factorizing convolutions in this model, Inception-v3 is able to reduce the number of connections/parameters (42-layer deep learning network) and similar complexity as VGGNet [16], without decreasing the network efficiency. Inception-v3 is a commonly used architecture for deep learning tasks. This model is a state-of-the-art CNNs and it is widly use in the field of computer vision. It consists of two parts:
• Feature extraction part with a CNN.
• Classification part with fully-connected and softmax lay-ers.
The pre-trained Inception-v3 model achieves state-of-the-art accuracy for recognizing general objects with 1000 classes. The model extracts general features from input images in the first part and classifies them based on those features in the second part. The model itself is made up of symmetric and asymmetric building blocks, including convolutions, average pooling, max pooling, concats, dropouts, and fully connected layers. BatchNorm is used extensively throughout the model and applied to activation inputs. Loss is computed via Softmax. In transfer learning, when we build a new model to classify our original dataset, we reuse the feature extraction part and re-train the classification part with our dataset. Since we don’t have to train the feature extraction part, which is the most complex part of the model, we can train the model with less
Fig. 2: Schematic diagram of Inception-v3 with transfer learning.
computational resources and training time. The work flow of Inception-v3 model with transfer learning is shown in Fig.2.
III. EXPERIMENTAL RESULTS
The small angle neutron scattering instrument D22 is used to investigate a wide range of samples, to identify their atomic structure and composition. Hence, we classify the samples with a 2-D scattering image at an early stage and then, we tried to predict its structure. We have started to consider four different geometrical structures: sphere, core-shell sphere, cylinder and ellipsoid, which procuce a quite similar scattering patterns. All the simulations are performed on a Linux Server (Ubuntu 16.04.5) with two NVIDIA Tesla P100 GPUs.
A. Experiment I: sphere vs. flux line bragg peak
Spheres and flux-line bragg peak produce quite different images on the detector. Unfortunately, in real experiments, the instrument parameters are set according to a ”guess” of the structure type and sample parameters, which sometimes are far away from the real structure. Hence,we first try to recognize the scattering image at an early stage without any priori knowledge.
1) Dataset: By using GRASP, we have generated 2000 sample images are generated respectively for the sphere and flux line bragg peak model. The corresponding dimensions of the geometric bodies, i.e., radius for sphere, rocking angle for flux line bragg peak etc. are generated in a certain range randomly and independently. Fig.3 shows some examples in this database, and a square beam stop is applied in the center of detector. As shown in Fig.3, because of data collection time is not long enough or the parameters setting of the instrument are not always perfect, to obtain a high quality scattering images is not easy for further analysis.
2) Result: We begin the training trail with the pre-trained model Inception-v3. The initial weights are taken from the pre-trained weights based on ImageNet. Only the weights of the
(a) sphere: centralized (b) sphere: low resolution
(c) flux line bragg peak:
centralized (d) flux line bragg peak:low resolution Fig. 3: Simulated database examples of experiment I
attached dense layers are updated. It means all layers are set to frozen except the last dense layer. The model is compiled with binary cross-entropy loss function for the training and validation sets. The initial learning rate is randomly set to 0.01 and the model is trained for 300 epochs, which means the network examined each image 300 times. For each training trail, 80% data are selected randomly for training, 10% data are used for testing and 10% data are used for validation.
Fig.4 shows the average accuracy of classification and loss of cross-entropy. After 200 epochs, the average accuracy is stable to 100%, which indicates all the simulated samples in the dataset are corrected classified by current classifier.
(a) average accuracy
(b) cross entropy
Fig. 4: Validation accuracy of experiment I.
material silica sphere from real experiment shown in Fig.5. All the images are correctly recognized with 99% confidence.
Fig. 5: Scattering image from real experiment of a silica sphere structure.
B. Experiment II: sphere vs. core-shell sphere vs. cylinder vs. ellipsoid
The four models: sphere, core-shell sphere, cylinder and ellipsoid geometrically are similar to each other under some particular parameters in the structure. For example, if the model cylinder with length 0, it becomes a sphere model. Recognizing these four structures only from scattering image is a challenge task.
1) Dataset: 10000 simulated scattering images are gen-erated by GRASP,for each individual sample structure. The corresponding dimensions of the geometric bodies, i.e., length, inner and outer radius etc. are generated randomly and inde-pendently. The dataset contains complex situation of the mod-els, including monodispersity, polydispersity, low resolution, centralized scattering images etc...
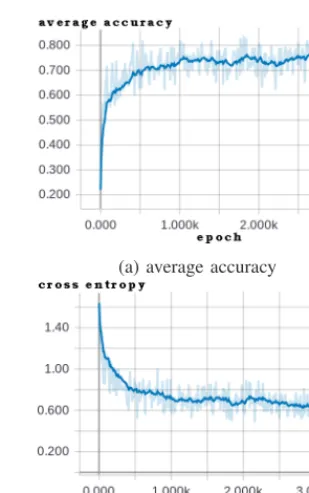
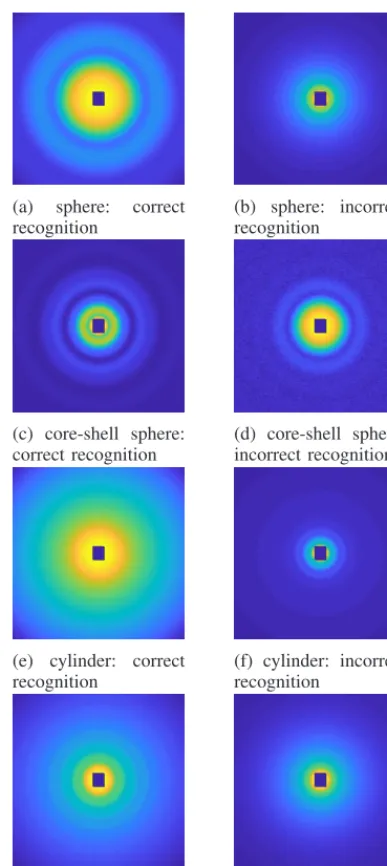
2) Result: The same pre-trained model as experiment I is applied. Fig.6 shows the results of average accuracy and loss of cross entropy. As a result of an average accuracy of 73%, the most incorrect and correct classification images are shown in Fig.7.
(a) average accuracy
(b) cross entropy
Fig. 6: Validation accuracy of experiment II.
We have employed data augmentation and fine-tuning meth-ods to improve the recognition accuracy. The model is opti-mized by stochastic gradient descent optimizer [17], which restarts techniques to find an optimal learning rate. Optimal learning rate finder is basically boosts the learning rate until the validation loss stops to decrease. Because of limited field of view of the instrument, in real experiment, sometimes we choose to make the neutron beam arrival at the detector with a certain bias from the center, to obtain a larger field of view of the material structure. 2000 simulated scattering images with beam stream arrival with certain bias from the center are added respectively to each class. Fig.8 shows two scattering samples in this kind of scattering data.
(a) average accuracy
(b) cross entropy
Fig. 4: Validation accuracy of experiment I.
material silica sphere from real experiment shown in Fig.5. All the images are correctly recognized with 99% confidence.
Fig. 5: Scattering image from real experiment of a silica sphere structure.
B. Experiment II: sphere vs. core-shell sphere vs. cylinder vs. ellipsoid
The four models: sphere, core-shell sphere, cylinder and ellipsoid geometrically are similar to each other under some particular parameters in the structure. For example, if the model cylinder with length 0, it becomes a sphere model. Recognizing these four structures only from scattering image is a challenge task.
1) Dataset: 10000 simulated scattering images are gen-erated by GRASP,for each individual sample structure. The corresponding dimensions of the geometric bodies, i.e., length, inner and outer radius etc. are generated randomly and inde-pendently. The dataset contains complex situation of the mod-els, including monodispersity, polydispersity, low resolution, centralized scattering images etc...
2) Result: The same pre-trained model as experiment I is applied. Fig.6 shows the results of average accuracy and loss of cross entropy. As a result of an average accuracy of 73%, the most incorrect and correct classification images are shown in Fig.7.
(a) average accuracy
(b) cross entropy
Fig. 6: Validation accuracy of experiment II.
We have employed data augmentation and fine-tuning meth-ods to improve the recognition accuracy. The model is opti-mized by stochastic gradient descent optimizer [17], which restarts techniques to find an optimal learning rate. Optimal learning rate finder is basically boosts the learning rate until the validation loss stops to decrease. Because of limited field of view of the instrument, in real experiment, sometimes we choose to make the neutron beam arrival at the detector with a certain bias from the center, to obtain a larger field of view of the material structure. 2000 simulated scattering images with beam stream arrival with certain bias from the center are added respectively to each class. Fig.8 shows two scattering samples in this kind of scattering data.
Table. I shows the average precision, sensitivity (recall), and F1-Score of the model with fine-tuning and augmented database. The average accuracy of this model is 79.8%, which is better than the performance of the model without fine-tuning. Except class unknown, the other four classes have proximity F1-score (between 75% and 80%). This unknown class is consisted of scattering images generated from sim-ulated program, without or less recording useful scattering information by improper instrument parameters setting. For cylinder, the precision is high 90%, which is the ratio of correctly predicted positive observations to the total predicted positive observations, meanwhile the sensitivity is low 65%, which is the ratio of correctly predicted positive observations
(a) sphere: correct
recognition (b) sphere: incorrectrecognition
(c) core-shell sphere:
correct recognition (d) core-shell sphere:incorrect recognition
(e) cylinder: correct
recognition (f) cylinder: incorrectrecognition
(g) ellipsoid: correct
recognition (h) ellipsoid: incorrectrecognition Fig. 7: Display of correctly and incorrectly classified images.
(a) sphere (b) cylinder
Fig. 8: Example of simulated scattering images with center bias of the neutron beam arrival.
to the all observations in actual class, turns out similar F1-score with other classes.
TABLE I: The average precision, sensitivity, F1-Score on the model with fine-tuning.
Classes Precision(%) Sensitivity(%) F1-Score(%)
Core-Shell Sphere 75 75 75
Cylinder 90 65 75
Ellipsoid 76 83 79
Sphere 70 85 77
Unknown 92 91 92
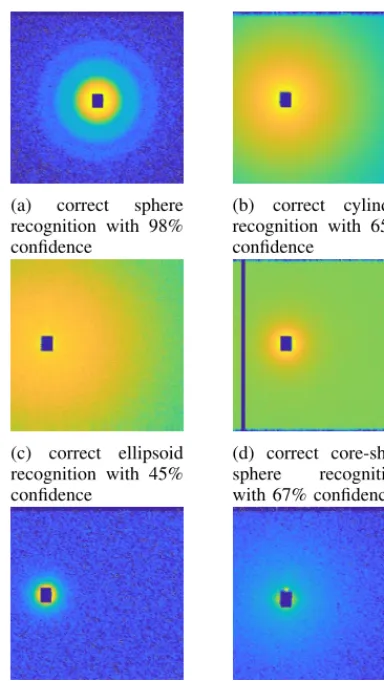
Then, this classifier is tested on 9 silica sphere scattering image, 9 cylinder scattering image, 2 ellipsoid scattering image and 1 core-shell sphere scattering image from real experiment. The scattering images from real experiment are raw data, without any pre-process. The most incorrect and correct classification images are shown in Fig.9. In 9 silica sphere real scattering images, 8 image are recognized as sphere with an average confidence value of 92%. As shown in Fig.9e, the incorrect classification happened on the image with less scattering information comparing to correct classifications. For cylinder class, only 3 images are correctly recognized with an average confidence 63%. In the rest 6 images with misclassification, 5 images are similar to Fig.9f. It seems with scattering images which contain the scattering information from the whole directions, that means the neutron beam arrived in the center of detector obtain higher recognition rate than scattering images with center bias of neutron beam arrivals. And for the images which contain only little information around beam stop, it seems difficult to recognize among these four structures.
IV. DISCUSSION & CONCLUSIONS
In this article, we introduced a deep learning based method to recognize material’s structure category by its 2-D neu-tron scattering image. The performance of accuracy is quite depending on the similarity among the material’s structure. As shown in experiment I (secton. III-A), the classifier is able to separate structure model with high accuracy between sphere and flux line bragg peaks even in low resolution, less scattering information, and low neutron beam intensity scattering images. However to predict the scattering images from close geometrical structures, such as sphere, core-shell sphere, cylinder and ellipsoid, the accuracy of our classifier decreased. From observation, the accuracy is influenced by the quality and type of scattering images. For example, the classifier could get higher accuracy on high resolution rather than low resolution scattering images. Also it performs better on scattering images with neutron beam arrival at the center of detector which contain scattering information in all directions rather than with center bias scattering images for which part of the information is missing.
(a) correct sphere recognition with 98% confidence
(b) correct cylinder recognition with 65% confidence
(c) correct ellipsoid recognition with 45% confidence
(d) correct core-shell sphere recognition with 67% confidence
(e) incorrect sphere
recognition (f) incorrect cylinderrecognition Fig. 9: Display of scattering images from real experiment with correct and incorrect recognitions.
among of scattering images from real experiment, we couldn’t get solid conclusion about the performance of our classifier. However, the result indicates the tendency that our classifier is able to correctly recognize real scattering images without any training samples from real scattering data, it could work equally on simulated and real images.
REFERENCES
[1] T. Zemb and P. Lindner,Neutrons, X-rays and light: scattering methods applied to soft condensed matter. North-Holland, 2002.
[2] I. Grillo, “Small-angle neutron scattering and applications in soft con-densed matter,”Soft matter characterization, pp. 723–782, 2008. [3] J. Schmidhuber, “Deep learning in neural networks: An overview,”
Neural networks, vol. 61, pp. 85–117, 2015.
[4] S. Lathuili`ere, P. Mesejo, X. Alameda-Pineda, and R. Horaud, “A com-prehensive analysis of deep regression,” IEEE transactions on pattern analysis and machine intelligence, 2019.
[5] A. Krizhevsky, I. Sutskever, and G. E. Hinton, “Imagenet classification with deep convolutional neural networks,” inAdvances in neural infor-mation processing systems, 2012, pp. 1097–1105.
[6] U. R. Acharya, S. L. Oh, Y. Hagiwara, J. H. Tan, and H. Adeli, “Deep convolutional neural network for the automated detection and diagnosis of seizure using eeg signals,”Computers in biology and medicine, vol. 100, pp. 270–278, 2018.
[7] A. Karpathy, G. Toderici, S. Shetty, T. Leung, R. Sukthankar, and L. Fei-Fei, “Large-scale video classification with convolutional neural networks,” inProceedings of the IEEE conference on Computer Vision and Pattern Recognition, 2014, pp. 1725–1732.
[8] Y. Kim, “Convolutional neural networks for sentence classification,” arXiv preprint arXiv:1408.5882, 2014.
[9] A. Krizhevsky, I. Sutskever, and G. E. Hinton, “Advances in neural information processing systems,” Curran Associates, Inc, pp. 1097– 1105, 2012.
[10] H. Tang, A. M. Scaife, and J. Leahy, “Transfer learning for radio galaxy classification,”arXiv preprint arXiv:1903.11921, 2019.
[11] S. Khan, N. Islam, Z. Jan, I. U. Din, and J. J. C. Rodrigues, “A novel deep learning based framework for the detection and classification of breast cancer using transfer learning,”Pattern Recognition Letters, 2019. [12] A. Kaya, A. S. Keceli, C. Catal, H. Y. Yalic, H. Temucin, and B. Tekin-erdogan, “Analysis of transfer learning for deep neural network based plant classification models,”Computers and Electronics in Agriculture, vol. 158, pp. 20–29, 2019.
[13] “Grasp,” https://www.ill.eu/fr/users-en/scientific-groups/large-scale-structures/grasp/, institut Laue-Langevin.
[14] C. Szegedy, V. Vanhoucke, S. Ioffe, J. Shlens, and Z. Wojna, “Rethinking the inception architecture for computer vision,” inProceedings of the IEEE conference on computer vision and pattern recognition, 2016, pp. 2818–2826.
[15] C. Szegedy, W. Liu, Y. Jia, P. Sermanet, S. Reed, D. Anguelov, D. Erhan, V. Vanhoucke, and A. Rabinovich, “Going deeper with convolutions,” inProceedings of the IEEE conference on computer vision and pattern recognition, 2015, pp. 1–9.
[16] K. Simonyan and A. Zisserman, “Very deep convolutional networks for large-scale image recognition,”arXiv preprint arXiv:1409.1556, 2014. [17] M. Talo, U. B. Baloglu, ¨O. Yıldırım, and U. R. Acharya, “Application
![Fig. 1: Schematic representation the steady-state instrumentD22 at the Institut Laue-Langevin [2].](https://thumb-us.123doks.com/thumbv2/123dok_us/8119489.1353027/2.625.43.289.427.531/schematic-representation-steady-state-instrumentd-institut-laue-langevin.webp)
![Fig. 1: Schematic representation the steady-state instrumentD22 at the Institut Laue-Langevin [2].](https://thumb-us.123doks.com/thumbv2/123dok_us/8119489.1353027/3.625.324.536.310.539/schematic-representation-steady-state-instrumentd-institut-laue-langevin.webp)