Available Online atwww.ijcsmc.com
International Journal of Computer Science and Mobile Computing
A Monthly Journal of Computer Science and Information Technology
ISSN 2320–088X
IJCSMC, Vol. 4, Issue. 4, April 2015, pg.580 – 585
RESEARCH ARTICLE
Comparison of Classification Algorithms on Dataset
of Sensor Based Wireless Gait Analysis System
Sibel Bakbak
1¹Süleyman Demirel University, Graduate School of Natural and Applied Sciences, Department of Mechanical Engineering, Isparta, Turkey
Abstract— Gait analysis systems have recently been promising tools to aid the clinician to diagnose as well as prognosis of diseases that disturbs the gait of the patient. In this study, dataset of a previously designed custom-made gait analysis system is used to end up with a clinical decision support system. The custom-made gait analysis system is equipped with accelerometer, gyroscope, bend sensor, and force sensors, and by means of these sensors, twenty-two gait parameters are calculated and the dataset used in this study are composed. The contribution of this paper is a comprehensive comparison of pattern recognition algorithms to differentiate hemiplegic patients from the healthy individuals. The results of this study showed the success of k-nearest neighbour algorithm with Principal Component Analysis (PCA) and without PCA by a classification performance of 80%.
Keywords— Gait recognition, support vector machines, k-nearest neighbour, principal component analysis, classification tree, clinical decision support system, inertial sensors
I. INTRODUCTION
Gait analysis systems has various areas of application like human identification [1]-[2], determining the risk of fall [3], assessment of human body kinematics and kinetics [4], determination of some neurological diseases [5]-[7], tracking the improvement of the patient after orthopaedic operations [8]. These systems can be video camera systems, pressure-sensor equipped mats and treadmill systems which are all laboratory dependent. In the recent years the body-worn systems are more popular because of their laboratory independent, cost-effective, calibration free characterizations [9] –[12].
Gait analysis is a very useful technique in determining some neurological diseases affecting gait and assess the improvement during the physical rehabilitation period. The clinicians diagnose the patients based on their experiences in qualitative and subjective ways. Gait analysis provides them to make objective diagnosis and judgement about the progression of the diseases by means of quantitative methods.
classification of spastic hemiplegia and other diseases is also performed and consistent types of kinematic patterns to differentiate the spastic hemiplegia is characterized with SVM are reported. [23].
In this study, three recognition algorithms are compared to see their success in order to discriminate hemiplegic patients from the healthy individuals.
II. MATERIALS AND METHODS
The dataset that is used in this study is obtained from the custom- made gait analysis system equipped with a 3-d accelerometer, 3-d gyroscope, four force sensitive resistors (FSR) and a bend sensor. The FSR and bend sensor is installed in the shoe insole, while the accelerometer and the gyroscope are mounted at the back of the shoe under the ankle. The raw data transmission of the gait analysis is shown in Fig 1.
Fig 1. Raw data transmission of the gait analysis system
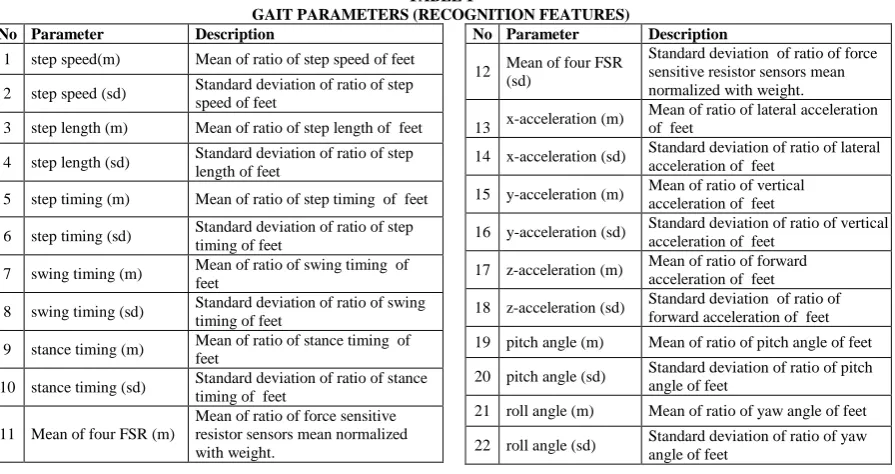
The raw data obtained from the hardware is processed in gait analysis system software and twenty-two gait parameters are computed. In Table 1, the gait parameters which are also features of dataset used in the recognition analysis are given. The (m) and (sd) are the notations for mean and standard deviation respectively. The gait tests are performed with healthy individuals and hemiplegic patients on a straight line walking path. Ten healthy individual and ten hemiplegic patients gait cycles are recorded and the raw data is processed with the gait analysis system. Three pattern recognition algorithms are performed on the dataset to compare the classification success of the algorithms in differentiating the hemiplegic patients from the healthy individuals by means of their gait parameters.
TABLE 1
GAIT PARAMETERS (RECOGNITION FEATURES) No Parameter Description
1 step speed(m) Mean of ratio of step speed of feet 2 step speed (sd) Standard deviation of ratio of step
speed of feet
3 step length (m) Mean of ratio of step length of feet 4 step length (sd) Standard deviation of ratio of step
length of feet
5 step timing (m) Mean of ratio of step timing of feet 6 step timing (sd) Standard deviation of ratio of step timing of feet 7 swing timing (m) Mean of ratio of swing timing of
feet
8 swing timing (sd) Standard deviation of ratio of swing timing of feet
9 stance timing (m) Mean of ratio of stance timing of feet 10 stance timing (sd) Standard deviation of ratio of stance
timing of feet 11 Mean of four FSR (m)
Mean of ratio of force sensitive resistor sensors mean normalized with weight.
No Parameter Description
12 Mean of four FSR (sd)
Standard deviation of ratio of force sensitive resistor sensors mean normalized with weight. 13 x-acceleration (m)
Mean of ratio of lateral acceleration of feet
14 x-acceleration (sd) Standard deviation of ratio of lateral acceleration of feet
15 y-acceleration (m) Mean of ratio of vertical acceleration of feet
16 y-acceleration (sd) Standard deviation of ratio of vertical acceleration of feet
17 z-acceleration (m) Mean of ratio of forward acceleration of feet 18 z-acceleration (sd) Standard deviation of ratio of
forward acceleration of feet 19 pitch angle (m) Mean of ratio of pitch angle of feet 20 pitch angle (sd) Standard deviation of ratio of pitch
angle of feet
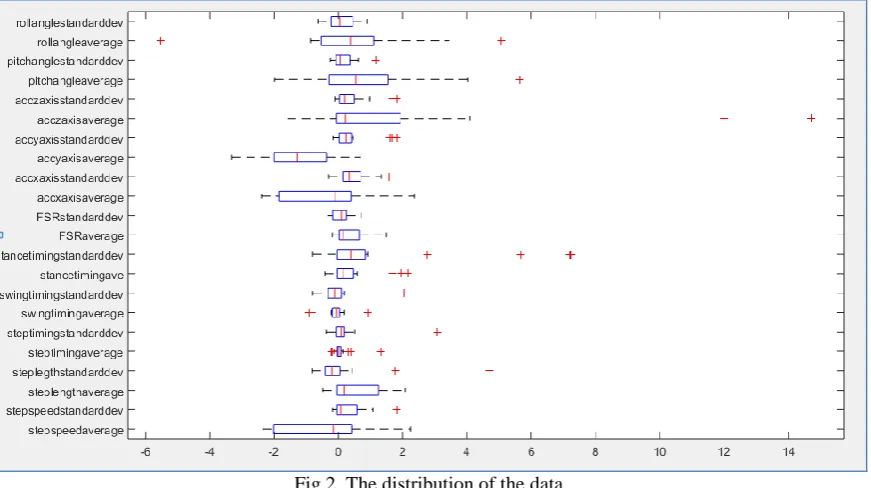
21 roll angle (m) Mean of ratio of yaw angle of feet 22 roll angle (sd) Standard deviation of ratio of yaw angle of feet As pointed out in the description of the data in Table 1, the features are all the mean and standard deviation of ratio of the gait parameter measured for two feet. In this way, the data become invariant to the speed, length, timing of the individuals but just dependent on the comparison of the gait parameters of one foot to the other one of the same individual. The distribution of the data with respect to the features is shown in Fig. 2.
linear combinations of features and seeks a lower dimensional representation that accounts for as much of the total variation of features as possible [13]. A principal component is linear combination of observed features that is obtained by computing the eigenvectors of variance-covariance matrix and the importance of eigenvector is expressed by the corresponding eigenvalue. In PCA, decreasing the dimension of the feature space, result in reducing the capability of the features expression of the whole data set. The number of the principal components selected to continue to the recognition should be decided first.
Fig 2. The distribution of the data
The pattern recognition algorithms compared for the classification success are support vector machines, k-nearest neighbour and classification tree algorithms. Training the data set with a support vector machine (SVM) consists of finding the optimal hyper plane that has the maximum distance from nearest training patterns where the support vectors are the ones nearest to the determined hyper plane [15]. The nearest neighbour algorithm uses the “k” closest point measured by Euclidian distance to perform classification [16]. Classification trees store the pattern information through nodes, which may store pattern primitive or substructure information and through arcs, which reflect relational information between the parent node and successors [14].
In our study, the principal component analysis as well as pattern recognition algorithms are performed in MATLAB R2015a Statistics and Machine Learning Toolbox. The dataset is divided randomly as the three quarter of it used for the training while the remaining quarter for the prediction.
III.RESULTS
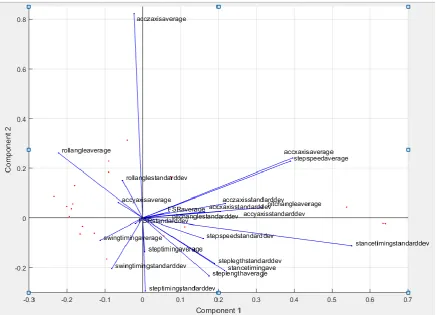
Principal component analysis performed on the whole dataset and the scores of the data and the weights of the features are showed in the first and second principal component plane in Fig 3. The eigenvalues of the covariance matrix and the percentage of the total variance explained are given in Table 2.
Table 2. The Eigenvalues of the Covariance Matrix and Percentage of Total Variance Explained
Principal Component
Eigenvalues of covariance
Percentage of total variance (%)
First 7.4059 33.6631
Second 4.8745 22.1570
Third 2.7745 12.6114
Fourth 1.9208 8.7310
Fifth 1.5884 7.2201
total variance. By using the principal component for the rest of the analysis the feature space will decreased from twenty-two dimensions to six dimensions.
Fig 3. The first and second principal components for the gait parameters
After the gait parameters are transformed to the principal component space, the classification analysis is performed by means for different techniques. The results of pattern recognition algorithms are compared in case of classification rate in Table 3.
Table 3. Comparison of Pattern Recognition Algorithms
Algorithm
Training set (observations x
parameter)
Misclassification rate recorded by the algorithm
Prediction set (observations x parameter)
Differentiation Rate
Misclassified observation
k-Nearest
Neighbour 15 x 6 None 5 x 6 %80
One healthy misclassified Support
Vector Machine
15 x 6 None 5 x 6 %20 Four healthy
misclassified
Tree 15 x 6 13% 5 x 6 %60
One healthy and one hemiplegic
misclassified
As seen from Table 3, the k-nearest neighbour algorithm accomplishes the best classification rate (80%) for both the training set and the prediction set. Although the support vector machine algorithm performed the 100% in training set, its classification rate is very low for the prediction set with 20%. The misclassification is experienced when classifying the healthy individuals. The classification tree algorithm show low misclassification rate for training set about 87%, it has a moderate success in prediction set with 60% classification rate. The classification tree algorithm differentiates the dataset according to the sixth principal component.
80%. The misclassification rate of the classification tree algorithm of the training set has decreased to zero, however the classification success for the prediction set remained as in the previous analysis with PCA at 60 %.
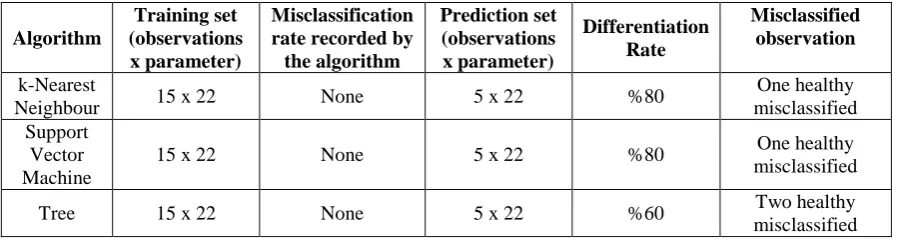
Table 4. Comparison od Pattern Recognition Algorithms with Twenty-two Features
Algorithm
Training set (observations x parameter)
Misclassification rate recorded by the algorithm
Prediction set (observations x parameter)
Differentiation Rate
Misclassified observation
k-Nearest
Neighbour 15 x 22 None 5 x 22 %80
One healthy misclassified Support
Vector Machine
15 x 22 None 5 x 22 %80 One healthy
misclassified
Tree 15 x 22 None 5 x 22 %60 Two healthy
misclassified
When classification tree algorithm is utilized with the original feature set without any PCA analysis, the “step speed (sd)” is the feature that differentiates the healthy individual from the hemiplegic patients. The parameter is the standard deviation of ratio of step speed of two feet. The gait with step speed (sd) is greater than 0.035 is classified as hemiplegic.
IV.CONCLUSIONS
In this study, different pattern recognition algorithms are compared in discriminating of hemiplegic patient from the normal individuals. The algorithms are used on two dataset with different features. In the first dataset, twenty-two gait parameters calculated from the gait analysis system are directly utilized while in the second analysis the principal components are determined and the data set is transferred to the principal component space by using the first six principal components weights. After this transformation, pattern recognition is studied and although the classification rate on the training set is extremely successful, on the prediction set support vector machine failed. However the k-nearest algorithm succeeded with a classification rate of 80%, while the classification tree algorithm has moderate success rate. On the first dataset without principal component transformation, support vector machine accomplish a classification as good as k-nearest neighbour algorithm. The transformation of twenty-two parameters onto the principal component space, seems to make the discriminating features recessive. Differentiating of hemiplegic gait from the normal gait is a binary classification problem, so the effect of features individually seems to be more successful than the linear combination of them. In the classification tree algorithm the step speed (sd) is found to be the significant feature, which is consistent with the clinical observations during the gait tests because the hemiplegic patients moves their healthy and impaired feet in a very different pattern with different speeds with respect to each other. It is recommended to increase the number of the records by including more hemiplegic patients and healthy individuals in the gait tests for further studies.
REFERENCES
[1] Nickel C., Brandt H., Busch C., “Benchmarking the Performance of SVMs and HMMs for
Accelerometer-Based Biometric Gait Recognition”, 2011 IEEE International Symposium on Signal Processing and
Information Technology, ISSPIT 2011, Bilbao, Spain, December 14-17, 2011.
[2] Huang B., Chen M., Huang P., Xu Y., “Gait modelling for human identification”, IEEE International
Conference on Robotics and Automation, 10-14 April, Rome, Italy, 4833-4838,2007.
[3] Berg R., Palaniswami M., “Computational Intelligence for Movement Sciences: Neural Networks and
Other Emerging Techniques”, Idea Group Publishing, Australia, 2006.
[4] Schepers M.,“Ambulatory assessment of human body kinematics and kinetics”, University of Twente, PhD
Thesis, 136pages, Netherland, 2009.
[5] Mariani B., Jimenez M.C. , Vingerhoets F.J.G. , Aminian K., “On-Shoe Wearable Sensors for Gait and
Turning Assesment of Patients with Parkinson’s Disease”, IEEE Transactions on Biomedical Engineering
Vol. 60(1), 155-158, 2013.
[6] Angusri N., Ishkawa K., Yin M., Omi E., Shibata Y., Saito T., Itasaka Y., “Gait instability caused by
vestibular disorders - Analysis by tactile sensor”, Auris Nasus Larynx, 38(4), 462-468, 2011.
[7] Klucken J., Barth J., Kugler P., Schlachetzki J., Henze T., Marzzeiter F., Kohl Z., Steidi R., Hornegger J.,
Eskoifer B., Winkler J., “Unbiased and mobile gait analysis detects motor impairment in Parkinson’s disease”, PLOS One, 8(2), 1-9, 2013.
[9] Bakbak, S., Kayacan, R. , 2014. Design and Application of a Laboratory Independent Posture and Gait
Analysis System (POGASYS). Süleyman Demirel University, Journal of Natural and Applied Sciences, 18
(SI:Biomechanics) :21-34
[10] Bamberg S.J.M., Benbasat A.Y., Scarborough D.M., Krebs D.E., Paradiso J.A., “Gait analysis using a
shoe-integrated wireless sensor system”, IEEE Transaction on Information Technology in Biomedicine,
12(4), 413-423, 2008.
[11] Mariani B., Hoskovec C., Rochat S., Büla C, Penders J., Aminian K., “ 3D gait assesment in young and
elderly subjects using foot worn inertial sensors”, Journal of Biomechanics, 43 (15), 2999-3006, 2010.
[12] Chelius G., Braillon C., Pasquier M., Horvais N., Gibollet R.P., Espiau B., Coste C.A., “A wearable sensor
network for gait analysis: A six day experiment of running through the desert”, IEEE/ASME Transactions
on Mechanics, 16(5), 878-883,2011.
[13] Fu L., Neural Networks in Computer Intelligence, McGraw-Hill Inc., USA, 1994.
[14] Schalkoff R.J., Pattern Recognition: Statistical, Structural and Neural Approaches, John Wiley & Sons,
Inc., New York, 1992.
[15] Duda R. O., Hart P. E., Stork D.G., Pattern Classification, 2nd Edition, Wiley Inc.,USA, 2000.
[16] Tan P., Steinbach M., Kumar V., Introduction to Data Mining, 1st Edition, Pearson, USA, 2006.
[17] Isa W. N. M., Sudirman R., Sh-Salleh, “Angular Features Analysis for Gait Recognition”, 1st
International Conference on Computers, Communications, & Signal Processing with Special Track on Biomedical Engineering, CCSP 2005, 236 – 238, 14-16 Nov. 2005, Kuala Lumpur, Malaysia.
[18] Sudha L.R., Bhavani R., “Performance Comparision of SVM and kNN in Automatic Classification of
Human Gait Patterns”, International Journal of Computers, Issue 1, Volume 6, 2012.
[19] Wu J., Wang J., “PCA-Based SVM for Automatic Recognition of Gait Patterns” Journal of Applied
Biomechanics, 24,83-87,2008.
[20] Begg R., Kamruzzaman, “A machine learning approach for automated recognition of movement patterns
using basic, kinetic and kinematic gait data”, Journal of Biomechanics, 38, 401-408,2005.
[21] Muniz A.M.S., Liu H., Lyons K.E., Pahwa R., Liu W., Nobre F.F., Nadal J., “Comparison among
probabilistic neural network, support vector machine and logistic regression for evaluating the effect of
subthalamic stimulation in Parkinson disease on ground reaction force during gait”, Journal of
Biomechanics, 43, 720-726,2010.
[22] Köktaş N.Ş., Duin R.P.W., Statistical Analysis of Gait Data to Assist Clinical Decision Making, Medical
Content-Based Retrieval for Clinical Decision Support Lecture Notes in Computer Science Volume 5853, pp 61-68, 2010.
[23] Bravo R. J., De Castro O. C., Salazar A. J., “Spastic Hemiplegia Gait Characterization Using Support
Vector Machines: Contralateral Lower Limb”, Revista de la Facultad de Farmacia, Universidad Central
de Venezuela 01/2006; 21:111 – 119.
[24] Wang Zhelong Wang, Jiang M., Zhang Y., “Children Abnormal Gait Analysis Based on SVM”,