University of South Carolina
Scholar Commons
Theses and Dissertations
2017
Development of an Electrochemical Method to
Study Real-Time in Vivo Neurotransmitter
Modulation
Srimal Aminda Samaranayake University of South Carolina
Follow this and additional works at:https://scholarcommons.sc.edu/etd Part of theChemistry Commons
This Open Access Dissertation is brought to you by Scholar Commons. It has been accepted for inclusion in Theses and Dissertations by an authorized administrator of Scholar Commons. For more information, please [email protected].
Recommended Citation
Samaranayake, S. A.(2017).Development of an Electrochemical Method to Study Real-Time in Vivo Neurotransmitter Modulation.
D
EVELOPMENT OF ANE
LECTROCHEMICALM
ETHOD TOS
TUDYR
EAL-T
IMEI
NV
IVON
EUROTRANSMITTERM
ODULATIONby
Srimal Aminda Samaranayake
Bachelor of Science University of Peradeniya, 2010
Submitted in Partial Fulfillment of the Requirements
For the Degree of Doctor of Philosophy in
Chemistry
College of Arts and Sciences
University of South Carolina
2017
Accepted by:
Parastoo Hashemi, Major Professor
Timothy J. Shaw, Committee Member
Thomas M. Makris, Committee Member
Rosemarie M. Booze, Committee Member
DEDICATION
I would like to dedicate this dissertation to my loving parents, my brother, and my
loving wife, for the all the commitments they have made to make my dreams a reality,
and for being my editorial board.
I would also like to dedicate this work to all the animals, who have sacrificed their
ACKNOWLEDGEMENTS
After an intense five years, today is the day I was waiting for: writing this note of
acknowledgments in my dissertation. It has been a wonderful, challenging, exciting and
unforgettable period for me, not only in the research arena but also in my personal life. I
would love to reflect my gratitude to the wonderful people who have helped me
throughout this exciting period.
First and foremost, I would like to express my sincere appreciation to my mentor,
Dr. Parastoo Hashemi. She was a great advisor, and her guidance led me through the
peaks and valleys of my graduate school career. Her passion toward science has been the
key to discovering my abilities and becoming an independent motivated scientist. Thank
you very much, Parry, for your support, motivation, and guidance in helping me to
become who I am today.
In addition to my advisor, I am very grateful to my dissertation committee, Dr.
T.J. Shaw, Dr. T. M. Makris and Dr. R. M. Booze for their advice, insightful comments,
and encouragement, which broadened my knowledge from various standpoints. I would
also like to thank my past committee members at Wayne State University, Dr. Rigby, and
Dr. Trimpin for their invaluable comments and intellectual ideas.
Next, I would like to thank all of our collaborators, Prof. R.M. Booze, Dr. P.
Ortinski, Prof. J. Best, Prof. M. Reed, Prof. H. Fred Nijhout, and Prof. M. Heien, for their
I would also like to thank the Hashemi lab members for the kindness, friendship,
and support you have all shown me. Even though I’m not a talkative person, I enjoyed all
the discussions that I had with all of you. My sincere gratitude goes to Pavithra, Shirley,
Rachel, Thushani, Kevin, Aya, Shane, Jordan, Alyssa, Rhiannon, Anna Marie, Matt,
Megan, Audrey and Bruce for their true kindness and friendship. A special thank you
goes to Pavithra, Shirley and Aya for teaching me everything about our lab and our
research; I appreciate all the professional and non-professional topics we have discussed
during this time. Also, I would like to thank Aya, Shane, Melinda, Jordan, Alyssa, and
Rhiannon for helping me with my English. Thank you very much for everything that you
have done for me.
I have a very special appreciation for all the Sri Lankan friends and families both
at Wayne State University and University of South Carolina who helped me during this
invaluable journey. Also, I want to thank all the technical and administrative staff at both
universities, for all the assistance they have provided to make this graduate school
journey more comfortable.
I would like to thank my life-coaches: My ever-loving father and mother who
have been inspiring me during every step and turn that I have made in my life so far.
Additionally, I am privileged to have a great brother and sister-in-law who continuously
motivated and encouraged me. Thank you for all that you have done for me because I
owe it all to you.
Lastly, but by no means least, I would love to thank my eternal cheerleader, my
and was there conquering every challenge with me. You have offered me more than I
could ever have wished for in my life. Thank you, Nadeesha, for everything.
Once again, thank you all for giving me the motivation to rise higher through the
ABSTRACT
Histamine and serotonin are important biogenic amines that regulate vital brain
functions. These two transmitters are thoughts to be involved in neurodegenerative diseases such as Parkinson’s and Alzheimer’s and affective disorders including
depression. Histamine and serotonin are believed to regulate each other but their
fundamental neuromodulation mechanisms are not well understood. This lack of
understanding makes brain disorders implicating these two transmitters difficult to
diagnose and treat. Our lab extensively investigates the serotonergic system to understand serotonin’s neurochemistry in the brain. However, histamine is relatively understudied
with respect to other biogenic amines because of an absence of suitable analytical tools.
This work introduces a strategic approach to overcome this analytical challenge and
investigates the real-time neuromodulation of in vivo histamine and serotonin to
understand physiological functions in healthy and disease states using fast-scan cyclic
voltammetry (FSCV). First, we perform a proof-of-principle study of Copper (Cu(II))
analysis to characterize the adsorption driven FSCV response. Next, we employ FSCV to
develop a novel voltammetric method to selectively and sensitively monitor real-time in
vivo histamine and serotonin neurotransmissions in the posterior hypothalamus (PH).
This study reveals that histamine inhibits serotonin via an H3 receptor mediated process,
highlighting histamine’s roles in regulating serotonin release in the brain. Following that,
we examine histamine’s reuptake mechanisms via monoamine transporter proteins and
Finally, we use our novel FSCV method to monitor histamine and serotonin
neurotransmissions in HIV- 1 Tg rats, which exhibit neuroinflammation, to understand
impaired neurochemical mechanisms in the disease state. Collectively, this dissertation
showcases a novel and robust electroanalytical strategy to simultaneously monitor in
vivo histamine and serotonin neuromodulation in real time. Innovative discoveries in this
systematic investigation of the histaminergic regulation of serotonin in diverse
neurochemical and pathophysiological processes will pave the way towards more
PREFACE
This dissertation is based closely on the following refereed publications:
Chapter 2: Pathirathna P, Samaranayake S, Atcherley CW, Parent KL, Heien ML,
McElmurry SP, Hashemi P (2014) Fast voltammetry of metals at
carbon-fiber microelectrodes: copper adsorption onto activated carbon aids rapid
electrochemical analysis. Analyst 139:4673-4680.
Chapter 3: Samaranayake S, Abdalla A, Robke R, Wood KM, Zeqja A, Hashemi P
(2015) In vivo histamine voltammetry in the mouse premammillary
nucleus. Analyst 140:3759-3765.
Chapter 4: Samaranayake S, Abdalla A, Robke R, Nijhout HF, Reed MC, Best J,
Hashemi P (2016) A voltammetric and mathematical analysis of
histaminergic modulation of serotonin in the mouse hypothalamus. J
TABLE OF CONTENTS
DEDICATION ... iii
ACKNOWLEDGEMENTS ... iv
ABSTRACT ... vii
PREFACE ... ix
LIST OF FIGURES ... xiii
LIST OF ABBREVIATIONS ... xvii
CHAPTER 1:INTRODUCTION ...1
1.1NEUROMODULATION OF HISTAMINE AND SEROTONIN ...1
1.2FAST-SCAN CYCLIC VOLTAMMETRY (FSCV) ...7
1.3SCOPE OF THE DISSERTATION ...10
1.4REFERENCES ...12
CHAPTER 2:FAST VOLTAMMETRY OF METALS AT CARBON-FIBER MICROELECTRODES: COPPER ADSORPTION ONTO ACTIVATED CARBON AIDS RAPID ELECTROCHEMICAL ANALYSIS ...18
2.1ABSTRACT ...19
2.2INTRODUCTION ...19
2.3EXPERIMENTAL SECTION ...22
2.4RESULTS AND DISCUSSION ...25
2.5CONCLUSIONS ...36
CHAPTER 3:IN VIVO HISTAMINE VOLTAMMETRY IN THE MOUSE PREMAMMILLARY
NUCLEUS ...41
3.1ABSTRACT ...42
3.2INTRODUCTION ...42
3.3EXPERIMENTAL SECTION ...44
3.4RESULTS AND DISCUSSION ...48
3.5CONCLUSION ...59
3.6REFERENCES ...60
CHAPTER 4:AVOLTAMMETRIC AND MATHEMATICAL ANALYSIS OF HISTAMINERGIC MODULATION OF SEROTONIN IN THE MOUSE HYPOTHALAMUS ...63
4.1ABSTRACT ...64
4.2INTRODUCTION ...64
4.3MATERIALS AND METHODS ...66
4.4RESULTS ...70
4.5DISCUSSION ...78
4.6REFERENCES ...83
CHAPTER 5:SELECTIVE SEROTONIN REUPTAKE INHIBITORS BLOCK HISTAMINE REUPTAKE VIA ORGANIC CATION TRANSPORTERS; A FAST SCAN CYCLIC VOLTAMMETRIC STUDY ...88
5.1INTRODUCTION ...99
5.2MATERIAL AND METHODS...90
5.3RESULTS AND DISCUSSION ...93
5.4CONCLUSIONS ...101
5.4REFERENCES ...102
6.1INTRODUCTION ...108
6.2METHODS ...110
6.3RESULTS ...112
6.4DISCUSSION ...113
6.5REFERENCES ...116
CHAPTER 7:CONCLUSIONS AND PROSPECTS ...120
APPENDIX A:PERMISSION OBTAINED FROM THE ROYAL SOCIETY OF CHEMISTRY TO REPRINT THE ARTICLE IN CHAPTER 2 ...123
APPENDIX B:PERMISSION OBTAINED FROM THE ROYAL SOCIETY OF CHEMISTRY TO REPRINT THE ARTICLE IN CHAPTER 3 ...125
LIST OF FIGURES
Figure 1.1. SEM image of a carbon-fiber microelectrode ... 19
Figure 1.2. The stimulated release of serotonin in mouse hippocampus CA2. (A)
representative color plot. Inset shows a classic serotonin CV extracted from the vertical white dashed line. (B) illustrates a [serotonin] vs. time response obtained from the horizontal dashed line along the peak serotonin oxidation event. ...22
Figure 1.3. (A) Representative color plot for simultaneous detection of histamine and
serotonin in mouse posterior hypothalamus. (B) CV extracted from the vertical white dashed line at the histamine event. (C) [histamine] and [serotonin] vs. time obtained from horizontal dashed line along both events. The blue bar right underneath the color plot and in (C) represents the stimulation. ...23
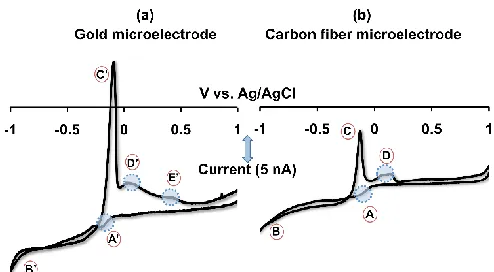
Figure 2.1. Slow scan cyclic voltammograms of Cu(NO3)2 on (a) AuM and (b) CFM at a
scan rate of 10 mVs-1 in NaCl. Peaks A’ – E’ appear on the AuM, whereas peaks A – D
appear on the CFM...40
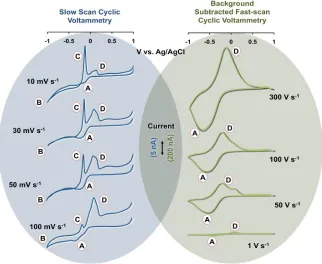
Figure 2.2. Left: Slow scan cyclic voltammograms of Cu(NO3)2 on CFMs at scan rates of
10, 30, 50 and 100 mVs-1. Right: Fast scan background-subtracted cyclic voltammograms
of Cu(NO3)2 at scan rates of 1, 50, 100 and 300 Vs-1 ...30
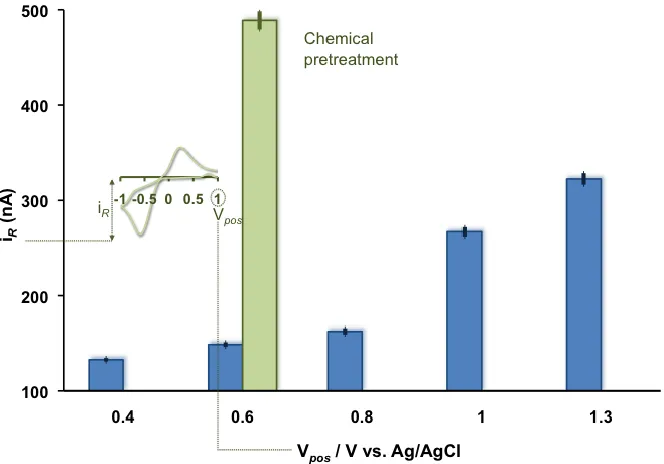
Figure 2.3. Maximum cathodic current of Cu(NO3)2 (10 µM) fast scan cyclic
voltammograms as a function of anodic potential limit (blue series) at 300 Vs-1 and as a
function of acid pretreatment (green) ...44
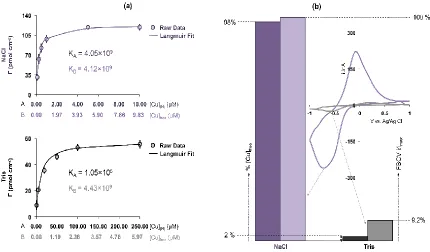
Figure 2.4. (a) Langmuir adsorption isotherms for Cu(NO3)2 on CFMs in NaCl (top) and
in tris buffer (bottom). (b) Histogram showing % [Cu2+]
free in solution and % cathodic
current of Cu(NO3)2 (10 µM) in NaCl (purple series) and in tris buffer (black series) at
300 Vs-1 (% cathodic current is shown by setting the maximum cathodic current with tris
buffer to 100% and expressing the cathodic current with NaCl as a percentage of this). The inset background-subtracted cyclic voltammograms are representative examples taken in NaCl (purple) and tris buffer (black) ...45
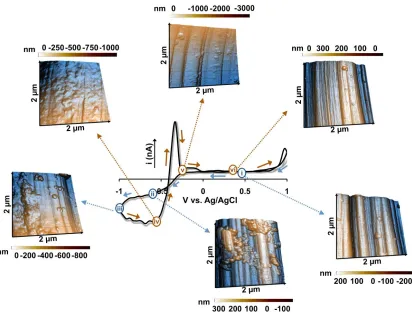
Figure 2.5. AFM images of a slow scan (10 mVs-1) cyclic voltammogram of Cu(NO
3)2
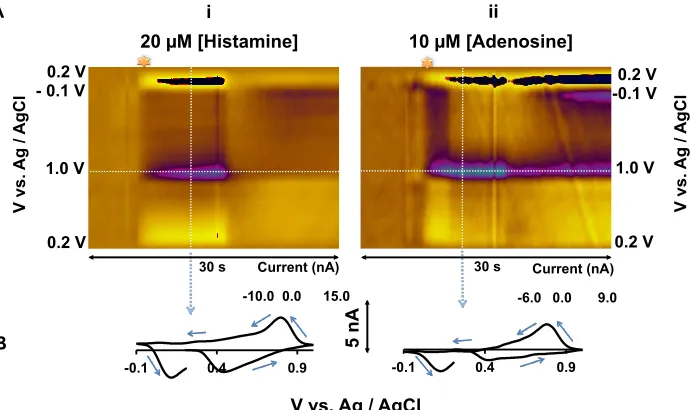
Figure 3.1. A shows color plots for FIA of (i) 20 µM histamine (ii) 10 µM adenosine. B
shows CVs extracted from the vertical dashed lines from (i) and (ii) ...62
Figure 3.2. A shows the schematic diagram of the experimental setup used for
potentiometric experiments. B shows the experimental potentiometric data for five
consecutive injections of histamine (200 µM) on CFM. C Langmuir isotherm for
histamine adsorption on CFMs in Tris buffer ...64
Figure 3.3. A & C show color plots for FIA of 20 µM histamine with the serotonin and
HSW waveforms respectively. CVs extracted from vertical dashed lines are shown on the
right. B shows Current vs. time traces from the horizontal dashed lines from color plots.
D shows (i) Calibration curve, (ii) Linear dynamic range (n=4 ± SEM). E Stability of CFM over 50 consecutive injections of 10 μM histamine (n=4 ± SEM) ...66
Figure 3.4. CVs for 20 µM histamine, 100 nM dopamine, 10 nM serotonin and 1 µM
adenosine with in vitro FIA using HSW on CFMs. Vertical dashed lines indicate potential
positions of peaks ...68
Figure 3.5. A shows a representative colors plot of in the PM upon MFB stimulation. B
shows a representative in vitro color plot of histamine (20 µM) using FIA. C shows
[histamine] vs. time extracted from the horizontal dashed line from color plot A. D shows
normalized CVs of in vivo and in vitro (5 µM histamine) signals taken from vertical
dashed lines ...69
Figure 3.6. A shows the positions of electrodes (stimulation and CFM) in mouse brain. B
& D show representative color plots of stimulated release of histamine using HSW -
before and after tacrine (2 mg Kg-1) and thioperamide (20 mg Kg-1). C & E show
concentration vs. time traces extracted from horizontal dashed line from B & D
respectively, (n=5 ± SEM). The 2 s stimulation starting at 5 s is shown by the blue bar ..71
Figure 4.1. (Ai & Aii) The position of electrodes (stimulation and CFM) in mouse brain.
(Bi & Bii) Representative color plots of the stimulated release of histamine and serotonin in the premammillary nucleus (PM) and stimulated release of serotonin in the substantia
nigra (SNr) respectively. (Ci & ii) Superimposed cyclic voltammograms of in vivo and in
vitro histamine and serotonin signals taken from vertical dashed lines in the PM. (Ciii)
Comparison of normalized CVs of in vivo serotonin signals taken from vertical dashed
lines in both PM and SNr. HA= histamine, 5-HT = serotonin ...85
Figure 4.2. (A) Representative color plot of the stimulated release of histamine and
Figure 4.3. (A) [Histamine] vs. time plots comparing in vivo (solid traces) and the results of the mathematical model (large dots) in the control case. (B) [Serotonin] vs. time plots
comparing in vivo (solid traces) and the results of the mathematical model (large dots) in
the presence of thioperamide (20 mg kg-1) (C) Firing rate of the histamine neurons as a
function of time in the two cases control (blue) and drug (green), respectively. (D) Assumed fractional release of histamine from the histamine neurons as a function of time in the two cases. [HA] = [histamine], [5-HT] = [serotonin] ...89
Figure 4.4. [Histamine] vs time traces are shown in blue and green for pre and post drug
administration respectively. [Serotonin] vs time traces are shown in red and orange for before and after the drug. Error bars showing SEM (n=5 ± SEM) are lighter versions of
these respective colors. (A) thioperamide 2 mgKg-1 (B) thioperamide 20 mgKg-1 (C)
thioperamide 50 mgKg-1. [HA] = [histamine], [5-HT] = [serotonin] ...91
Figure 5.1. CFMs and stimulating electrode placements in PH and MFB respectively.
(A) CFM lesion which is denoted by a blue circle. (B) Left hemisphere is a diagram
illustrating intended placement of MFB, and right hemisphere shows the actual placement of the electrode. (C) CFMs placement in PH. ...95
Figure 5.2. The representative color plots, cyclic voltammograms (CVs) and evoked
histamine traces for control experiments in different sets of animal groups A to F. Left column shows color plots. The middle column illustrates CVs that were extracted from each color plot at the vertical dashed line (denoted by the yellow star). Right column shows the average control [histamine] vs time traces for each drug category (n=5 ± SEM). Shaded region around the trace represents the SEM. Green bars underneath each color plot and each trace in the right column represent the stimulation. Blue vertical bars in the middle column highlights the histamine oxidation peak. ...97
Figure 5.3. Top panel - [histamine] vs. time traces are shown in blue and green for pre
and post-vehicle administration respectively. Bottom panel - [serotonin] vs. time traces are shown in red and orange for before and after the vehicle respectively. Error bars showing SEM (n=5 ± SEM) are lighter versions of these respective colors. (A) 5% DMSO and (B) Saline ...98
Figure 5.4. Comparison of histamine and serotonin responses after monoamine
transporter inhibitors. (A) GBR 12902 (15 mg/kg) (B) desipramine (15 mg/kg) (C)
escitalopram (10 mg/kg) (D) citalopram (5 mg/kg) (E) sertraline (10 mg/kg). (F)
Figure 6.1. (A & B) Representative color plots of simultaneous detection of evoked histamine and ambient serotonin in the posterior hypothalamus of control (F344) and HIV-1 Tg rats respectively. Inset in each color plot (white trace) are CVs taken from the
vertical dashed lines. (C) Top panel - [Histamine] vs. time plots for the control rats(solid
blue trace) and HIV-1 Tg rats (solid red trace). Bottom panel - [Serotonin] vs. time plots
comparing control animal (solid blue trace) and HIV-1 Tg (solid red trace). Shaded
regions in each trace show the standard error of the mean (SEM) for n=7 animals. Green bars underneath the color plots denote occurrence and duration of the electrical stimulation (2 s) ...113
Figure 6.2. (A & B) Representative color plots of the stimulated release of serotonin in
LIST OF ABBREVIATIONS
CHAPTER 1
INTRODUCTION
1.1 Neuromodulation of Histamine and Serotonin
Histamine is an important biogenic amine which modulates vital brain functions1-3
by regulating other neurotransmitters, in particular serotonin4,5. These two chemical
messengers co-exist in multiple brain regions6,7 and are implicated in many brain
dysfunctions such as Parkinson’s8-10 and Alzheimer’s diseases11,12 and mood
disorders13,14. Lack of knowledge regarding histamine and serotonin neuromodulation
mechanisms makes such brain disorders hard to diagnose and cure. Our lab widely
investigates the serotonergic system to understand the complex neurochemistry of this
molecule using electroanalytical tools15,16. However, histamine neurochemistry has been
relatively understudied with respect to serotonin. It is desirable, therefore, to study in vivo
neuromodulation of these two neurotransmitters to understand their functions in healthy
and disease states. To date, this topic has been challenging due to the absence of
appropriate analytical tools. This dissertation illustrates the development of a novel
voltammetric method to monitor, in real-time, the modulatory profile of these two
messengers. The serotonergic and histaminergic systems are discussed in the first part of
this chapter. The second portion describes existing electroanalytical techniques to
monitor in vivo neurotransmissions, while the latter part of the chapter focuses on method
1.1.1 The Serotonergic System
Serotonin is a vital neurotransmitter that is implicated in mood and emotional
brain functions17. Dysregulation of this chemical messenger in the brain causes several
neurological disorders such as anxiety and depression13,14. Therefore, serotonin has been
the main focus of depression and antidepressant drug related studies13. However, the tight
regulation of in vivo serotonin in the brain creates limitations for analytical tools to
monitor rapid serotonin neurotransmissions. Despite limited selectivity, differential pulse
voltammetry and chronoamperometry studies have brought forth noteworthy information
about in vivo serotonin dynamics18,19. In 2009 Hashemi et al. employed fast-scan cyclic
voltammetry (FSCV) to detect in vivo stimulated serotonin release in the rat substantia
nigra pars reticulate (SNr) as a more selective and robust method20.
With this method, our lab primarily concentrates on in vivo serotonin
neurotransmission in depression and autism spectrum disorder. The Hashemi lab has been
studying endogenous serotonin release and reuptake mechanisms using FSCV. For
instance, our lab confirmed that the serotonin system consists of two distinct reuptake
mechanisms and found a prolonged inhibitory role for serotonin autoreceptors16.
Histamine has been previously thought to modulate serotonin4. Therefore, I became
interested in investigating histamine and serotonin neuromodulation. More details about
the histaminergic system are presented in the next section.
1.1.2 The Histaminergic System
Histamine is a monoamine neurotransmitter which regulates important brain
amino acid histidine via decarboxylation by the histidine decarboxylase enzyme21.
Neuronal histamine is stored in cell somas and neuroeffector junctions22,23. Like other
biogenic amines, this transmitter is packaged into vesicles by vesicular monoamine
transporters and released upon the action potential activation24. However unlike other
biogenic amines, there is no known active transport mechanism for histamine25,26.
Therefore, enzymatic degradation is thoughts to be the primary means of histamine
inactivation via the N-methyltransferase enzyme27,28. Tele-methylhistamine, the product
of the histamine degradation, undergoes further degradation to t-methyl-imidazoleacetic
acid via monoamine oxidase29.
Past studies have identified four histamine receptors, namely the H1, H2, H3, and
H4 receptors. All receptors are rhodopsin-like G-protein coupled receptors3. Histamine
neurons are excited through H1 receptor activation and H1 receptor dysfunction leads to
immunological and behavioral abnormalities30. H1 receptor antihistaminergic agents
inactivate the H1 receptors and break signal propagation31. Distribution of the H2
receptors is more consistent and widespread in the rodent brain32. Dysregulation of this
receptor is associated with cognitive impairments33. Activation of the H3 autoreceptor,
which is an inhibitory feedback receptor on the presynaptic histamine neuron, inhibits
histamine release and synthesis34,35. Additionally, this presynaptic receptor controls the
release of other neurotransmitters, including glutamate, acetylcholine, and serotonin3,25.
Loss of H3 receptor function is related to abnormalities in locomotion, behavior, and
weight36,37. H4 receptors exhibit properties similar to the H3 receptors but are expressed in
Recent studies have shown that irregularities of the histaminergic system cause
abnormalities in neuroendocrine and higher brain functions. Histamine levels are
significantly increased in the brains of Parkinson’s patients8,10. The degeneration of
histaminergic fibers in the tuberomammillary nucleus (TMN), as well as globally lowered
neuronal histamine levels, are well-documented in Alzheimer’s disease11. Moreover,
histamine is a key biomarker of inflammation which is comorbid with many brain
disorders39,40. Also, a recent study has illustrated that histamine may promote anxiety,
while lesions of the TMN reduce symptoms41. Interestingly, histamine neurons in TMN
are related to neuroendocrine signals concerned with mood disorders like depression33,42.
This relationship between histamine and depression is appealing to our lab since we
primarily concentrate on serotonin, which is the transmitter most highly implicated in
depression and anxiety.
Therefore, I find it of great significance to direct my efforts to study in vivo
histamine and serotonin modulation. However, studying this neuromodulation
mechanism has been challenging due to the absence of suitable analytical techniques,
which can simultaneously monitor these two chemical messengers in vivo. An ideal
method should encompass: sensitivity for low neurotransmitter concentrations, selectivity
for different neurotransmitters, adequate speed for monitoring sub-second
neurotransmission and appropriate probes for real-time in vivo measurements.
Electroanalytical techniques and how they address these challenges are described in the
1.1.3 Detection and Quantification of Neurotransmitters
Monitoring the brain’s chemicals and neurotransmitters necessitates specific
requirements. First, brain signaling events occur on a sub-second time scale. Thus, the
temporal resolution of the method should be sufficient to monitor these events. Secondly,
the brain is physically delicate thus the technique should be minimally invasive. Third,
neurotransmitters and their metabolites are chemically similar, which means the tool must
have a high degree of selectivity to distinguish between species. Lastly, neurotransmitters
are present at very low concentrations in the synapse. Accordingly, an ideal detection
method must display excellent sensitivity.
Carbon fiber microelectrodes (CFMs) are biocompatible, robust, stable, and cause
minimal damage to the brain tissue. They also have favorable and fast surface kinetics for
sensitive measurements43. Moreover, the large surface area due to the rough exterior of
the carbon surface allows for more adsorption as shown in Figure 1.1. Undoubtedly,
combining CFMs with electroanalytical techniques permits the quantification of
electroactive neurotransmitters in the brain, in real time.
Figure 1.1. SEM image of a carbon-fiber microelectrode
Carbon Fiber
1.1.4 CFMs and Electroanalytical Techniques
Some monoamine, like dopamine, serotonin, histamine and adenosine, are
electroactive. Therefore, the dynamics of these electroactive messengers can be studied
using electroanalytical techniques in vivo as described below.
Amperometry works by holding the CFM at a potential that is more positive than the analyte’s oxidation potential. The resulting continuous oxidation produces a current
which is used to quantify the neurotransmitters around the electrode. This method has
been developed to monitor exocytosis in a single cell44. Moreover, the flexibility of
CFMs makes it feasible to build microelectrode arrays. For instance, the Ewing group has
been using a 16-electrode array to monitor exocytosis from a single cell45. Amperometry
is a sophisticated technique to measure chemical messengers. However, selectivity is
inadequate for monitoring neurotransmission in complex media, because the constant
potential oxidizes all electroactive analytes below the applied potential.
Chronoamperometry has been developed to overcome the selectivity problem
with amperometry. This method uses a square wave (between defined potential limits) to
CFMs at 5-25 Hz. The square wave generates a large capacitative current at the step
functions, which decays exponentially over time. Chronoamperometry can provide the
selectivity required, to some degree, by taking a ratio of oxidative and reductive currents.
This method has been using to study Parkinson’s disease46, depression47, addiction48, and
transporter kinetics49. Collectively, chronoamperometry can successfully monitor
neurotransmissions in vivo. The next section describes FSCV as a robust and selective
electrochemical technique to monitor real-time in vivo neurotransmission.
1.2 Fast-Scan Cyclic Voltammetry (FSCV)
Julian Milar and colleagues first presented FSCV to detect electroactive
neurotransmitters in the mid-20th century50. Over several decades, FSCV has been
emerging as an electroanalytical technique on diverse frontiers. Primarily, FSCV has
been utilized to monitor real-time dopamine dynamics51,52. Our lab has pioneered the
application of FSCV to serotonin, histamine53, Cu(II)54 and Pb(II)55. FSCV employs high
scan rates (100 Vs-1 to 1500 Vs-1) at a frequency of 10 Hz, whereas traditional cyclic
voltammetry uses mVs-1 scan rates. Therefore, with the higher scan rates employed in
FSCV, a single data set is collected within milliseconds, which raises the temporal
resolution to the sub-second scale. However, high scan rates also produce large
non-faradaic currents at the electrode surface, which mask the non-faradaic signal. Therefore,
FSCV is modified to integrate background subtraction to remove this non-faradaic signal.
As a result of background subtraction, FSCV can only detect changes. Therefore,
stimulation is used to evoke neurotransmitter release in vivo.
In FSCV, the CFM is held at a resting potential between cycles, allowing
neurotransmitters to adsorb onto the carbon surface. During the anodic wave, which
ramps up from the resting potential to a positive potential limit, adsorbed analytes will be
oxidized on the electrode surface; likewise, during the cathodic wave analytes will be
reduced. This potential vs. time instruction is known as a FSCV waveform and the
current. After background subtraction, FSCV generates an analyte specific cyclic
voltammogram (CV), that can be used for qualitative and quantitative analysis. For data
interpretation purposes, a 2D plot, also known as color-plot, is digitally constructed by
stacking a set of CVs collected at 10 Hz for a limited time of period. Quantitative data
along the time axis is provided by extracting horizontal data points along the event.
Serotonin detection is challenging with FSCV because serotonin’s metabolites
foul the electrode surface. However, a thin coating of Nafion, a cation exchange polymer,
overcomes this fouling issue20. Figure 1.2 illustrates the stimulated release of serotonin
in the CA2 region of the hippocampus medial forebrain bundle (MFB) stimulation.
Figure 1.2A shows a representative data color plot. The discrete green event around 0.7
V demonstrates serotonin oxidation. A typical serotonin CV is presented inset in the color
plot. Figure 1.2B represents [serotonin] vs. time event upon stimulation.
Figure 1.2. The stimulated release of serotonin in mouse hippocampus CA2. (A)
1.2.1 Expanding the Scope of FSCV
Histamine56, adenosine57 and H2O258 have similar CVs because their oxidation
peaks appear on the cathodic wave. Thus, their identities have only been tested via
pharmacological approaches. Modification of the FSCV waveform can permit these
neurotransmitters to be monitored more selectively without pharmacological verification.
Developing a FSCV method to monitor several neurotransmitters simultaneously is
challenging but would provide critical information about their modulatory mechanisms in
the brain.
Figure 1.3. (A) Representative color plot for simultaneous detection of histamine and
Figure 1.3A illustrates a representative color plot for simultaneous detection of
histamine and serotonin in mouse posterior hypothalamus (PH). I developed this novel
FSCV waveform that detects both the oxidation of histamine and serotonin
simultaneously53,59. FSCV recognizes histamine releases (green event), which is denoted
by white horizontal dashed line labeled “histamine”, in PH upon stimulation of the MFB
as shown in the Figure 1.2A. A subsequent serotonin event appears (blue event right
above histamine event) with a slight delay as denoted by a white dashed line labeled
“serotonin” in the color plot. Figure 1.2B represents the unique CV that is extracted from
the vertical dashed line along the events, and histamine oxidation appears around 0.3 V
whereas inverse serotonin oxidation occurs around 0.8 V. This inverse oxidation
(negative event) illustrates the reduction of ambient serotonin concentration after the
stimulation. Figure 1.1C shows [histamine] and [serotonin] vs. time responses obtained
from the horizontal dashed lines along both events in the color plot and these traces
demonstrate real-time histaminergic modulation of serotonin. This novel method can be
used to investigate in vivo histamine and serotonin to define their roles in healthy and
pathophysiological states.
This dissertation presents a systemic approach to developing a novel
electrochemical tool for simultaneous detection of in vivo histamine and serotonin, as
described below.
1.3 Scope of the Dissertation
In this dissertation, I first used Cu(II) metal analysis to understand the adsorption
FSCV method to selectively and sensitively monitor histamine neurotransmission in the
mouse posterior hypothalamus (Chapter 3). This work was extended to simultaneously
monitor histamine and serotonin in real time to study their neuromodulation in the brain
(Chapter 4). Since an active reuptake mechanism for histamine has not been identified, I
then utilized our novel method to study histamine reuptake mechanisms via monoamine
transporter proteins (Chapter 5). Finally, I used our novel FSCV method to investigate
histaminergic regulation of serotonin during disease using HIV-1 Tg rats which exhibit
neuroinflammation (Chapter 7). The outline of this dissertation is described below.
Chapter 1: Introduction
Chapter 2: This chapter describes the underlying fundamental mechanism of adsorption
driven FSCV responses. We demonstrated the progression of the FSCV response from
the classical cyclic voltammetry response using the Cu(II) analysis. Finally, we proved
that adsorption of Cu(II) onto the CFM surface follows a Langmuir adsorption isotherm.
Chapter 3: In this chapter, we optimized an electrochemical waveform that provided a
stimulation-locked and unique electrochemical signal for histamine. Then, we described
in vitro waveform optimization and in vivo detection of the stimulated release of
histamine in the mouse PH via electrical stimulation in the MFB. Finally, this chapter
demonstrated that a robust signal can be used to describe histamine's in vivo dynamics.
Chapter 4: This chapter describes a voltammetric approach to simultaneous monitoring
of histamine and serotonin in real time. We found that serotonin was rapidly and potently
developed mathematical models and performed pharmacological experiments to verify
that this serotonin inhibition was mediated by H3 receptors.
Chapter 5: In this section, we employed a previously described FSCV method (chapter
4) to investigate histamine reuptake kinetics pharmacologically. Moreover, this section
provides evidence for organic cation transporter mediated histamine uptake. We also
found that histamine reuptake mechanism were inhibited by commercially available
antidepressant drugs: escitalopram, citalopram, and desipramine.
Chapter 6: This chapter illustrates fundamental neurochemical changes in serotonin and
histamine in HIV-1 Tg rats, which display neuroinflammation. We employed FSCV to
interpret impaired neurotransmissions and found that histamine release was elevated in
HIV-1 Tg rats which in turn inhibited more serotonin compared to the control animals.
Chapter 7: The final chapter summarizes the conclusions of this research work and
highlights the future directions.
1.4 References
(1) Panula, P.; Yang, H. Y.; Costa, E. Proceedings of the National Academy of
Sciences of the United States of America1984, 81, 2572.
(2) Panula, P.; Nuutinen, S. Nature reviews. Neuroscience2013, 14, 472.
(3) Haas, H. L.; Sergeeva, O. A.; Selbach, O. Physiological reviews2008, 88, 1183.
(4) Threlfell, S.; Cragg, S. J.; Kallo, I.; Turi, G. F.; Coen, C. W.; Greenfield, S. A.
The Journal of neuroscience : the official journal of the Society for Neuroscience 2004,
(5) Schlicker, E.; Betz, R.; Gothert, M. Naunyn Schmiedebergs Arch Pharmacol
1988, 337, 588.
(6) Russell, W. L.; Henry, D. P.; Phebus, L. A.; Clemens, J. A. Brain research 1990,
512, 95.
(7) Moore, R. Y.; Halaris, A. E.; Jones, B. E. The Journal of comparative neurology
1978, 180, 417.
(8) Rinne, J. O.; Anichtchik, O. V.; Eriksson, K. S.; Kaslin, J.; Tuomisto, L.; Kalimo,
H.; Röyttä, M.; Panula, P. Journal of Neurochemistry2002, 81, 954.
(9) Ionov, I. D. The International journal of neuroscience2008, 118, 1763.
(10) Nowak, P.; Noras, Ł.; Jochem, J.; Szkilnik, R.; Brus, H.; Körőssy, E.; Drab, J.;
Kostrzewa, R. M.; Brus, R. Neurotoxicity Research2009, 15, 246.
(11) Nakamura, S.; Takemura, M.; Ohnishi, K.; Suenaga, T.; Nishimura, M.;
Akiguchi, I.; Kimura, J.; Kimura, T. Neuroscience letters1993, 151, 196.
(12) Panula, P.; Rinne, J.; Kuokkanen, K.; Eriksson, K. S.; Sallmen, T.; Kalimo, H.;
Relja, M. Neuroscience1998, 82, 993.
(13) Delgado, P. L.; Charney, D. S.; Price, L. H.; Aghajanian, G. K.; Landis, H.;
Heninger, G. R. Archives of general psychiatry1990, 47, 411.
(14) Gardner, A.; Boles, R. G. Progress in neuro-psychopharmacology & biological
psychiatry2011, 35, 730.
(15) Wood, K. M.; Hashemi, P. ACS Chemical Neuroscience2013, 4, 715.
(16) Wood, K. M.; Zeqja, A.; Nijhout, H. F.; Reed, M. C.; Best, J.; Hashemi, P.
Journal of Neurochemistry2014, 130, 351.
(18) Daws, L. C.; Toney, G. M.; Gerhardt, G. A.; Frazer, A. The Journal of
pharmacology and experimental therapeutics1998, 286, 967.
(19) Crespi, F.; Martin, K. F.; Marsden, C. A. Neuroscience1988, 27, 885.
(20) Hashemi, P.; Dankoski, E. C.; Petrovic, J.; Keithley, R. B.; Wightman, R. M.
Analytical Chemistry2009, 81, 9462.
(21) Pipkorn, U.; Granerus, G.; Proud, D.; Kagey-Sobotka, A.; Norman, P. S.;
Lichtenstein, L. M.; Naclerio, R. M. Allergy1987, 42, 496.
(22) Diewald, L.; Heimrich, B.; Busselberg, D.; Watanabe, T.; Haas, H. L. The
European journal of neuroscience1997, 9, 2406.
(23) Hayashi, H.; Takagi, H.; Takeda, N.; Kubota, Y.; Tohyama, M.; Watanabe, T.;
Wada, H. The Journal of comparative neurology1984, 229, 233.
(24) Merickel, A.; Edwards, R. H. Neuropharmacology1995, 34, 1543.
(25) Brown, R. E.; Stevens, D. R.; Haas, H. L. Progress in neurobiology 2001, 63,
637.
(26) Bolam, J. P.; Ellender, T. J. Neuropharmacology2016, 106, 74.
(27) Barnes, W. G.; Hough, L. B. J Neurochem2002, 82, 1262.
(28) Bowsher, R. R.; Verburg, K. M.; Henry, D. P. The Journal of biological chemistry
1983, 258, 12215.
(29) Lin, J. S.; Kitahama, K.; Fort, P.; Panula, P.; Denney, R. M.; Jouvet, M. The
Journal of comparative neurology1993, 330, 405.
(30) Parmentier, R.; Ohtsu, H.; Djebbara-Hannas, Z.; Valatx, J. L.; Watanabe, T.; Lin,
J. S. The Journal of neuroscience : the official journal of the Society for Neuroscience
(31) Simons, F. E. The New England journal of medicine2004, 351, 2203.
(32) Ruat, M.; Traiffort, E.; Bouthenet, M. L.; Schwartz, J. C.; Hirschfeld, J.;
Buschauer, A.; Schunack, W. Proceedings of the National Academy of Sciences of the
United States of America1990, 87, 1658.
(33) Dai, H.; Kaneko, K.; Kato, H.; Fujii, S.; Jing, Y.; Xu, A.; Sakurai, E.; Kato, M.;
Okamura, N.; Kuramasu, A.; Yanai, K. Neuroscience Research2007, 57, 306.
(34) Stevens, D. R.; Eriksson, K. S.; Brown, R. E.; Haas, H. L. Behavioural brain
research2001, 124, 105.
(35) Arrang, J.-M.; Garbarg, M.; Schwartz, J.-C. Nature1983, 302, 832.
(36) Tokita, S.; Takahashi, K.; Kotani, H. Journal of pharmacological sciences 2006,
101, 12.
(37) Toyota, H.; Dugovic, C.; Koehl, M.; Laposky, A. D.; Weber, C.; Ngo, K.; Wu,
Y.; Lee, D. H.; Yanai, K.; Sakurai, E.; Watanabe, T.; Liu, C.; Chen, J.; Barbier, A. J.;
Turek, F. W.; Fung-Leung, W. P.; Lovenberg, T. W. Molecular pharmacology 2002, 62,
389.
(38) Morgan, R. K.; McAllister, B.; Cross, L.; Green, D. S.; Kornfeld, H.; Center, D.
M.; Cruikshank, W. W. The Journal of Immunology2007, 178, 8081.
(39) Najjar, S.; Pearlman, D. M.; Alper, K.; Najjar, A.; Devinsky, O. Journal of
Neuroinflammation2013, 10, 43.
(40) Passani, M. B.; Ballerini, C. Frontiers in Systems Neuroscience2012, 6, 32.
(41) Frisch, C.; Hasenohrl, R. U.; Krauth, J.; Huston, J. P. Experimental brain
(42) Ito, C.; Shen, H.; Toyota, H.; Kubota, Y.; Sakurai, E.; Watanabe, T.; Sato, M.
Neuroscience letters1999, 262, 143.
(43) Lama, R. D.; Charlson, K.; Anantharam, A.; Hashemi, P. Analytical Chemistry
2012, 84, 8096.
(44) Zhang, B.; Heien, M. L. A. V.; Santillo, M. F.; Mellander, L.; Ewing, A. G.
Analytical chemistry2011, 83, 571.
(45) Wigström, J.; Dunevall, J.; Najafinobar, N.; Lovrić, J.; Wang, J.; Ewing, A. G.;
Cans, A.-S. Analytical Chemistry2016, 88, 2080.
(46) Nevalainen, N.; af Bjerkén, S.; Lundblad, M.; Gerhardt, G. A.; Strömberg, I.
Journal of Neurochemistry2011, 118, 12.
(47) Gould, G. G.; Hensler, J. G.; Burke, T. F.; Benno, R. H.; Onaivi, E. S.; Daws, L.
C. J Neurochem2011, 116, 291.
(48) Callaghan, P. D.; Owens, W. A.; Javors, M. A.; Sanchez, T. A.; Jones, D. J.;
Irvine, R. J.; Daws, L. C. Journal of Neurochemistry2007, 100, 617.
(49) Toney, G.; Daws, L. In Electrochemical Methods for Neuroscience; CRC Press:
2006, p 63.
(50) Stamford, J. A.; Kruk, Z. L.; Millar, J. Journal of neuroscience methods1984, 10,
107.
(51) Hermans, A.; Keithley, R. B.; Kita, J. M.; Sombers, L. A.; Wightman, R. M.
Analytical Chemistry2008, 80, 4040.
(52) Robinson, D. L.; Venton, B. J.; Heien, M. L. A. V.; Wightman, R. M. Clinical
(53) Samaranayake, S.; Abdalla, A.; Robke, R.; Wood, K. M.; Zeqja, A.; Hashemi, P.
Analyst2015, 140, 3759.
(54) Pathirathna, P.; Yang, Y.; Forzley, K.; McElmurry, S. P.; Hashemi, P. Analytical
Chemistry2012, 84, 6298.
(55) Yang, Y.; Pathirathna, P.; Siriwardhane, T.; McElmurry, S. P.; Hashemi, P.
Analytical Chemistry2013, 85, 7535.
(56) Hashemi, P.; Dankoski, E. C.; Wood, K. M.; Ambrose, R. E.; Wightman, R. M.
Journal of Neurochemistry2011, 118, 749.
(57) Nguyen, M. D.; Venton, B. J. Computational and Structural Biotechnology
Journal2015, 13, 47.
(58) Sanford, A. L.; Morton, S. W.; Whitehouse, K. L.; Oara, H. M.; Lugo-Morales, L.
Z.; Roberts, J. G.; Sombers, L. A. Analytical chemistry2010, 82, 5205.
(59) Samaranayake, S.; Abdalla, A.; Robke, R.; Nijhout, H. F.; Reed, M. C.; Best, J.;
CHAPTER 2
FAST VOLTAMMETRY OF METALS AT CARBON-FIBER
MICROELECTRODES: COPPER ADSORPTION ONTO ACTIVATED
CARBON AIDS RAPID ELECTROCHEMICAL ANALYSIS
Reprinted with permission from Royal Society of Chemistry.
Pathirathna P, Samaranayake S, Atcherley CW, Parent KL, Heien ML, McElmurry SP,
Hashemi P (2014) Fast voltammetry of metals at carbon-fiber microelectrodes: copper
adsorption onto activated carbon aids rapid electrochemical analysis. Analyst
139:4673-4680. I contributed both experimentally and intellectually and the results of this project
2.1 Abstract
Rapid, in situ trace metal analysis is essential for understanding many biological
and environmental processes. For example, trace metals are thought to act as chemical
messengers in the brain. In the environment, some of the most damaging pollution occurs
when metals are rapidly mobilized and transported during hydrologic events (storms).
Electrochemistry is attractive for in situ analysis, primarily because electrodes are
compact, cheap and portable. Electrochemical techniques, however, do not traditionally
report trace metals in real-time. In this work, we investigated the fundamental
mechanisms of a novel method, based on fast-scan cyclic voltammetry (FSCV), that
reports trace metals with sub-second temporal resolution at carbon-fiber microelectrodes
(CFMs). Electrochemical methods and geochemical models were employed to find that
activated CFMs rapidly adsorb copper, a phenomenon that greatly advances the temporal
capabilities of electrochemistry. We established the thermodynamics of surface copper
adsorption and the electrochemical nature of copper deposition onto CFMs and hence
identified a unique adsorption-controlled electrochemical mechanism for ultra-fast trace
metal analysis. This knowledge can be exploited in the future to increase the sensitivity
and selectivity of CFMs for fast voltammetry of trace metals in a variety of biological
and environmental models.
2.2 Introduction
Trace metal analysis in real-time is essential for understanding many biological
and environmental processes. For example, trace metals have important functions in
Alzheimer’s disease for example, copper accumulates in -amyloid plaques3. It is thought
that this copper build-up comes at the expense of its normal roles as a neurotransmitter,
accounting for some of the disease’s neurological deficits3,4. It has been impossible to
chemically monitor endogenously acting copper to verify this hypothesis, primarily
because chemical transmission occurs so quickly (< seconds).
Rapid metal analysis is also important in the environment, particularly in natural
water systems where trace metal contamination is extremely hazardous5. The
well-documented health consequences of trace metal exposure6-9 are exacerbated because
metals bioaccumulate in plants and animals10-13, providing numerous exposure paradigms
for humans. Anthropogenic sources of trace metals are commonly mobilized and
transported during hydraulic events (storms)14. It is critical to characterize aquatic trace
metals in real-time because their interactions with organic ligands and soils are fast (<
seconds)15. Such rapid metal detection would provide the most efficient implementation
of existing metal mitigation systems 16-21 via a diagnostic approach.
Most analytical techniques cannot monitor metals rapidly (< seconds).
Spectroscopic techniques are sensitive and selective22, however sample collection and
preparation can alter metal speciation and make dynamic measurements difficult23,24.
Electrochemical methods are attractive because the chemistry occurs at a submersible or
integrated surface that minimally impacts its surroundings. Ion-selective electrodes have
a temporal resolution of seconds;25,26 however it is typically challenging to make
measurements in dynamically changing matrices. Stripping voltammetries (such as
anodic stripping and adsorptive stripping voltammetry) have extremely high
(minutes) that decreases temporal resolution28-30. Moreover, anodic stripping
voltammetry is most commonly performed at Hg electrodes31 which have limited
portability and pose their own toxicity concerns.
We recently described the use of carbon-fiber microelectrodes (CFMs) to detect
copper (II) (Cu2+) and lead (II) (Pb2+) with fast scan cyclic voltammetry (FSCV) at scan
rates of 300 – 600 Vs-1 32,33. Our ultra-fast, Hg-free method can quantify Cu2+ and Pb2+
concentration changes every 100 ms with parts per billion and parts per million
sensitivity, respectively32,33. Our method is highly applicable for studying metals in real
time. However it is essential to describe the fundamental mechanisms of this fast
voltammetric method before it can be developed into a routine analytical tool for
biological and environmental applications. In this paper therefore, we take a
multi-faceted approach and establish the underlying mechanisms of fast voltammetry of Cu2+
on CFMs in established laboratory test solutions.
We analyzed Cu2+, a biologically relevant2 and environmentally problematic
metal ion34 with well-known redox chemistry35,36. Besides classical nucleation, growth
and stripping features36, we observed new, additional peaks in Cu2+ slow scan cyclic
voltammograms. These additional peaks were not diminished, as the classical features
were, when the scan-rate was increased. In fact, with increasing scan rate, the new
features were augmented, as seen previously with neurotransmitters adsorbed to CFM
surfaces37. We therefore investigated surface adsorption as a fundamental mechanism of
the Cu2+ FSCV signal. We utilized electrochemical, geochemical, and microscopic tools
to describe CFM’s surface and thermodynamic mechanisms towards Cu2+. This study
to metals. Our findings are critical to the future development of the method, namely
increases in sensitivity and selectivity, in application to real samples.
2.3 Experimental Section
2.3.1 Solutions
Cu2+ solutions were prepared by dissolving Cu(NO3)2 in NaCl (0.01 M) and in tris
buffer (15 mM tris(hydroxymethyl)aminomethane), 140 mM NaCl, 3.25 mM KCl, 1.2
mM CaCl2, 1.25 mM NaH2PO4, 1.2 mM MgCl2 and 2.0 mM Na2SO4). All chemicals
were purchased from Sigma-Aldrich (St. Louis, MO). At room temperature and pressure,
the pH of Cu2+ in NaCl and tris buffer solutions was ~5.5 and 7.4 respectively.
2.3.2 Microelectrodes
CFMs were prepared by vacuum aspirating a single carbon fiber of 5 µm radius
(T-650, Cytec Industries, NJ) into a glass capillary (0.6 mm external diameter, 0.4 mm
internal diameter, A-M Systems, Inc., Sequim, WA). The capillary was pulled under
gravity with a micropipette puller (Narishige, Tokyo, Japan) leaving a tapered end to
form a carbon-glass seal. The exposed end of the carbon fiber was cut to approximately
150 µm under a microscope. Gold microelectrodes (AuMs) were prepared as described
above but with a gold microwire of 10 µm radius (Goodfellow Co, PA), cut to
approximately 150-200 µm.
2.3.3 Cyclic Voltammetry
All voltammetry employed a 2-electrode system. Cyclic voltammograms were
collected on 5 different electrodes and representative examples are displayed. For slow
constantly stirred solution of Cu(NO3)2 and a triangular wave form (+1 V to –1 V) was
applied using custom software, Wildcat CV, written in LAB-VIEW 2012 (National
Instruments, Austin, TX). Only solutions for slow scan cyclic voltammetry were
nitrogen-purged prior to experimentation. The reference electrode was fabricated by
electroplating Cl– on a Ag wire (A-M systems, WA). For scan rates above 1 Vs-1,
in-house software, WCCV 2.0, written in LABVIEW 2012 collected background-subtracted
voltammograms in a flow-injection analysis system.
2.3.4 Electrochemical Pre-treatment
For most experiments microelectrodes were electrochemically pre-treated with a
Cu2+ sensitive triangular waveform as previously described.33 For experiments comparing
electrochemical and chemical pretreatments, the anodic potential/rest potential of the
CFMs was varied from +0.4 V to +1.3 V at a constant cathodic potential of -1.0 V at a
scan rate of 300 Vs-1. Electrodes were treated with each waveform for 10 minutes at 60
Hz and then 10 minutes at 10 Hz.
2.3.5 Chemical Pre-treatment
CFMs were chemically pretreated with a mixture of H2SO4 (0.25 M) and HNO3
(0.25 M) in a 3:1 ratio38 and washed with DI water prior to analysis.
2.3.6 Solution Geochemistry
Solution chemistry of Cu2+ in tris buffer and NaCl was modeled using
PHREEQCi, a geochemical modeling software capable of determining speciation based
on thermodynamic equilibrium. Stability constants during modeling were based on the
additional constants for complexation with solutions were modeled in equilibrium with
CO2(g) (10−4.8 atm.) and O2(g) (10−0.67 atm.).39 The pH values predicted by PHREEQCi
models were found to match the pH observed in experimental solutions.
2.3.7 Fast Scan Controlled-Adsorption Voltammetry (FSCAV)
A CFM was placed into a constantly stirred Cu(NO3)2 solution and a waveform
(-1.0 V – +1.3 V, resting potential of 0 V, at 600 Vs-1) was applied. An electronic relay
(ADG-419, Analog Devices) was used to switch between the applied waveform and a
constant potential of 0 V for 10 seconds to allow copper adsorption at the electrode
surface reach equilibrium. After 10 seconds, the waveform was reapplied, and the first
background-subtracted cyclic voltammogram was collected and analyzed for total
adsorbed copper. In house LabVIEW 2012 software integrated the reduction peak from
the background subtracted cyclic voltammogram of Cu2+ and Faraday’s law was used to
convert this to a surface concentration (ΓCu). Measured data was fit to the linearized
Langmuir isotherm (eq. 1) where C is the [Cu2+] in bulk solution, Γmax is the maximum
monolayer surface coverage, and K is the equilibrium constant for adsorption. This
experiment was performed in NaCl (10 mM) and tris buffer (15 mM).
𝑐/Γ𝐶𝑢 = 1
Γ𝑀𝑎𝑥𝑐 +
1
Γ𝑀𝑎𝑥𝐾 (1)
2.3.8 Atomic Force Microscopy (AFM)
CFMs were prepared as described above and electrochemically activated. During
slow scan cyclic voltammograms of Cu(NO3)2 (100 µM) (from +1 V to -1 V , back to +1
V), electrodes were temporarily disconnected for groups of electrodes at 6 different
reverse scan, all vs. Ag/AgCl. These electrodes had been exposed only to a partial section
of the waveform. Electrodes were stored in a closed container and transported to the
AFM. AFM images were taken using a Park Systems XE-NSOM instrument with a
non-contact tip.
2.4 Results and Discussion
2.4.1 Slow Scan Cu2+ Cyclic Voltammetry at CFMs
During slow-scan Cu2+ cyclic voltammetry, a cathodic potential sweep is applied
to the electrode at 1 – 10 mVs-1, followed by an anodic sweep that brings the potential
back to rest36. During the cathodic scan, copper is deposited on the electrode surface
following a nucleation and growth mechanism. Copper nucleates over a broad potential
range. These nuclei allow more Cu to deposit during a growth phase at any potential
sufficient for deposition. Therefore, there are often two broad ‘loop’ reduction peaks,
between the same voltages, on both cathodic and anodic scans36. The differences between
the nature of the electrode surface and the Cu surface make this nucleation/growth
deposition occur at a more negative voltage than the standard Cu2+ reduction
potential40,41. Indeed when holding a CFM at a constant potential of 0.34 V (Cu2+ 2e-→
Cu(s) standard reduction potential), addition of Cu(NO3)2 induced no change in current.
This behavior is true for holding potentials down to -0.1 V (data not shown). During the
anodic scan, the deposited Cu(s) is stripped off the electrode surface. Because this happens
from a Cu(s) rich surface (a single phase), the stripping or oxidation peak is sharp and its
voltage is much closer to the standard equilibrium potential40,41. Metal deposition can
potential deposition (UPD)42-44. UPD is a process by which a metal deposits onto another
metal at a more positive electrode potential than the Nernst potential for bulk
deposition42.
Figure 2.1. Slow scan cyclic voltammograms of Cu(NO3)2 on (a) AuM and (b) CFM at a
scan rate of 10 mVs-1 in NaCl. Peaks A’ – E’ appear on the AuM, whereas peaks A – D
appear on the CFM.
CFM slow scan cyclic voltammetry of Cu2+ was probed here by comparisons to
AuMs. Figure 2.1 shows representative cyclic voltammograms of Cu(NO3)2 (100 µM) on
a Au Microelectrode (AuM) (a) and a CFM (b) at 10 mVs-1 in NaCl. These two
voltammograms share common features. For example, Cu2+ reduction to metallic Cu
begins at 0.1 V (peaks A’, A) and continues via a loop formation between 0.4 V and -1.0 V on the cathodic scans (peaks B’, B). This loop formation is an indication of
nucleation and growth processes and is similar to previous observations.43 On both AuMs
and CFMs, sharp stripping peaks (C’, C) and shoulder peaks (D’, D) are present between
-0.1 to 0.2 V on the anodic scans. Shoulders accompanying stripping peaks have
previously been reported on glassy carbon electrodes44 and highly oriented pyrolytic
graphite electrodes43. The presence of complexing agents such as chloride and ammonia
potentials higher than stripping peaks41,43-47. Shoulder peaks have not been found to be
associated with stripping peaks in media containing no complexing agents40,48-51.
A mechanism for shoulder peak formation in the presence of Cl- has been
speculated previously44,47,52. First, deposited Cu oxidizes to Cu+, creating a stripping peak
(C’, C) and forming a barely conductive, passive layer of CuCl according to reaction (2).
Cu + Cl- → CuCl + e- ---(2)
The CuCl layer shields underlying metallic copper thereby momentarily arresting
further oxidation. Dissolution of this passive layer occurs either via direct diffusion or
diffusion of a more soluble complex (such as CuCl2-). Dissolution exposes the remaining
underlying metal allowing the electro-oxidation of Cu to continue as shown in reactions
(3) and (4):
CuCl + Cl- → CuCl
2- ---(3)
CuCl2-→ Cu2 + + 2Cl- + e- ---(4)
We determined whether these processes are responsible for shoulder peaks D’ and
D by systematically increasing the scan rate as described in the next section. There is an
additional peak on the AuM that is not present on the CFM (peak E’). UPD plays a
significant role in copper deposition on gold surfaces42 whereas on carbon materials,
metallic copper follows bulk deposition with no evidence for UPD41,43,44,46,48,53. Peak E’
on the AuM is likely a consequence of anodic processes associated with UPD on gold42.
2.4.2 Scan Rate Dependence
The shoulder peak mechanism proposed above was tested on CFMs by
progressively increasing scan rate. The rationale here is that by increasing scan rate,
mass-transport dependent.41 Because reactions (3) and (4) rely on the stripping peak, any
limitations in stripping should manifest proportionally on the shoulder peak.
In this experiment cyclic voltammograms of Cu(NO3)2 were collected at CFMs at
increasing scan rates. From 10 – 100 mVs-1, raw traces were analyzed; however at higher
scan rates, the charging current due to double layer capacitance dominates the Faradaic
component of the voltammetric signal. Therefore, cyclic voltammograms at 1 Vs-1 and
above were collected in a flow injection system (FIA) using background subtraction.
Figure 2.2 shows cyclic voltammograms collected at 10, 30, 50 and 100 mVs-1
(left, blue panel) and at 1, 50, 100 and 300 Vs-1 (right, green panel). This experiment
illustrates the evolution of a slow scan Cu(NO3)2 cyclic voltammogram in a typical FSCV
signal33. Increased peak separation at high FSCV scan rates is due to slow electron
transfer kinetics. All peaks are labeled as in Figure 2.1. From 10 – 100 mVs-1, the
magnitude of peaks (B) and (C) are greatly reduced such that they are almost absent at
100 mVs-1. This is consistent with the notion that nucleation and growth are
mass-transport limited and therefore can be ‘outrun’ at high scan rates. The magnitude of peaks
(A) and (D) however are not subject to the same behavior. Peaks (A) and (D) are present
and well defined at 100 mVs-1 implying that these features are neither mass-transport
limited nor dependent on peaks (B) and (C). The results of these experiments indicate
that mechanisms other than those described by Reactions (3) and (4) are responsible for
Figure 2.2. Left: Slow scan cyclic voltammograms of Cu(NO3)2 on CFMs at scan rates of
10, 30, 50 and 100 mVs-1. Right: Fast scan background-subtracted cyclic voltammograms
of Cu(NO3)2 at scan rates of 1, 50, 100 and 300 Vs-1.
For adsorbed species, the peak current is proportional to scan rate51 and we indeed
found that from 1 – 300 Vs-1, peak amplitudes increased. Furthermore, the slope of a plot
of the log current vs. log scan rate for Cu(NO3)2 was previously reported to be
approximately 1 at high scan rates33. Taken together, these findings strongly support a
hypothesis that peaks (A) and (D) stem from an adsorption controlled process.
Adsorption is explored in the following sections.
2.4.3 CFM Over-oxidation Leads to Enhanced Sensitivity
Activated carbon is widely used in wastewater treatment and is the primary
purification component of domestic water filters54,55. When carbon is activated (e.g. via
array of oxygen functionalities are created on its surface54. These oxygen moieties adsorb
and complex trace metals, removing them from solution56,57.
CFMs are typically electrochemically pre-treated prior to use56. Therefore, in
analogy to metal adsorption by activated carbon, the oxygen functionalities on the CFM
surface may rapidly complex trace metals in solution, pre-concentrating them on the
surface. In this experiment, we tested the hypothesis that enhanced surface oxidation is
responsible for increased FSCV sensitivity towards Cu2+, presumably due to an increased
number of adsorption sites.
Figure 2.3. Maximum cathodic current of Cu(NO3)2 (10 µM) fast scan cyclic
voltammograms as a function of anodic potential limit (blue series) at 300 Vs-1 and as a
function of acid pretreatment (green).
Using flow injection analysis, we collected background subtracted cyclic
voltammograms of CFMs exposed to a bolus of Cu(NO3)2 (10 µM) with different FSCV
waveforms. We systematically increased the anodic potential limit of the waveform at a