Electric Fencing Reduces Coyote Predation
on Pastured Sheep
SAMUEL B. LINHART, JERRY D. ROBERTS, AND GARY J. DASCH
Abstract
Field tests to evaluate electric fencing for protecting pastured sheep from coyote predation were conducted in North Dakota and Kansas in 1977 and 1978. In 1979, 37 western sheep producers using electric fences to exclude coyotes were interviewed and rele- vant data were recorded and analyzed. An all-electric 12-wire, 168-cm-high fence with alternately charged and grounded wires spaced 13 and 15 cm apart stopped ongoing coyote predation on the two North Dakota test sites. Four or five strands of electrified wire, offset 13 cm from existing woven and barbed wire sheep fences, effectively prevented further coyote predation at two Kan- sas sites. Sheep producers interviewed expressed a high to moder- ate degree of satisfaction with the use of electric fencing as a coyote management technique. However, sheep management practices on two-thirds of the ranches remained unchanged after electric fence installation and nearly all producers continued to use other control methods. Sixty percent of the producers stated thlat they expe- rienced some type of maintenance problems but many of these problems may have been due to poor construction techniques or a failure to check their fences periodically. lost-benefit factorsasso- ciated with the use of electric fencing, study limitations, and further research needs are discussed.
New Zealand “energizers” (fence chargers) and electric fencing technology developed in Australia and New Zealand were intro- duced into the United States in about 1976. Their availability’ and aggressive sales promotion within this country stimulated interest in electric fencing, both for livestock management and for exclud- ing coyotes and other predators from sheep pastures. Because electric fencing is more widely used in Australia and New Zealand, and since fencing technology in those countries appeared more advanced than that available in the U.S., we elected to use imported equipment and fencing practices for building our test fences.
We selected a 12-volt, battery-operated, New Zealand energizer (Gallagher Model E-12) for our field tests. Laboratory measure- ments indicated this charger was capable of driving greater than 8 amperes of peak current into a 500 ohm resistive load. As the
magnitude of current is related to the intensity of electrical shock, the New Zealand energizer produces a very intense repelling stimulus.
Woven or “net” wire fences have been used for many years as perimeter barriers or drift fences to exclude coyotes ,(Cuni.s lutruns) from sheep pastures (for a review, see Thompson 1979). However, the installation of electric fencing for this purpose has been limited and only within recent years have reports been published describ- ing this approach. These reports have ( I) outlined the mechanics of constructing electric fencing without reference to data indicative of their effectiveness (Shelton 1977, Henderson 1978, Gates 1978); (2) presented data on their effectiveness (or lack thereof) only when tested against captive coyotes confined to penned areas (Thomp- son 1976, 1979; Gates et al. 1978), or (3) evaluated (electric fencing techniques and materials that have been largely replaced by more advanced technology (Larson et al. 1975; Wallace 1975; Thompson
1976, 1979). Most recently, Dorrance and Bourne ( 11980) presented convincing field data indicating that electric fencing eliminated or sharply reduced sheep losses to coyote predation.
AI\ three authors are employed by the U.S. Fish and Wildlife Service. Denver Wildlife Research Center, Building 16. Federal Center, Denver. Colorado 80225.
We thank R. Banning, C. Bentrup, L. Erhardt. E. Gnadt, F. Gnadt, J. Huff. K. Price, and L. Stewart, sheep producers in North Dakota and Kansas who cooperated with us and permitted field tests to be run on their ranches. Fish and Wildlife Service ADC personnel in North Dakota, especially W. Pfeifer. E. Pittsley, R. SeVersOn, and J. Shoemaker, suggested test areas, enlisted the help of cooperating producers. and provided on-site assistance, as did E. Boggess, B. Brown. and F. Henderson. Kansas State University. R. Felton, N. Fischer, T. Rose, and 0. Wahl helped construct test enclosures. J. Beyer responsibly monitored the North Dakota tests, recorded data. and made valuable suggestions and recommendations. L. Kolz and R. Johnson, Denver Wildlife Research Center, measured and evaluated a number of different fence chargers and otherwise provided electronic support. E. Boggess. D. de Calesta. J. Gallagher, F. Henderson, J. Henderson, R. Nass, E. Pearson. R. Piesse. A. Sneh. J. Tigner, and F. Turkowski reviewed a draft of our questionnaire and made many helpful suggestions. A. Kriwox interviewed sheep producers m the states of Oregon and Washington who were using electric fencing on their ranches at the time of our survey. Finally, we acknowledge the assistance of those electric fencing distributors. wildlife extension specialists, county extension agents, and Fish and Wildlife Service employees who provided us with the names of producers we interviewed, as well as the producers themselves who freely offered the information required to conduct the survey.
Under New Zealand regulations, the maximum voltage from an energizer cannot exceed 5000 volts. There are many fence chargers marketed in the U.S. which produce voltages in excess of 15,000 volts, but the limited number of chargers that we tested indicated that, under simulated load conditions, these high voltage chargers actually delivered less current than the 5000 volt New Zealand model. The reason for this difference is due to an electrical design which allows the high voltage units to dissipate their energy inter- nally rather than delivering it to the external load. Fence chargers characterized by this high internal loss are called high output impedance chargers in contrast to the low impedance models produced in New Zealand and Australia. Proponents of the high impedance chargers often express concern as to the human shock hazard imposed by the low impedance devices. To our knowledge, there has never been a fatality from a low impedance energizer produced under the manufacturing regulations imposed by New Zealand and Australia as well as several European countries. In fact, certain New Zealand fence chargers have recently been approved by Underwriters* Laboratories, Inc. in the United States. Our field studies of electric fencing were conducted from 1977 to 1979 and consisted of three phases: a test to measure the efficacy of an all-electric fence for excluding sheep-killing coyotes, an evalua- tion of electrified wires offset from existing woven wire sheep fences, and a field survey involving personal interviews with a sample of western sheep producers who were currently using elect- ric fencing to protect their pastured sheep flocks.
Methods
All-electric Fence
Two ranches in south-central North Dakota having a history of
Manuscript received September 29, 1980.
‘Kiwi Fence Systems, Inc.. RD 5, Box 122, Waynesburg. Penn. 15370; Koppers Co., Inc., Koppers Building, Pittsburgh, Penn. 15219; Live Wire Products, P.O. Box 150. Grass Valley. Calif.; Snell Systems, Inc.. 10910 Wye Drive, San Antonio. Tex. 78217; Henry & Cornelia Swayze, Brookside Farm, Tunbridge, Vt. 05077; and Waterford Corp., P.O. Box 1513, 1449 Riverside, Fort Collins, Colo. 80522. Most or all of these companies can provide detailed instructions for installing electrical fences. Use of trade names does not constitute endorsement of commerical products by the U.S. Government.
chronic coyote depredations were used as test sites in 1977. Two sites a few hundred meters distant from each other were fenced on Ranch A. One enclosure (1.46 ha or 3.51 a) consisted of a barbed wire fence strung on metal T-posts adequate to retain lambs but not to exclude coyotes. This fence was designated as Fence I; its configuration (as are all other test fences) is described in Table I. The second enclosure (fence 2, I .38 ha or 3.41 a) was an all-electric fence built according to instructions provided by the New Zealand manufacturers and U.S. importers of electric fencing equipment. It consisted of tightly stretched (700-900 newtons or 150-200 lb of force) 2.5 mm ( 12-l / 2 gauge) high-tensile, smooth electric fencing wire clipped to 2.13 m (7 ft) fiberglass T-posts driven 46 cm (18 in.) into the earth. Conventional wood corner brace posts were used, but an additional brace post was positioned inward from each corner at a 45’ angle so as to accommodate the highly tensioned wires. Ceramic insulators were wired to all corner posts and in-line wire strainers were tied into all wires to adjust and maintain the correct tension. An insulated lead connecting all grounded wires was clamped to two 5. l-cm dia (2 in.) grounding rods located 1.8 m (6 ft) apart and driven about 2 m into the earth. The insulated lead connecting all charged wires was clamped to the energizer.
The first electric fence configuration evaluated on Ranch A was a six-strand fence 76 cm (30 in.) high with alternate wires charged and grounded (Fence 2). The above configuration was later modi- fied by adding a charged “outrigger” or “trip” wire 25 cm (IO in.) high and 51 cm (20 in.) out from the test fence and supported on shortened sections of fiberglass T-post (Fence 3). The last configu- ration tested on Ranch A involved removal of the trip wireand the addition of six more wires above the original 76-cm high fence (Fence 4). This resulted in a I2-wire, 168cm (66 in.) high enclosure (Fig. I) essentially identical to that described by Gates (1978) and Gates et al. (1978) but lacking a trip wire.
Two adjacent enclosures were also constructed at a second North Dakota test site (Ranch B). The first (1.50 ha or 3.70 acres) was of barbed wire (Fence I) and the second (I .OO ha or 2.4 1 acres) was a I2-wire, I68-cm high electric fence (Fence 4). Fences 2 and 3 were not evaluated at this site because of our earlier experience with these configurations on Ranch A.
The test procedure on both ranches was to document coyote predation on lambs in the barbed wire enclosure and then move the lambs into the adjacent electric fence enclosure. If the electric fence failed to stop predation, we made modifications until predation
Table 1. Fence configurations used in North Dakota and Kansas tests, 1977-1978.
Test numbers Test ranch Wire type Spacing intervals’ Charging configuration
12 A and B Barbed
2 A Electric
3 A Electric
4 A and B Electric
C Woven & barbed wire
6
7
82
C Woven & barbed wire with offset electric wires
C Woven & barbed wire
with offset electic wires
D Woven and barbed wire
9 D Woven & Identical to Fence 8 but with 4electric wires offset barbed wire I3 cm (5 in.) from woven and barbed wire fence. with offset Offset wires spaced at I5,46,7 I, and 127 cm above electric wires. ground level (6, 18, 28, and 50 in.).
IO D Woven &
barbed wire with offset electric wires.
Identical to Fence 9 but with only the two bottom wires (I5 and 46 cm in hgt.) in place and electrified.
5 strands spaced at 15, 30, 48, 71, and 104 cm above ground level (6, 12, 19, 28, and 41 in.).
6 strands spaced at 13, 25. 38. 51, 64, and 76 cm above ground level 5, IO, 15, 20, 25, and 30.).
Identical to Fence 2 but with single electric “trip” wire positioned 25 cm (IO in.) above ground level and 51 cm (20 in.) out from Fence 2.
I2 strands of electric wire. Bottom 6 wires identical to Fence 2; top 6 wires spaced at 91, 107, 122, 137, 152, and 168 cm above ground level (36, 42, 48, 54, 60, and 66 in.).
Standard woven wire (6-35-12-12 l/2) erected on metal T-posts. Bar spacings were 14, 29, 47, 67, and 90 cm above ground level (5.5, I 1.5,
18.5, 26.5, 35.5 in.). Two strands of barbed wire spaced at 100 and I IO cm (39.5 and 43.5 in.)above ground level.
Identical to Fence 5 but with 4 electric wires off-set I3 cm (5 in.) from woven and barbed wire fence. Off-set wires spaced at 13, 38, 56, and 122 cm above ground level (5.0. 15.0, 22.0 and 48.0 in.).
Identical to Fence 6 but with 5th electric wire added at 79 cm above ground level (31 in.).
Standard woven wire (9-39-12-12 I /2) erected on metal T-posts. Bar spacings were 8, 17, 27, 38, 51, 65, 80, and 98 cm above ground level (3.0. 6.5, 10.5, 15.0, 20.0, 25.5, 31.5, 38.5 in.).
One strand of barbed wire spaced at I IO cm (43.5 in.) above ground level.
Not charged.
Alternate + and - charged wires; bottom + wire.
Identical to Fence 2; + charged “trip” wire.
Alternate + and - charged wires; bottom + wire.
Not charged.
_ woven and barbed wires; i- electric wires
- woven and barbed wires; + electric wires.
Not charged.
_ woven and barbed wires; i- electric wires.
_ woven and barbed wires; -t- electric wires.
‘Actual wire spacings varied slightly from those shown in table due to variations in ground contours, wire tensions, and pre-notched fiberglass T-posts. Sheep confined within these fences were used to document coyote kills prior to evaluation of electric fences or wires.
(Fence 4). This configuration stopped predation for the next 60 days, at which time the test on Ranch A was terminated.
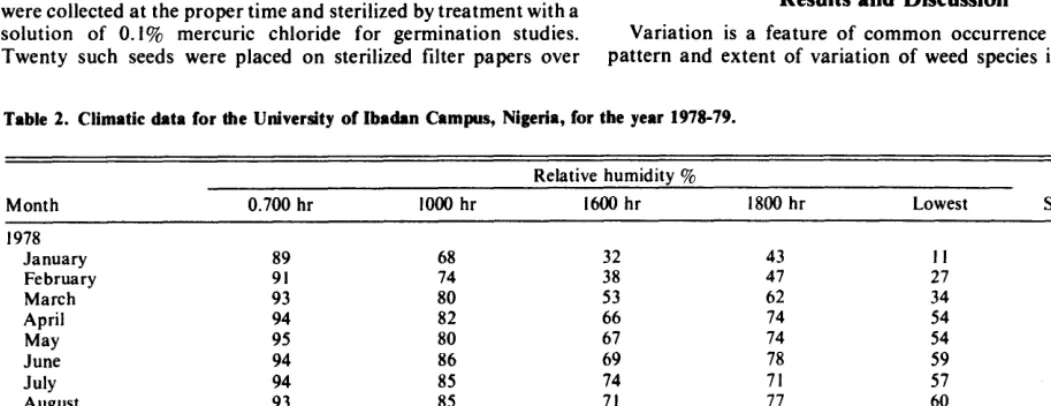
Fig. 1. A IZ-wire, 168-cm high electricfence tested in North Dakota. This fence effectively excluded coyotes.
ceased. Specifically, this procedure was carried out by placing 10 lambs in each of the two barbed wire enclosures on Ranches Aand B and checking them every other day for coyote kills. Lambs found dead within the enclosures were examined-and coyote kills deter- mined using criteria similar to those described by Rowley (1970), Henne (1975) and Bowns (1976). Coyote-killed lambs and those that died from other causes were replaced, as necessary, to main- tain a total of 10 live lambs per enclosure. When a total of 10 or more “baseline” kills had occurred, the remaining live lambs were removed from the barbed wire enclosure and the adjacent electric fence enclosure was “stocked” with 10 lambs and electrified. These lambs were then checked every other day for further coyote kills. Lambs confined within fence configurations that effectively excluded coyotes were monitored for 60 days, at which time tests were terminated.
Test enclosures used in 1977 and for trials in 1978 (discussed later) varied somewhat in size (0.93-l .75 ha or 2.25-4.2 acres) because of variations in vegetation, slope, and subsurface rock or hard pan at each site.
Results
Results of the 1977 field tests in North Dakota are shown in Figure 3. On Ranch A, lambs were confined within the barbed wire enclosure (Fence 1) for 22 days. Coyotes began killing on day 5 and continued intermittently until day 22, by which time a total of 16 lambs had been attacked. The remaining live animals were removed from this enclosure and 10 lambs were placed in the adjacent six-wire, 76-cm-high electric fence enclosure (Fence 2). Lambs remained in Fence 2 for 20 days but nine were killed between davs 16 and 20. An offset “trip” wire (Fence 3) was then stretched around the enclosure. The trip wire failed to deter preda- tion (four lambs killed on day 4) and it was removed and the electric fence was raised to 168 cm by the addition of six more wires
On Ranch B, coyote kills totaled I7 lambs confined within Fence I over a 68-day period. Kills began on day 28 and continued until the lambs were moved into the nearby 12-wire, 168-cm electric fence enclosure (Fence 4). No kills occurred for the next 60 days and the test was therefore eneded.
Offset Electric Wires
Methods
Offset electric wires strung on the outside of existing woven wire sheep fences were evaluated as a coyote exclusion technique in 1978. Two sheep ranches, one in southwestern Kansas and the second in northeastern Kansas, were selected as test sites. Both ranches had a history of chronic coyote depredations and both had sheep killed by coyotes in late spring I9787 just before initiation of our field tests. A single woven wire sheep fence encibsure was constructed on each ranch. The enclosure (1.75 ha, 4.2 acres) on Ranch C consisted of standard woven wire (factory designated as 6-35-12-12 I / 2) clipped to metal T-posts and topped by two strands of barbed wire (Fence 5). This fence was 110 cm (43.5 in.) high. The enclosure (0.93 ha or 2.25 acres) on Ranch D was constructed of woven wire (9-39-12-12 l/2) topped by only one strand of barbed wire and was also 110 cm high (Fence 8). Both of the above type fences are commonly used by Kansas livestock producers for sheep confinement.
The test procedure on both ranches consisted of stocking each woven wire enclosure with lo-20 lambs and a few ewes and moni- toring these sheep for coyote kills. When a minimum of five or more sheep were killed or wounded by coyotes, offset electric wires were strung along the outside of the woven wire fence, the woven and barbed wires were grounded, and all offset wires were charged (see Table 1). Electric wires were installed in the same manner as previously described. The fiberglass T-posts were driven about 46 cm (18 in.) into the ground and positioned opposite and 13 cm (5 in.) out from the metal T-posts holding the woven and barbed wires. The tops of the fiberglass and metal T-posts were fastened to
each other with a 0.3 X 2.5 X 17.8 cm ( l/8 X 1 X 7 in.) cut and bent steel bracket clamped to both T-posts with screw-type automotive hose clamps.
Electric wires were positioned as follows: the bottom wire was located at a height to prevent coyotes from going under the fence; the intermediate height wires bisected the bars of the woven wire fence to maximize body contact as coyotes attempted to pass through the fence; and the top electric wire was intended to dis- courage coyotes from jumping or climbing over the fence (Fig. 2).
Both four (Fence 6) and five (Fence 7) wire configurations were tested on Ranch C. On Ranch D, two (Fence 10) and four (Fence 9) wire installations were evaluated. Sheep confined within fence configurations that effectively excluded coyotes were monitored for 60 days, after which tests were terminated.
Results
The results of our tests with offset electrified wires are shown in Figure 3. Sheep on Ranch C were confined in Fence 5 for 105 days but it was not unit1 day 93 that coyotes began killing. The five kills recorded occurred from days 93 through 96. The four offset electric wires subsequently installed (Fence 6) deterred predation until the 17th day, when one killed and one wounded lamb were found. A fifth wire was then added to the fence (Fence 7) to block entry between two of the higher woven wire bars and no further kills occurred for the next 60 days.
Nine lambs were killed or wounded in a single night in the woven and barbed wire enclosure (Fence 8) on Ranch D. Immediately thereafter we attempted to install electric wires but experienced some technical problems so all surviving sheep were therefore removed from the enclosure.
Twenty-six days later a four electric wire configuration (Fence 9) was erected and the enclosure was again “stocked” with sheep. No coyote kills occurred for 60 days, at which time we removed all four wires to verify that depredating coyotes were still present and given the opportunity, they would attack our sheep. In the absence of electrified wires, coyotes killed 11 sheep within 5 days over an 1 l-day exposure period. The bottom two wires were then restrung (Fence 10) but 14 days later coyotes entered the enclosure and killed or wounded nine more sheep. We then terminated our test on Ranch D as it was apparent that four wires were required to exclude coyotes and that active killers were on this ranch through- out the entire period of our study.
Sheep Producer Survey
Methods
Factors such as fence construction, configuration and mainte- nance, sheep stocking rates, livestock management practices, topo- graphy and vegetation, and severity of predation all influence the efficacy and cost effectiveness of electric fencing. As we lacked time, funds, and personnel to carry out controlled tests to evaluate all these factors, we felt that an interview survey of producers currently using electric fencing would provide some indication as to its usefulness as a coyote management technique. In 1979, we contacted importers and distributors of electric fencing, university wildlife damage extension specialists, and state supervisors of the U.S. Fish and Wildlife’s Animal Damage Control Program. From these sources we compiled a list of sheep producers in the west and midwest who were presently using electric fencing to protect their pastured sheep from coyotes. We interviewed 37 ranchers and also obtained limited information regarding cooperative public and privately funded electric fencing ventures in southeastern New Mexico. The interview questionnaire we devised provided infor- mation regarding sheep production data, historic predator losses, predation rates with and without electric fencing, predator control efforts by traditional techniques, producer assessment and mainte- nance of their electric fences, and information on wire spacings and the types of fences installed. At the conclusion of each interview the interviewer ranked each producer’s electric fence with respect to adequacy of installation and maintenance, and its apparent effec- tiveness based on the data he recorded and on visual inspection of
*Or
Ranch A 1560
10
5
*Or
Ranch Bu
! *Or Ranch C
Ranch D 15
60
10 5
Fence design
Fig. 3. Results of electric fencing tests in North Dakota and Kansas. Hatched vertical bars indicate the numbers of sheep killed or wounded within each type fence. Solid diagonal bars indicate the length of time sheep were confined within eachfence. Tests were terminated when sheep were protected for 60 days (Fences 4, 7, and 9).
the fence.
Fourteen producers were interviewed in California, Oregon, and Washington and 23 in Kansas, Oklahoma, and Texas. The cooper- ative fencing projects in New Mexico were primarily undertaken to install “drift” fences, many of which were being installed adjacent to public lands. Two of the producers we interviewed were using electric fences to protect sheep in feed lot situations and all but two were using the relatively new Australian and New Zealand tech- niques, materials, and chargers.
Results
Some of the producers we interviewed would not or could not respond to all our questions. For example, several had purchased sheep and electric fencing materials simultaneously, and thus were not able to provide information regarding predation losses before and after fences were installed. The number of respondents (i.e., sample size) therefore varied depending upon the specific questions asked.
Of 36 individual producers from whom data were obtained, the mean acreage set aside for sheep production was 2,046 acres or 828 ha (range 50 to 16,800 acres or 20-6,799 ha). The mean number of sheep stocked was 437 ewes a&390 docked lambs. The coopera- tive electric fencing ventures in New Mexico involved 30-33 ranches and about 416,000 acres or 168,355 ha (650 sections) of deeded or leased land stocked with about 55-58 thousand sheep. Much of their electric fencing, a total of about 150 mi (241 km), was still being installed and thus little information on effectiveness and
maintenance was available at the time of our survey.
Eighteen of 35 (5 1%) individual producers interviewed installed their electric fencing because of predation problems in past years. The remaining 17 had experienced little or no previous predation but erected fences as a preventive measure. Where predator losses had occurred l-3 years before erecting fences, producers estimated they had lost 3,348 sheep to coyotes, 5 I to dogs, and 229 to all other predators (200 sheep were reported as lost to eagles by a single rancher).
Nineteen of 25 producers (76%) said that predator control was conducted on their ranch 1-3 years before they put up their fences. Only one of these individuals said that he discontinued the use of other control methods following installation of his fence. Sixteen of 25 ranchers (64%) stated that their electric fencing had reduced the need for predator control. However, of 20 producers who previously penned their sheep at night, only 5 (25%) discontinued this management practice after their fences were completed. Only 10 of 30 respondents (33%) said that their sheep management practices had changed since they put up their fences.
All but 3 of 35 respondents (9 1%) stated that they checked their sheep at least once a day and two-thirds of the producers who responded to questions regarding the extent of their predation losses relied upon their memory as opposed to written records.
After evaluating the completed questionnaires, 14 producers seem to have provided adequate information to permit a compari- son of predator losses before and after they erected their electric fences or wires. Losses to coyotes by all 14 producers over a combined total of 271 months and 27 lambing seasons totaled
1,064 sheep. Losses after fences or electric wires were installed, over a period of 228 months and 22 lambing seasons, totaled 51 sheep. According to our respondents, this represented a reduction of losses due to coyotes of about 94%.
Only 21 of the 37 individual producers (57%) obtained “profes- sional” advice (e.g., fencing distributors, county agents) before building fences or adding wires to existing sheep fences. Nineteen producers put up fences consisting entirely of electrified wires (generally with hot and grounded wires alternated), 11 strung electrified offset wires from existing woven wire sheep fences, and 7 producers erected both types of fencing. Thirty-four were being used as perimeter fences, 14 as cross fences, and 3 as drift fences. Seven fences consisted of a single “trip” wire offset about 13- 15 cm (5-6 in.) out from an existing fence and 13- 15 cm up from ground level, I producer had only a single charged wire at the top of an existing fence, 3 had both “trip”and top wires, and 28 had multiple strands of electrified wires. Twenty-one of 35 producers (60%) said that they experienced some type of maintenance problem. Twenty- three of 34 respondents (68%) rated their fences as very effective and 11 (32%) as fairly effective for controlling predation. All but 1 or 2 of 34 producers said that their fences were a good investment, that they would install more electric fence or additional wires if future losses were high, and that they would recommend electric fencing as a predator damage control technique to other producers.
Discussion
Our 1977 field tests in North Dakota showed that an all-electric, 168-cm high, 12-wire fence excluded coyotes. However, further studies are needed to determine the minimum effective height. Our data indicate that this should be somewhere between 76 and 168 cm. These field trials should be conducted in several areas of the west as coyote fence-crossing behavior apparently varies geogra- phically. According to Fish and Wildlife Service predator control specialists, coyotes in the southern states generally pass either under or through standard woven-wire sheep fences (M. Caroline, pers. comm.), whereas in the north the great majority jump over such fences (W. Pfeifer, pers. comm.). These observations, while not documented in the literature, are based on numerous sightings of coyotes in or around sheep pastures, tracks left in sand or snow,
and coyotes taken in steel traps or snares set in “slide” holes beneath sheep fences. This variation in coyote behavior may be due to frozen ground (making digging difficult) and snow drifted against fences in the north, as opposed to the loose, sandy soils commonly present in many areas of the southwest. Regardless of the reasons for the variation in fence-crossing behavior, lower and less costly electric fences may prove to be effective in the southern states. The use of offset electric wires on woven-wire sheep fences in the north may not be effective unless additional wires are positi- oned above the existing fence.
One limitation of our preliminary field tests in 1977 and 1978 was the termination of the tests following a 60-day coyote exclu- sion period. It is well known that coyotes can learn to evade or circumvent various depredation control techniques and the proba- bility of this occurring after prolonged exposure to electric fences can only be assessed by conducting long-term field trials.
Only a relatively few farm or semi-farm flock sheep producers have erected electric fences or wires for excluding coyotes from their pastures. Several factors may be responsible: prior experience with some high-impedance chargers shorting out during rainy periods or in weed-choked fence lines, the necessity of removing existing woven wire boundary fences before all-electric fences can be erected, and probably most important, the initial cost of electric fencing materials and installation. As of June 1980, all materials needed (less charger) for constructing 1 mile of a seven-wire “coy- ote/ dog” fence sold by one distributor was $1,150. Materials for I mile of our 12-wire fence cost about $1,580. Material costs for perimeter fencing I mile* with the 7- or I2-wire configurations were $4,330 and $5,690, respectively. Excluding labor costs for installa- tion and assuming a stocking rate of 100 sheep per mile*, a market value of $75 per sheep, an annual predator loss of S%, and that the electric fence completely stops predator losses, the cost of fencing materials would be amortized in about I 1.5 (7-wire) or 15.0 (12- wire) years. A more realistic appraisal of amortization might be to calculate the cost of installing a four-wire electric fence for sheep confinement purposes only and to then consider the additional cost of materials required to build a predator-proof fence. Materials to fence 1 mile* with four wires for sheep confinement was about $2,420. The cost difference for materials to build a 7- or 12-wire fence was $I,9 10 and $3,270, respectively. Using the differences in costs and making the same assumptions listed earlier (i.e., 5% annual loss to coyotes, etc.), the additional material costs for excluding coyotes could therefore be amortized in about 5 and 9 years, respectively. A 10% annual sheep loss to coyotes would, of course, reduce the years required foramortization by half, or 2.5 to 4.5 years.
The above calculations and assumptions could also be applied to the installation of offset electric wires, although existing fences must be in reasonably good condition. Alternate and less costly methods for offsetting wires than the one we used can probably be devised but are beyond the scope of this paper. Obviously, each producer will have to consider all relevant factors to determine whether the cost of building electric fencing or installing electrified wires will result in a favorable cost-benefit investment.
Our survey of producers using electric fences or wires provided valuable information; however, we wish to emphasize that the data gathered were based in part on opinions and estimates from memory. The favorable producer response was impressive, but from prior experience we also know that psychological factors play an important part in user assessment of animal damage control methods. Furthermore, several of the producers who provided information were franchised to sell electric fencing materials and this may have influenced our data.
We tnmk tt important to point out that many of the producers we interviewed felt that while electric fencing or offset electrified wires were of considerable value in deterring predation, they also viewed such fencing as complementing other control techniques such as steel traps, snares, or M-44 devices. Producers often indi- cated to us that while their fences did not completely exclude
coyotes from pastures, the fences did limit access and thus make it much easier to determine where to locate lethal control tools. The opinion was also expressed that the efficacy of electric fencing may, at least in part, be a function of pasture size. Coyotes may be able to live and thrive entirely within large fenced pastures and the prob- lem of removing them could be equally as great as if no electric fencing had been installed. This area of concern obviously needs further investigation.
We were not impressed with some of the fences installed by producers. Poorly braced corner posts that shifted and resulted in sagging wires, especially when rain or melted snow softened the earth, were common. Poor grounding and poor insulation of positive-charged wires resulted in low line voltages as measured with our voltmeters. Another shortcoming we noted was a failure to block gullies, water courses, or other depressions with charged drop wires. Finally, we felt that some producers were not inspect- ing and maintaining their fences as evidenced by broken line posts, wires found lying on the ground, and broken insulators. These deficiencies point out the importance of providing instructional and educational material to producers and the value of knowledge- able extension specialists and demonstration projects.
One problem with our survey was that many of the producers we interviewed had recently installed or were just installing their electric fences. We believe that another survey, conducted after electric fences have been in use for a few years, would be a worth- while project. Assuming willing cooperators are available, an alter- nate approach worth consideration is the close, periodic monitoring of selected ranches on which fences have been erected to assess their effectiveness over a period of several years.
One electric fencing application we were unable to adequately assess was the use of temporary or portable electric fences to exclude predators. Such fences could be a valuable technique for rotational grazing, on leased pastures, or around bedgrounds. We suggest that further studies of this application be undertaken. Finally, field data are not available to permit judgment as to the relative merits of low versus high output impedance chargers and their capability to maintain adequate line voltages under adverse weather and vegetative conditions. Although laboratory tests sug- gested that low impedance chargers perform better, field tests on
identical areas using both types simultaneously with precise mea- surements of such factors as rainfall, moisture, and fence-line vegetation, should clarify this issue.
Our electric fencing research indicates that this technique has considerable potential for protecting pastured sheep from coyotes, providing fences are properly installed and when a combination of various factors result in a favorable cost-benefit investment for the producer. Intensive and long-term studies are still needed to clarify such factors as minimum effective heights, wire spacings, relative merits of available equipment, applicability to various sheep man- agement situations, and the ability of coyotes to evade or circum- vent electric fences over a period of time.
Literature Cited
Bowns, J.E. 1976. Field criteria for predator damage assessment. Utah Sci. 37:26-30.
Dorrance, M.J., and J. Bourne. 1980. An evaluation of anti-coyote electric fencing. J. Range Manage. 33:385-387.
Gates, N. 1978. Constructing an effective anticoyote electric fence. U.S. Dep. Agr., Agr. Res. Serv. Leaflet 565. 5 p.
Gates, N.L., J.E. Rich, D.D. Godtel, and C.V. Hulet. 1978. Development and evaluation of anti-coyote electric fencing. J. Range Manage. 3 1: 15 I -
153.
Henderson, J. 1978. Electric fence installation. Fence Industry, May, 1978. p. 17-18.
Henne, D.R. 1975. Domestic sheep mortality on a western Montana ranch. M.S. Thesis, Univ. Montana. 53 p.
Larson, G.E., M.H. Wallace, J.M. Lewis, and M.E. Mansfield. 1975. Coyote predation in sheep. 111. Agr. Exp. Sta. DSAC 3, Feb., 1975. p. 101-104.
Rowley, I. 1970. Lamb predation in Australia; incidence, predisposing conditions, and the identification of wounds. CSIRO Wildl. Res. 15:79-
123.
Shelton, M. 1977. Electric fencing as a means of deterring coyote predation. Ranch Mag. 58: 1-3.
Thompson, B.C. 1976. Evaluation of wire fences for control of coyote predations. M.S. Thesis, Oregon State Univ., Corvallis. 59 p. Thompson, B.C. 1979. Evaluation of wire fences for coyote control. J.
Range Manage. 32:457-461.
Wallace, M.H. 1975. Better and cheaper fences for sheep. 111. Agr. Exp. Sta. DSAC 3, Feb., 1975. p. 105-106.
Four Copies, Please
Authors submitting manuscripts to the Journal of Range Management are reminded to send 4 copies instead of the former 3. The additional copy should expedite the review process. In the case of photographs and figures, Xerox copies are adequate for review purposes if the procurring of additional prints would pose a hardship. Manuscripts with insufficient copies will be delayed in Denver until the required copies arrive.
Influence of Crusting Soil Surfaces on Emer-
gence and Establishment of Crested Wheat-
grass, Squirreltail, Thurber Needlegrass,
and Fourwing Saltbush
M. KARL WOOD, RICHARD E. ECKERT, JR., WILBERT H. BLACKBURN, AND FREDERICK F. PETERSON
Abstract
Crusting soil surfaces with vesicular pores occur in arid and semiarid regions of the world where herbaceous vegetation is sparse. Morphological properties of crusting surfaces can impair seedling emergence and plant establishment. This study evaluated site preparation and seeding methods and species useful for encouraging successful stand establishment in such soils. Plowing to prepare a seedbed reduced seedling emergence on some soils but increased plant establishment on all soils. More seedlings emerged and established on non-crusting coppice soil beneath shrubs than on crusting interspace soil between shrubs. Crested wheatgrass was the most successful species followed closely by squirreltail and distantly by Thurber needlegrass and fourwing saltbush. Fourwing saltbush seedlings became established and grew well in some treat- ments. Seedling emergence and establishment were highest with the deep-furrow seeding technique on the non-crusting coppice soil. The standard-drill technique gave the best stand on the site with the largest surface cover of bare, crusting interspace soil.
Soils with crusting surfaces occur in many arid and semiarid regions of the world. Various features of these soils in the western United States were described by Hugie and Passey (1964) and Schlatterer (1968). In the Great Basin these soils commonly are associated with northern-desert shrub and salt-desert shrub plant communities that have sparse herbaceous vegetation. In northern Nevada, such soils are found in the Humboldt Loess Belt, an &million-ha area of shallow, windblown silt and very fine sand deposition. These soils are on gently sloping fan piedmonts and nearly level alluvial flats. They include both typic and xerollic Durargids, Haplargids, Nadurargids, and Natrargids and have moderately fine and fine textured B2t horizons. These soils gener- ally are crusted between shrubs (interspace soil) and are non- crusted beneath the shrubs (coppice soil) (Stuart et al. 1971, Blackburn 1975). The microtopographic positions, surface physi- ognomy, and morphological characteristics of the A horizon were presented by Eckert et al. in 1978. These surficial features are not mapped or measured even in detailed soil surveys, but must be determined on a site by site basis. The crusting interspace surfaces commonly are sandy loam, loam, or silt texture high in very fine sand or silt, with low organic matter content, are massive, and have vesicular pores. These factors contribute to the unfavorable behav-
The authors are presently assistant professor of watershed management, Depart- ment of Animal and Range Sciences and Range Improvement Task Force, New Mexico State University, Las Cruces, 88003; range scientist, U.S. Dep. Agr., Agr. Res. Serv. Renewable Resources Center, University of Nevada, 920 Valley Road, Reno, 89512; professor of watershed management, Range Science Department, Texas A&M University, College Station, 77843; and professor of Soil Science, Plant, Soil. and Water Science Division, University of Nevada, Reno, 89512.
This study was a cooperative investigation among U.S. Dep. Agr., Agr. Res. Serv., Bureau of Land Management, and Agr. Exp. Sta., Univ. of Nevada, Reno. Journal Series No. 483.
Plant nomenclature follows Plummer et al. (1977). Manuscript received August 20, I98 I.
282
ior of this surface: unstable and slakes when saturated, dries to a crust that can reduce seedling emergence (Wood et al. 1978), and has a low water infiltration rate and high sediment production (Blackburn 1975).
Wood et al. (1978) stated that rangelands with these kinds of soils have higher potential productivity than their present fair to poor condition suggests. These authors postulated that theareas of crusting interspace soil increase with overgrazing, loss of herbace- ous cover, and lowered range condition at the expense of non- crusting coppice surface soil. They also stated that revegetation of these problem soils through grazing management alone would be difficult, if not impossible, in a reasonable time and that artificial seeding methods are required to establish forage species. There- fore, we evaluated seedling emergence and plant establishment of various species seeded by different techniques on soils with crust- ing and non-crusting surfaces.
Methods
Four study sites in the big sagebrush vegetation type in north central Nevada were selected to represent a wide range of soils with a crusting AI1 horizon (Table 1). Plots at Lower Coils Creek and Paradise Valley were seeded in the falls of 1974, 1975, 1976, and 1977. The Upper Coils Creek and Panther Canyon sites were seeded in all years except 1977.
Forty 6-m* plots were established within a OS-ha exclosure at each site. The first year (1974) 20 plots were plowed with a mold- board plow to remove competition and prepare a seedbed. Plowing mixed only about 10 to 15 cm of the A horizon. Brush was cleared manually with minimal soil disturbance on the remaining 20 plots. Because the plowed soil crusted and emergence was drastically lower than that in the unplowed soil for all seeding methods, the plowing treatment was discontinued after 1974. Four species, crested wheatgrass (Agropyron desertorum), squirreltail (Sitanion
hystrix), Thurber needlegrass (Stipa thurberiana), and fourwing saltbush (Atriplex canescens) were seeded in mid-October of each year. Total precipitation was measured at each study site for the period between planting and seedling evaluation in mid-May. Surface soil samples (AI1 horizon) were collected at each seeding site and analyzed for particle size (Bouyoucos 1962), organic mat- ter by a modified Walkley-Black method (Peech et al. 1947), and modulus of rupture (Reeve 1965).
The kind of soil surface on each seeded row was described as either coppice or interspace before planting. Two kinds of simu- lated furrows were used. Both were made with a hoe. A standard- rangeland drill technique was used to seed the plowed treatment in 1974 and the unplowed treatments in all years. These furrows were 2 cm deep by 6 m long. A deep-furrow rangeland drill technique (McGinnies 1959) was also used in each year. These furrows were
12.5 cm deep by 6 m long. Seed was planted in four furrows of each
Table 1. Description of study sites.
Precipitation Cover of morpho- Shrub foliar cover; grass
Site Location
(mid October-mid May) Soil logical surface soil and forb basal cover
(cm) identification (%I) types (%I
Lower Coils Creek 60 km northwest of Eureka in Eureka County
Upper Coils Creek 60 km northwest of Eureka in Eureka County
Panther Canyon 48 km south of Winnemucca, in Pershing County
Paradise Valley 65 km north of Winnemucca, in Humboldt County
Long term average-l 8 mostly as snow.’ 1974-75-18 I975-76- I2 1976-77-I I 1977-78-20
Long term average-l 8 mostly as snow.
1974-75-22 1975-76- I4 1976-77- 1 I
Long term average-l 7 mostly as snow.
1974-75-24 1975-76- 16 1976-77- I2
Long term average- 17, mostly as snow. 1974-75-17 1975-76- IO 1977-78-25
Fine, montmorillonitic, Coppice-58 mesic, Abruptic Interspace-42 Xerollic
Durargids
Fine, montmorillonitic, Coppice-50 mesic, Xerollic Interspace-50 Durargids
Fine, montmorillonitic Coppice- IO0 mesic, Xerollic Interspace-O Haplargids
Fine, loamy, mixed, Coppice-35 mesic, Abruptic Interspace-65 Xerollic Duragids
Big sagebrush (Arremisia
tridentala) 22.2 Low sagebrush (Arremisia
arbuscuie) I .4
Sandberg bluegrass (Poa
sandbergii) I. I Squirreltail (Siranion
hysrrix) 0.02
Big sagebrush 22.0 Low sagebrush 1.7 Yellowbrush (Chrysotham-
nus vicidjflorus) 0.2
Thurber needlegrass (Stipa
rhurberiana) I .6
Sandberg bluegrass I .6 Squirreltail 0.7
Big sagebrush 19.3 Spiny hopsage (Grayia
spinosu) I. I
Sandberg bluegrass 6.7 Great Basin wildrye
(El_vmus cinereus) 0.7
Cheatgrass
(Bromus rectorum) 4.4
Big sagebrush 16.5 Gray horsebrush
(Tetramia canescens) 0.2
Crested wheatgrass
(Agropyron desertorum) 0.7
Squirreltail 0.5 Sandberg bluegrass 0.3 Cheatgrass I .3 Tumble mustard
(Sisymbriam altissimum) 0.5
‘Long term averages were taken from the closest weather station with at least 30 years of records.
type at a rate of one seed per I .3 cm of row and covered with 1.5 cm of soil. Seed was also broadcast and covered by simulated cow trampling. Within each 6-m2 plot, nine randomly located hoofprint-sized microplots (11 cm2) were used for each species. Five seeds were placed in each microplot. The planter simulated a hoofprint by placing his boot heel on the seeds and rotating the boot horizontally 90”. The object of this treatment was to disturb the surface soil but not to compact the soil. Seed was also broad- cast with no simulated cow trampling on nine 30 cm2 microplots of each species within each 6-m2 plot. Twenty grass seeds or ten fourwing saltbush seeds were placed in each untrampled micro- plot. Each simulated seeding technique was replicated five times. Seedlings that emerged from coppice or interspace soil were counted in mid-May of each year. The number of grass seedlings was converted to percent emergence based on the number of seeds planted in rows or in the broadcast microplots. Since emergence of fourwing saltbush was very low, the stand was evaluated by dis- tance between established plants rather than by percent emergence. In the fall of 1976, the frequency of established grass and shrub plants per 30 cm of row or for each microplot in the broadcast treatment was determined for all variables tested in 1974and 1975. Frequency was not determined for the 1976 study, because the seeding failed, or for the 1977 study. A frequency of 100% indicates at least one established plant per 30 cm of seeded row or one plant for each microplot in broadcast treatments. A frequency of 50% indicates at least one established plant per 60 cm of row or one plant on at least half the microplots. Data were analyzed by an analysis of variance. Differences among means were evaluated
JOURNAL OF RANGE MANAGEMENT 35(3), May 1982
with Duncan’s multiple range test (P<O.O5). Seedling Emergence
Precipitation
Precipitation from October, 1974, through May, 1975, was aver- age to above average at all locations (Table 1) with below average rainfall in June and July. Precipitation from October, 1975, through May, 1976, was below the long-term average; however, summer rainfall was much above average (particularly at Paradise Valley) and ranged from 9 to 14 cm. Precipitation during 1976-77 was much below average, resulted in a regional drought, and all seedings failed. This drought ended in 1977-78 with aboveaverage winter-spring precipitation and little summer rain. Overall seedling emergence followed the precipitation trend with higher emergence in 1974-75 (15.9%) and 1977-78 (14.3%) than in 1975-76 (7.0%). Soil moisture is the major limiting factor for seed germination and seedling emergence and establishment on semiarid rangelands in the Great Basin. Also, the risk of seeding failure increases particu- larly on problem surface soils because of the influence of hard surface crusts as indicated by modulus of rupture measurements (Table 2) and low infiltration rates (Blackburn 1975).
Site
In 1975, seedling emergence was greater at Paradise Valley and Upper Coils Creek than at the other two locations (Table 3). Emergence at all locations was higher in 1975 than in 1976, and at Paradise Valley and Lower Coils Creek emergence was highest in 1975 and 1978, respectively.
Table 2. Mean particle size distribution (%), organic matter content (%), and modulus of rupture (mbars) of AI1 horizon at each site.
Particle size Modulus of
Surface soil Interspace
Study site Lower Coils Creek Upper Coils Creek Panther Canyon Paradise Valley
Sand Silt
44 36
29 49
47 37
42 46
Clay 20 22 16 I2
Organic matter rupture
1.6 76
2.1 61
1.3 56
0.6 84
Coppice Lower Coils Creek 55 33 I2 3.6 I8
Upper Coils Creek 36 48 I6 5.8 0
Panther Canyon 46 38 I6 4.0 5
Paradise Valley 42 44 14 3.5 0
Seedbed Preparation and Seeding Method
Plowing did not increase seedling emergence at any site and significantly reduced emergence from 17.9 to 13.7%at Upper Coils Creeks and from 12.3 to 5.7% at Paradise Valley, respectively. After plowing, coppice and interspace soils were not distinguisha-
ble since the plowed surface slaked into a crust over the entire treated area.
Seedling emergence in standard and deep furrows in 1975 was similar on three sites (Table 3). At Upper Coils Creek emergence was higher in deep than in standard furrows. This site has the greatest cover of perennial grasses (Table 1). Deep furrowing probably enhanced emergence by removing competing vegetation from the seeded row, while the standard-drill treatment placed seed directly into the competing vegetation. In the dry year of 1976-77, overall seedling emergence was greater in deep than in standard furrows. The difference between seeding methods was significant only at Upper Coils Creek but the trend at the other locations indicated a favorable response to deep furrows. Evans et al. (1970) showed that deep furrows improve the microclimate for seed ger- mination. In the wet year of 1977-78 differences between seeding methods were not significant.
ment with simulated trampling, however, was as successful, or more successful, at Upper Coils Creek (16.7%) and Panther Canyon (16.5%) than were the furrowed treatments, but many seedlings died by early summer. The broadcast treatment with simulated trampling was not effective in 1975 at Lower Coils Creek or Paradise Valley (<4%) because of the strong surface crust, or in 1976 or 1978 at any location. Emergence on the broadcast treat- ment without simulated trampling was very poor (<3%) in all years at all locations, and seedlings that did emerge died by early summer.
Species
Emergence was similar each year for crested wheatgrass and squirreltail seedlings and the average emergence of both species was significantly greater than emergence of Thurber needlegrass (Table 4). More seedlings of crested wheatgrass, squirreltail, and Thurber needlegrass emerged in the moist years of 1974-75 and
1977-78 than in the dry year of 1975-76.
Generally, more seedlings emerged in the standard and deep furrow seeding treatments than in the broadcast treatments (data not shown). Emergence in spring of 1975 on the broadcast treat-
Table 3. Mean yearly emergence (%) for two seeding methods at four
locations averaged over three grass species. Seeding failed in the drought
year of 1976-77.
Emergence of fourwing saltbush was very low, 0.8%. However, when seeded at the rate of one seed/ 1.3 cm of row, this rate of ’ emergence gave about 1 plant/m of row. The furrow treatments gave stands with distance between plants that varied from 0.9-8.4 m, 1 S-20.3 m, and 1.2-2.1 m in the springs of 1975, 1976, and 1978, respectively. The broadcast treatment with trampling failed at Lower Coils Creek and Paradise Valley, but produced stands with 34-121 m between plants at the other two locations. The broadcast treatment without trampling produced stands with 34 to 2280 m between plants at the Coils Creek sites, but planting failed at other locations.
Soil Surface
Seeding methodYear of emergence Standard Deep Location
and location furrow furrow mean
1975 (Average ppt. year)
Lower Coils Creek I 1.4 ayzr 13.6 ayz 12.5 y Paradise Valley 23.5 ax 17.6 ay 20.6 x Upper Coils Creek 15.3 by 22.1 ax 18.7 x Panther Canyon 9.5 az 10.1 az 9.8 y Seeding method mean 14.9 a 15.9 a
1976 (Low ppt. year)
Lower Coils Creek 3.6 ax 6.4 ax 5.0 x Paradise Valley 1.3 ax 5.8 ax 3.6 x Upper Coils Creek 4.5 bx 9.7 ax 7.1 x Panther Canyon 2.0 ax 6.0 ax 4.0 x Seeding method mean 2.8 b 7.0 a
1978 (High ppt. year)
Lower Coils Creek 18.6 ax 16.7 ax 17.6 x Paradise Valley 9.6 ay II.9 ay 10.8 y Seeding method mean 14.1 a 14.3 a
1 Emergence means between seeding methods within year and location followed by the same letter (a or b) or means among locations within year and seeding method follow- ed the same letter (x, y, or z) are not significantly different at the 0.05 probability level as determined by Dunan’s multiple range test.
In the spring of 1975, emergence of each species was higher from the coppice soil than from the interspace soil (Table 4). This response was attributed to the degree of impedance to emerging seedlings by a soil crust. Wood et al. (1978) indicated that varia- tions in crust strength were caused by differences in organic matter that affect aggregation of soil particles. The higher organic matter content of coppice soil (Table 2) resulted in a friable soil with no crust to impede seedling emergence. Emergence in 1976 and 1978 tended to be greater from coppice soil, but the difference was significant only for squirreltail in 1976. The 1976 data reflect a dry year when total germination was reduced and any soil effect was not fully expressed. Lack of a soil-surface effect in 1978 is probably the result of a wet year in which precipitation was sufficient to maintain a soil moisture tension low enough to reduce crusting of the interspace soil. Wood et al. (1978) found similar results in a greenhouse study when interspace soil was kept wet.
Plant Establishment
Precipitation
The long-term impact of a seeding treatment on a species is expressed by the abundance and distribution of established plants of that species. These parameters were evaluated by frequency of occurrence per 30 cm of seeded row. The average frequency of established plants in 1976 was greater from the 1974-75 seeding (51%) than from the 1975-76 seeding (30%) and was no doubt a response to higher emergence and survival in the average precipita-
Table 4. Mean emergence (70) for three grasses seeded in 3 years on two soil surfaces averaged over four locations in 1975 and 1976 and two locations in 1978. Seeding failed in the drought year of 1976-77.
Species Year of emergence
and soil surface Crested wheatgrass Squirreltail Thruber needlegrass Soil mean 1975 (Average ppt. year)
Coppice 29.0 ax1 25.2 ax 9.6 bx 21.3 x
Interspace 14.1 ay 11.5 ay 2.8 by 9.5 y
Species mean 21.1 a 18.4 a 6.0 b
1976 (Low ppt. year)
Coppice 9.1 ax 8.3 ax I.0 bx 6.1 x
Interspace 6.1 ax 4.4 ay 0.6 bx 3.7 x
Species mean 7.6 a 6.4 a 0.8 b
1978 (High ppt. year)
Coppice 21.2 ax 18.4 ax 7.4 bx 15.5 x
Interspace 15.6 ax 16.2 ax 6.2 bx 12.7 x s
Species mean 18.4 a 17.3 a 6.8 b
1 Emergence means among species within year and soil followed by the same letter (a or b) or means between soil surfaces and within year and species followed by the same letter (x or y) are not significantly different at the 0.05 probability level as determined by Duncan’s multiple range test.
tion year of 1974-75 than in the below-average precipitation year of
1975-76.
Seedbed Preparation and Seeding Method
Seedling emergence did not increase, and in some cases decreased on the plowed treatment. However, plant establishment was significantly increased by plowing from 30 to 46% (Table 5). Establishment was highest on the plowed treatment at Panther Canyon (55%) and at the Coils Creek sites, both 53% frequency. Establishment was poorest on the plowed treatment at Paradise Valley (24%) due to disturbance of the AI1 horizon and develop- ment of a massive crust, and on the unplowed treatment at Panther Canyon (16%), due to a dense stand of cheatgrass (Bromus tecto- rum). The combinations of location, plowing, and species that
resulted in the best establishment were: crested wheatgrass on plowed soil at both Coils Creek sites (90% frequency), crested wheatgrass on plowed soil at Panther Canyon (84%), and squirrel- tail on plowed soil at Panther Canyon (81%).
Specific reasons for the positive effect of plowing on establish- ment and growth of seeded species were not determined. Other than the obvious reduction in competitive vegetation, plowing could also improve soil tilth by incorporating surface organic matter, increase aeration and porosity, and modify the environ- ment by creating a very rough microtopography that would catch drifting snow, pond water, and increase the quantity of water percolating into the soil.
Average frequency in 1976 from the 1974-75 seeding was similar in standard (36%) and in deep furrows (40%) (Table 5). On unplowed soil, however, establishment was enhanced by deep
furrows (34%) compared with standard furrows (26%) and each grass species responded favorably to the deep furrow treatment. In plowed soil, average frequency of established plants was the same in both kinds of furrows; however, frequency of crested wheatgrass was significantly greater in standard furrows.
Stand frequency of crested wheatgrass and squirreltail on the broadcast seeding with simulated trampling on plowed soil ranged from 22 to 82% (data not shown). Without trampling, frequencies were similar, but the highest value was 62%. Good seed coverage was obtained in plowed soil by the simulated trampling procedure. Even without trampling, enough “safe sites” (Harper et al. 1965) were available. The rough microtopography, together with some seed coverage by blowing soil, moderated the seedbed environment and permited germination, emergence, and establishment. Stands of Thurber needlegrass and fourwing saltbush were very poor or failures.
Some establishment (17 to 44%) was obtained from broadcast seeding and simulated trampling on the unplowed treatment at Lower Soils Creek. Most of these plants were on the coppice soil where some microrelief occurred. On interspace soil, even with simulated trampling, seed coverage was not adequate for germina- tion, emergence, and establishment because seed was planted directly into the surface crust. Establishment was very low (2 to 4%) on sites with competitive herbaceous vegetation. Establish- ment at Paradise Valley was very low (16%) because the interspace soil makes up most of the surface cover and most microplots were on this soil.
Table 5. Mean frequency (%) per 30 cm of row of established grass and shrub plants in 1976 seeded by two methods on plowed and unplowed soil in 1974.
Plowine treatment
Unplowed Plowed
Seeding method
Species Standard furrow Deep furrow Species mean Standard furrow Deep furrow Species mean
Crested wheatgrass 45 d’ 56 c 51 w 84 a 73 b 78 u
Squirreltail 31 e 46 d 39 x 65 b 69 b 67 v
Thurber needlegrass 18 g 27 ef 23 Y 17 g 24 e-g 20 Y
Fourwing saltbush 7h 7h 72 19 gh 20 gh 20 Y
Plowing mean 30 46
‘Establishment means for seeding
‘Establishment means for seeding methods followed by the same letter (a-h), and for species followed by the same letter (u-z) are not significantly different at the 0.05 level of probability as determined by Duncan’s multiple range test.